. 2020 Sep;6(3):353-361.
doi: 10.1016/j.aninu.2020.03.003. Epub 2020 Apr 11.

Effect of different starch sources in a raw meat-based diet on fecal microbiome in dogs housed in a shelter

Affiliations

Effect of different starch sources in a raw meat-based diet on fecal microbiome in dogs housed in a shelter

Misa Sandri et al. Anim Nutr. 2020 Sep.

Abstract

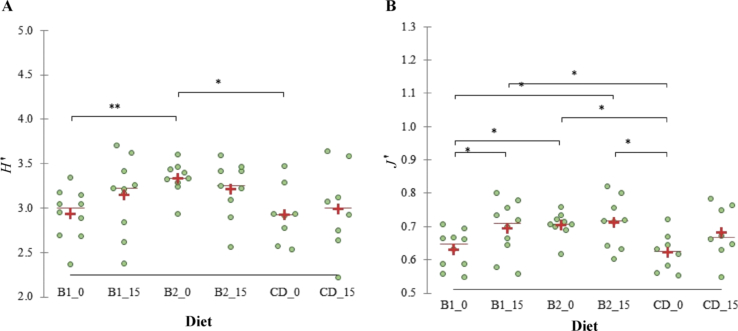
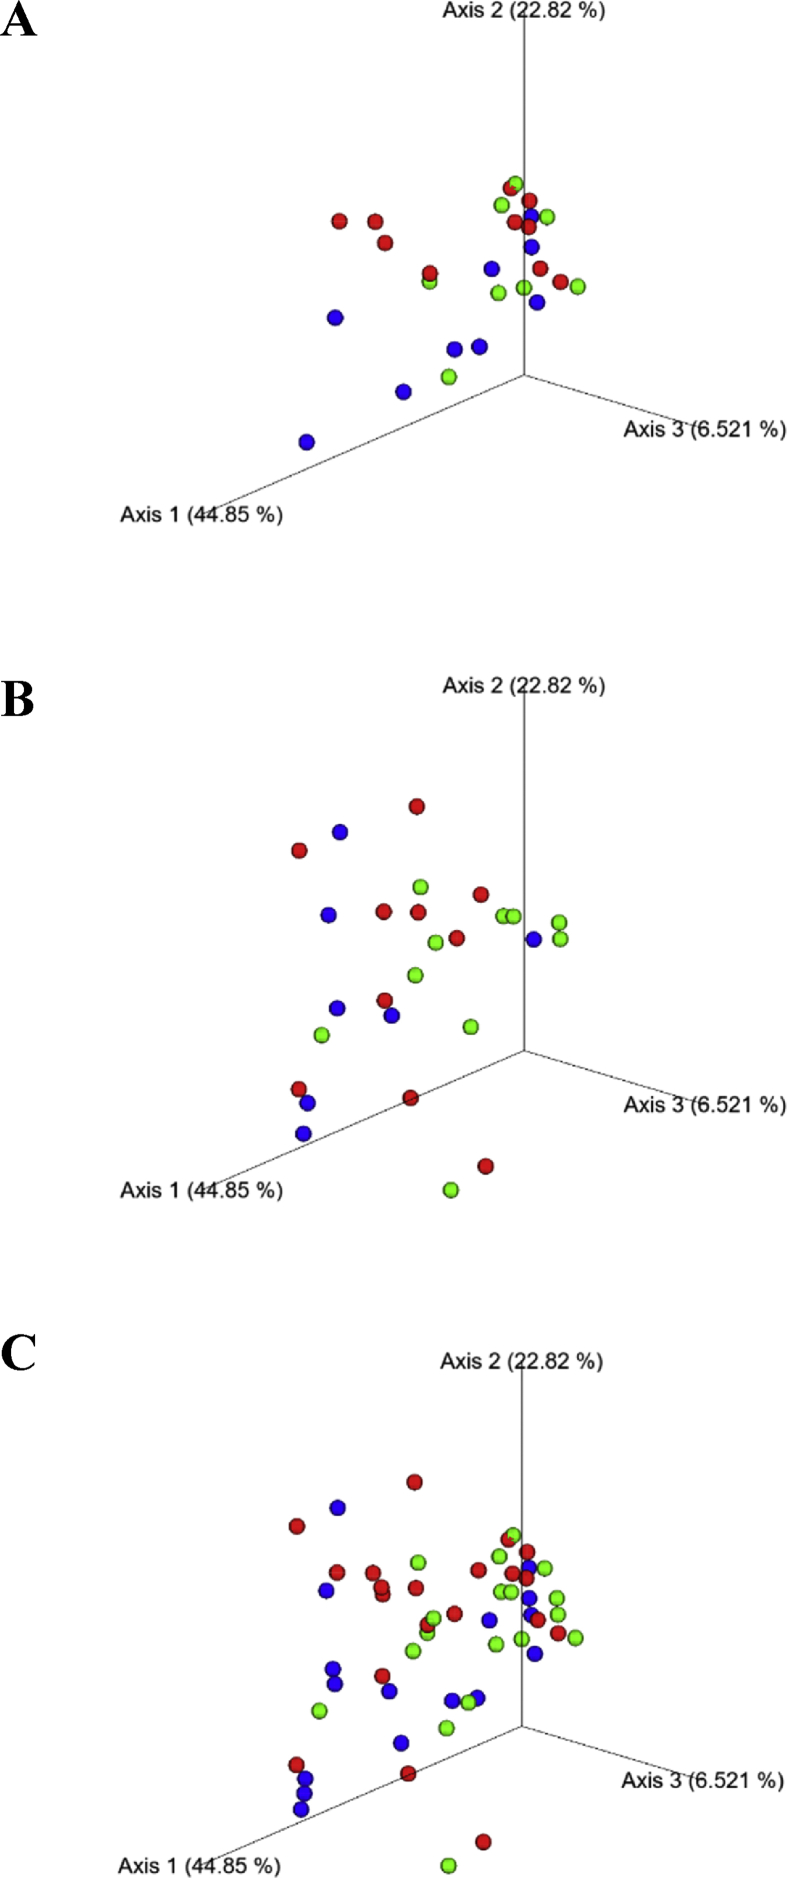
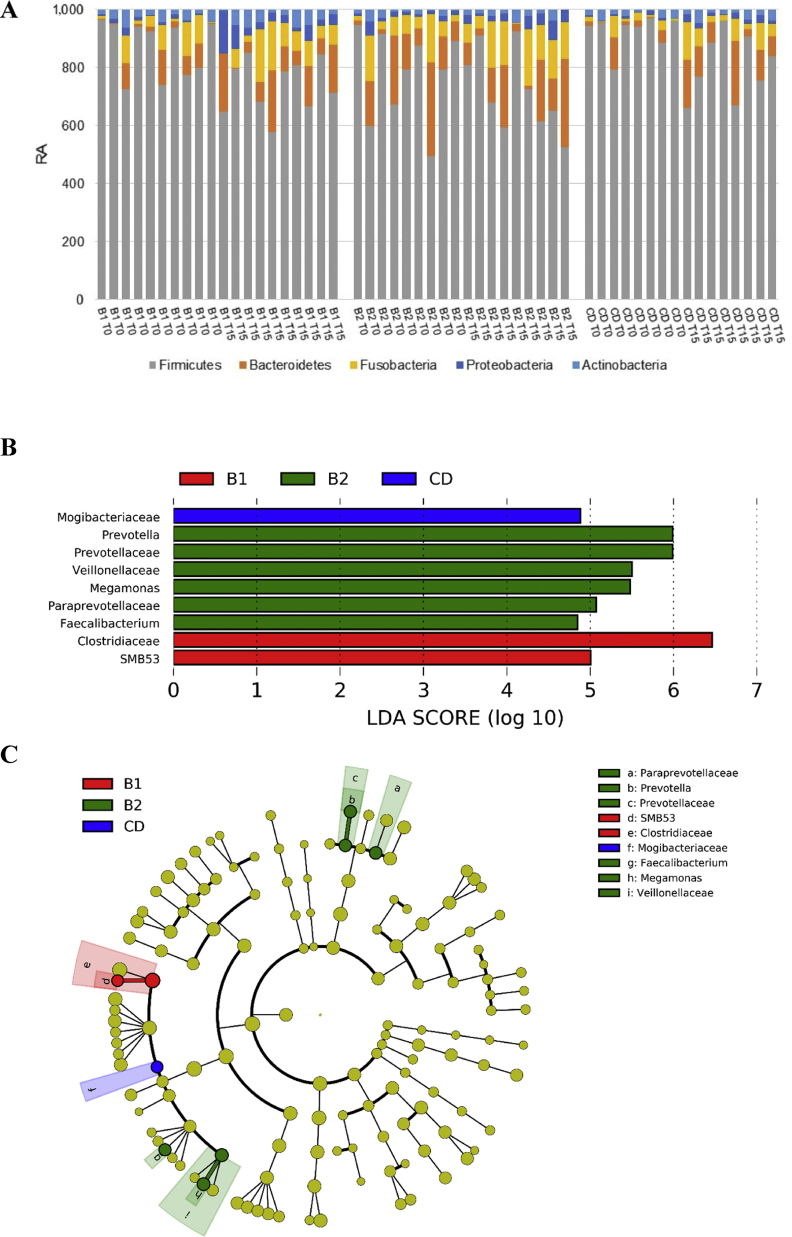
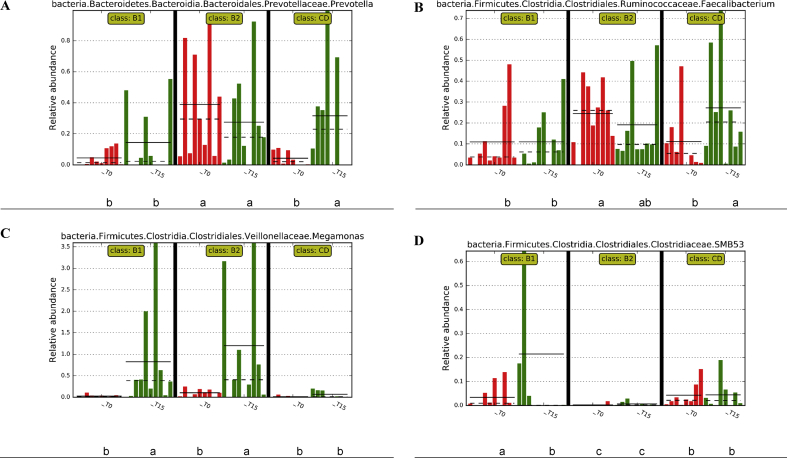
A dietary intervention study was assessed to determine if different sources of starch in homemade diets could significantly modify fecal microbiome of dogs. Twenty-seven adult dogs were enrolled and fed a diet based on a mixture of rice and pasta with fresh raw meat (CD). After 90 d, 8 dogs continued to receive CD diet, 10 dogs received a diet made of a raw meat and a complementary food with rice as the main source of starch (B1), and 9 dogs were fed a diet with the same raw meat and a complementary food with potato as the main source of starch (B2). Samples of feces were collected from each dog in the mornings at the beginning of the study and after 15 d and analyzed for pH, ammonia N (N-NH3) and total N, short chain fatty acids (SCFA) and lactic acid. Relative abundance of fecal microbiota was assessed by sequencing and annotating the V3-V4 regions of the 16S rRNA. Total starch intake was similar between diets but differed in the in vitro rate digestion and in the resistant starch, which was higher in B2 than in B1 and CD diets. Dogs fed B2 diet showed lower (P < 0.05) N-NH3 and pH but higher (P < 0.05) molar proportion of lactic acid. Linear discriminant analysis of the genera relative abundances indicated a significant (P < 0.01) increase of SMB53 genus at the end of the study in B1 diet and of Megamonas genus in B1 and B2 diets in comparison to CD diet. These results suggest that changes of starch source in a raw meat-based diet have limited effects on fecal microbiome in healthy dogs, but underline a high variability of microbiota among dogs.

Keywords: Canis lupus familiaris; Diets; Microbiome; Nutrition; Starch fraction.


Conflict of interest statement

We declare that we have no financial and personal relationships with other people or organizations that can inappropriately influence our work, there is no professional or other personal interest of any nature or kind in any product, service and/or company that could be construed as influencing the content of this paper.

Figures

Fig. 1
Fig. 1
Determination of microorganisms in dog feces. (A) Shannon index of biodiversity (H′) and (B) evenness (J′) calculated on the microbial genera measured in the feces of dogs fed a control diet (CD), rice based diet (B1) or potato based diet (B2), at the beginning of the study (sampling time T0) and after 15 d of administration of the diets (sampling time T15). Green dots denotes dogs, red line the median and the red cross the mean for each group. Legend of x-axis: B1_0, raw meat with a complementary food made of rice as the main source of starch at T0; B1_15, raw meat with a complementary food made of rice as the main source of starch at T15; B2_0, raw meat with a complementary food made of potato as the main source of starch at T0; B2_15, raw meat with a complementary food made of potato as the main source of starch at T15; CD_0, raw meat with a complementary food made of pasta and rice as the main source of starch at T0; CD_15, raw meat with a complementary food made of pasta and rice as the main source of starch at T15. ∗, P < 0.05; ∗∗, P < 0.01.
Fig. 2
Fig. 2
Principal coordinates analysis (PCoA) of microbial communities from the fecal samples of dogs. This figure shows a 3D PCoA plot based on weighted UniFrac distances of 16S rRNA genes. (A) the samples collected at the beginning of the study (sampling time T0). (B) the samples collected after 15 d of administration of experimental diets (sampling time T15). (C) shows all the samples collected at T0 and T15. Green dots refer to control diet (CD), made with pasta and rice as main sources of starch in a ratio 1:1 and raw meat; red dots refer to a rice-based diet (B1), with a complementary food made of rice as the main source of starch and raw meat; blue dots refers to a potato-based diet (B2), with a complementary food made of potato as the main source of starch and raw meat. Each dot was an individual and analysis of similarity did not reveal clustering between the 3 groups (P > 0.05).
Fig. 3
Fig. 3
Composition of the fecal microbial communities at different taxonomic levels measured in the fecal samples of dogs. (A) The composition of the fecal microbial community at the phylum level of dogs, (B) the histogram and (C) the cladogram of the linear discriminant analysis (LDA) scores for taxa differentially abundant (P < 0.01) between diets. RA = relative abundance; CD = control diet, made with pasta and rice as main sources of starch in a ratio 1:1 and raw meat; B1 refers to a rice-based diet with a complementary food made of rice as the main source of starch and raw meat; B2 refers to a potato-based diet with a complementary food made of potato as the main source of starch and raw meat; T0 refers to sampling time at the beginning of the study; T15 refers to sampling time which was after 15 d of administration of experimental diets.
Fig. 4
Fig. 4
Relative abundances of genera measured in the fecal samples of dogs. (A) Prevotella, (B) Faecalibacterium, (C) Megamonas, and (D) SMB53. Dogs were fed control diet (CD), rice-based diet (B1) or potato-based diet (B2) and samples collected at sampling time T0 and sampling time T15. Different letters a, b and c, below the graph of each genus denote the mean which significantly differed (P < 0.01) between diets and times of sampling. CD = control diet, made with pasta and rice as main source of starch in a ratio 1:1 and raw meat; B1 = diet with a complementary food made of rice as main source of starch and raw meat; B2 = diet with a complementary food made of potato as main source of starch and raw meat; T0 = sampling time at the beginning of the study; T15 = sampling time which was after 15 d of administration of experimental diets.

References

    1. Addinsoft . 2019. XLSTAT Statistical and data analysis solution.https://www.xlstat.com Boston, MA, USA.
    1. Algya K.M., Cross T.L., Leuck K.N., Kastner M.E., Baba T., Lye L., de Godoy M.R.C., Swanson K.S. Apparent total tract macronutrient digestibility, serum chemistry, urinalysis, and fecal characteristics, metabolites and microbiota of adult dogs fed extruded, mildly cooked, and raw diets. J Anim Sci. 2018;96:3670–3683. - PMC - PubMed
    1. AOAC (Association of Official Analytical Chemists) 17th ed. 2000. Official methods of analysis. Gaithersburg, MD, USA.
    1. Arendt M., Fall T., Lindblad-Toh K., Axelsson E. Amylase activity is associated with AMY2B copy numbers in dog: implications for dog domestication, diet and diabetes. Anim Genet. 2014;45:716–722. - PMC - PubMed
    1. Bazolli R.S., Vasconcellos R.S., de-Oliveira L.D., Sá F.C., Pereira G.T., Carciofi A.C. Effect of the particle size of maize, rice, and sorghum in extruded diets for dogs on starch gelatinization, digestibility, and the fecal concentration of fermentation products. J Anim Sci. 2015;93:2956–2966. - PubMed

LinkOut - more resources