. 2020 Sep 23;6(9):e05002.
doi: 10.1016/j.heliyon.2020.e05002. eCollection 2020 Sep.

Heat shock protein 70 positively regulates transforming growth factor-α-induced hepatocellular carcinoma cell migration via the AKT signaling pathway

Affiliations

Heat shock protein 70 positively regulates transforming growth factor-α-induced hepatocellular carcinoma cell migration via the AKT signaling pathway

Kaido Kobayashi et al. Heliyon. .

Abstract

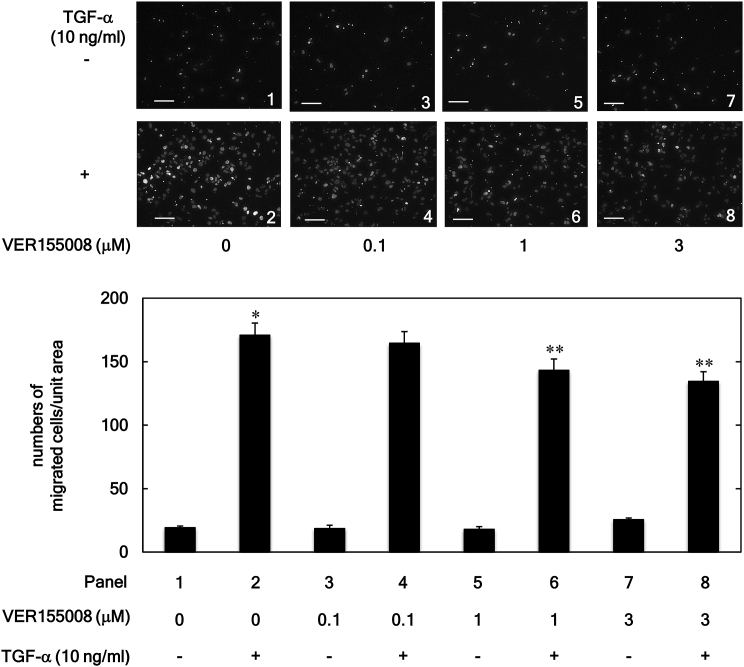
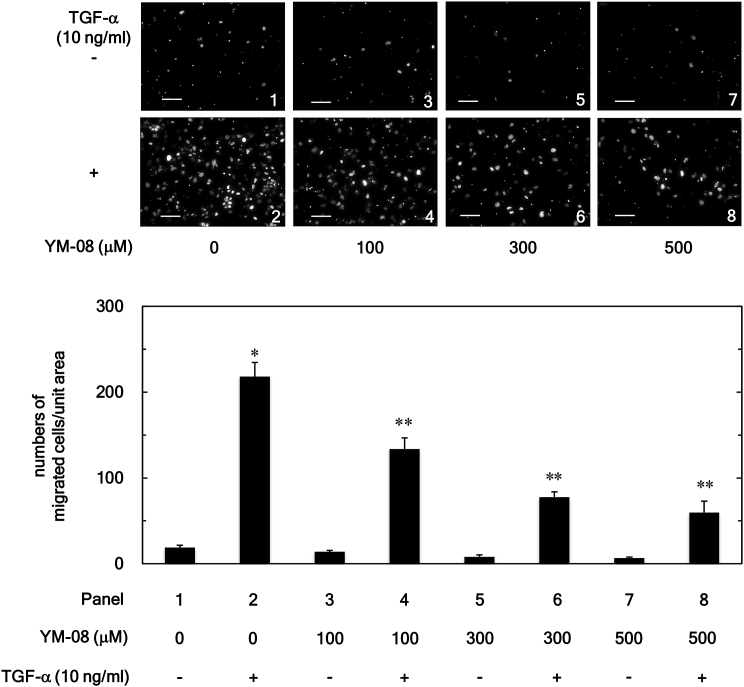
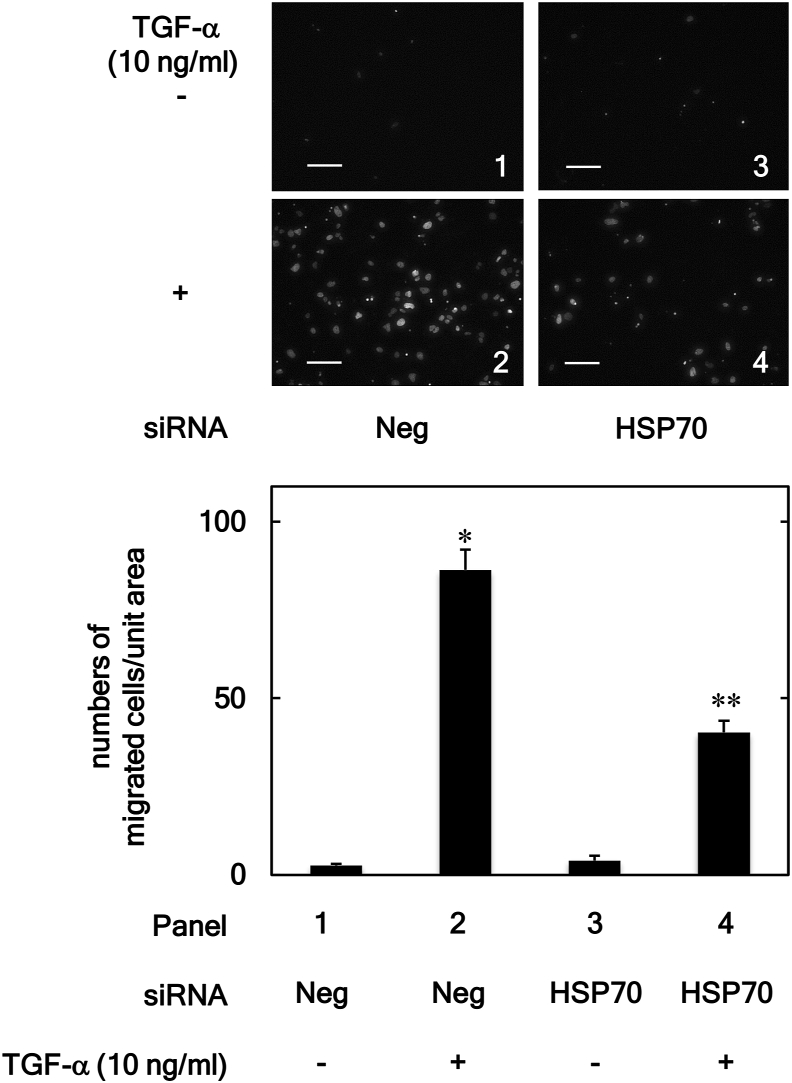
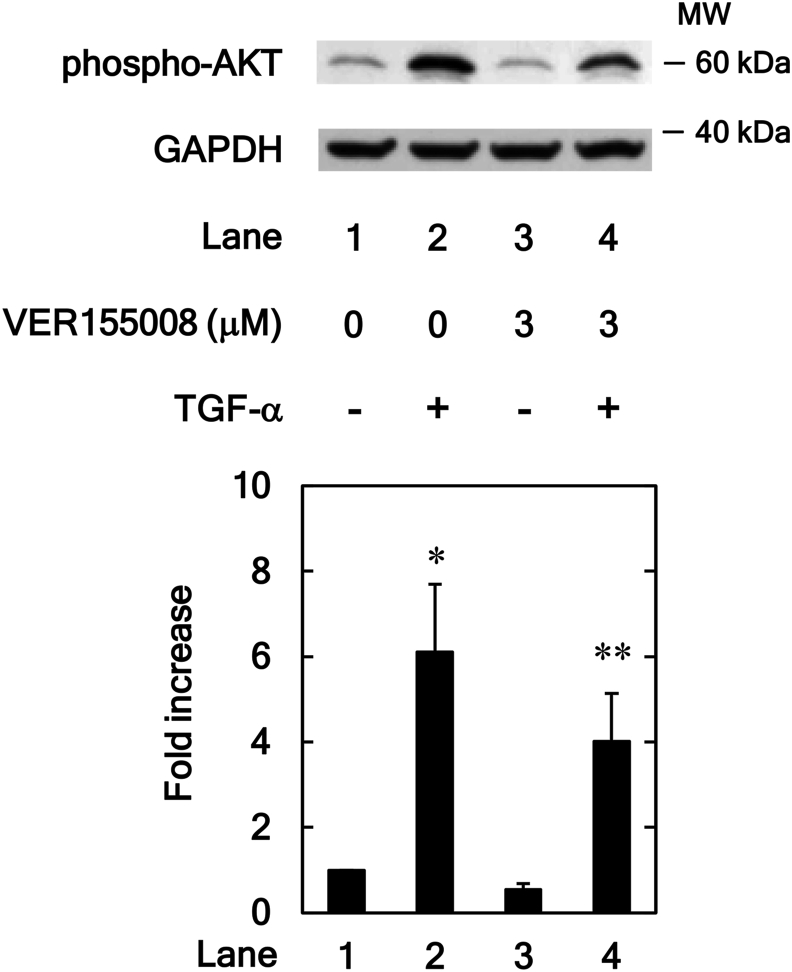
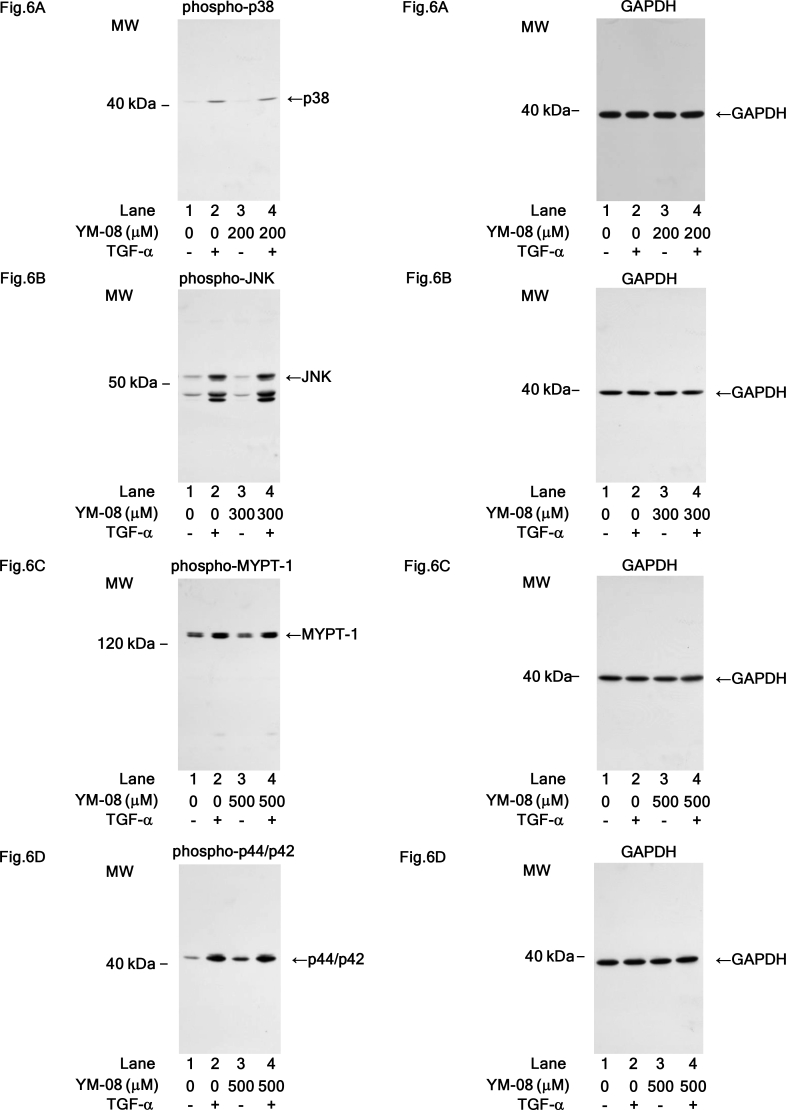
Heat shock proteins (HSPs) are induced in response to extracellular stress and manage the quality of proteins as molecular chaperones. HSP70, a highly conserved HSP, has been reported to correlate with the proliferation and migration of human cancer cells, such as oral, prostate, lung and liver cancer. Regarding hepatocellular carcinoma (HCC), the HSP70 levels in the tumor tissues from patients are significantly higher than those in the normal liver tissues. HSP70 reportedly upregulates the migration and invasion of HCC. The AKT, p38 mitogen-activated protein kinase (MAPK), c-jun N-terminal kinase (JNK) and Rho-kinase signaling pathways regulate the transforming growth factor (TGF)-α-induced migration of human HCC-derived HuH7 cells. However, the exact mechanism underlying the role of HSP70 in growth factor-induced HCC migration remains unclear. Therefore, in the present study, the mechanism underlying the involvement of HSP70 in TGF-α-induced HCC cell migration was investigated. Treatment with the HSP70 inhibitors VER155008 and YM-08 and the downregulation of HSP70 protein were confirmed to significantly suppress the TGF-α-induced cell migration of HuH7 cells. Both VER155008 and YM-08 reduced the TGF-α-induced phosphorylation of AKT without affecting the phosphorylation of p38 MAPK, JNK or Rho-kinase. These results strongly suggest that HSP70 positively regulates the TGF-α-induced migration of HCC cells via the AKT signaling pathway.

Keywords: AKT; Biochemistry; Cancer research; Cell biology; Cell migration; HCC; HSP70; Laboratory medicine; Oncology; TGF-α.


Figures

Figure 1
Figure 1
Effects of VER155008 on the TGF-α-induced HuH7 cell migration. The cells were pretreated with the indicated concentration of VER155008 for 60 min and then stimulated by TGF-α (10 ng/ml) or vehicle for 23 h. The migrated cells were stained with DAPI for the nucleus and then photographed by fluorescent microscopy at a magnification of 20× (upper panel) and counted (bar graph). Each value represents the mean ± SD of triplicate determinations. ∗p < 0.05, versus column 1; ∗∗p < 0.05, versus column 2. Scale bar: 100 μm.
Figure 2
Figure 2
Effects of YM-08 on the TGF-α-induced HuH7 cell migration. The cells were pretreated with the indicated concentration of YM-08 for 60 min and then stimulated by TGF-α (10 ng/ml) or vehicle for 23 h. The migrated cells were stained with DAPI for the nucleus and then photographed by fluorescent microscopy at a magnification of 20× (upper panel) and counted (bar graph). Each value represents the mean ± SD of triplicate determinations. ∗p < 0.05, versus column 1; ∗∗p < 0.05, versus column 2. Scale bar: 100 μm.
Figure 3
Figure 3
Effects of HSP70-siRNA on the TGF-α-induced HuH7 cell migration. The HSP70-siRNA (HSP70) or negative control-siRNA (Neg) transfected cells were stimulated by TGF-α (10 ng/ml) or vehicle for 24 h. The migrated cells were stained with DAPI for the nucleus and then photographed by fluorescent microscopy at a magnification of 20× (upper panel) and counted (bar graph). Each value represents the mean ± SD of triplicate determinations. ∗p < 0.05, versus column 1; ∗∗p < 0.05, versus column 2. Scale bar: 100 μm.
Figure 4
Figure 4
Effects of VER155008 on the TGF-α-induced phosphorylation of p38 MAPK (A), 54 kDa JNK (B), MYPT-1 (C) and p44/p42 MAPK (D) in HuH7 cells. The cells were pretreated with VER155008 (3 μM) or vehicle for 60 min, and then stimulated by TGF-α (30 ng/ml) or vehicle for 5 min for p38 NAPK, 20 min for JNK, 1 min for MYPT-1 and 5min for p44/p42 MAPK. Western blot analyses using antibodies against phospho-specific p38 MAPK, phospho-specific JNK, phospho-specific MYPT-1, phospho-specific p44/p42 MAPK and GAPDH were performed. The bar graphs represent the relative levels of p38 MAPK (A), 54 kDa JNK (B), MYPT-1 (C) and p44/p42 MAPK (D) phosphorylation. The phosphorylation levels were corrected by the levels of GAPDH and then expressed as the fold increase compared with the basal levels presented in lane 1. Each value represents the mean ± SD of triplicate determinations from three independent cell preparations. ∗p < 0.05, versus lane 1. N.S. = Not significant. Non-adjusted images of Figures 4A, 4B, 4C and 4D are provided as supplementary materials (Figure S1).
Figure 5
Figure 5
Effects of VER155008 on the TGF-α-induced phosphorylation of AKT in HuH7 cells. The cells were pretreated with VER155008 (3 μM) or vehicle for 60 min and then stimulated by TGF-α (30 ng/ml) or vehicle for 1 min. Western blot analyses using antibodies against phospho-specific AKT and GAPDH were performed. The bar graph represents the relative levels of AKT phosphorylation. The phosphorylation levels were corrected by the levels of GAPDH and then expressed as the fold increase compared with the basal level presented in lane 1. Each value represents the mean ± SD of triplicate determinations from three independent cell preparations. ∗p < 0.05, versus lane 1; ∗∗p < 0.05, versus lane 2. Non-adjusted images of Figure 5 are provided as supplementary materials (Figure S2).
Figure 6
Figure 6
Effects of YM-08 on the TGF-α-induced phosphorylation of p38 MAPK (A), 54 kDa JNK (B), MYPT-1 (C) and p44/p42 MAPK (D) in HuH7 cells. The cells were pretreated with the indicated concentration of YM-08 for 60 min for p38 MAPK and JNK and 2 h for MYPT-1 and p44/p42 MAPK and then stimulated by TGF-α (30 ng/ml) or vehicle for 5 min for p38 MAPK, 20 min for JNK, 1 min for MYPT-1 and 5 min for p44/42 MAPK. Western blot analyses using antibodies against phospho-specific p38 MAPK, phospho-specific JNK, phospho-specific MYPT-1, phospho-specific p44/p42 MAPK and GAPDH were performed. The bar graphs represent the relative levels of p38 MAPK (A), 54 kDa JNK (B), MYPT-1 (C) and p44/p42 MAPK (D) phosphorylation. The phosphorylation levels were corrected by the levels of GAPDH and then expressed as the fold increase compared with the basal levels presented in lane 1. Each value represents the mean ± SD of triplicate determinations from three independent cell preparations. ∗p < 0.05, versus lane 1. N.S. = Not significant. Non-adjusted images of Figures 6A, 6B, 6C and 6D are provided as supplementary materials (Figure S3).
Figure 7
Figure 7
Effects of YM-08 on the TGF-α-induced phosphorylation of AKT in HuH7 cells. The cells were pretreated with YM-08 (500 μM) or vehicle for 2h and then stimulated by TGF-α (30 ng/ml) or vehicle for 1 min. Western blot analyses using antibodies against phospho-specific AKT and GAPDH were performed. The bar graphs represent the relative levels of AKT phosphorylation. The phosphorylation levels were corrected by the levels of GAPDH and then expressed as the fold increase compared with the basal levels presented in lane 1. Each value represents the mean ± SD of triplicate determinations from three independent cell preparations. ∗p < 0.05, versus lane 1; ∗∗p < 0.05, versus lane 2. Non-adjusted images of Figure 7 are provided as supplementary materials (Figure S4).
Figure 8
Figure 8
A schematic illustration of the regulatory mechanism underlying the role of HSP70 in TGF-α-induced HCC cell migration.
S1
S1
Figures S1, S2 and S4. For Figures 4B, 4C, 5 and 7, the blotted membranes have been cut just above 40 kDa according to protein markers in order to examine the phosphorylated proteins and GAPDH as a housekeeping protein on the same membrane. Therefore, the top (for the phosphorylated proteins) and the bottom (for GAPDH) of each membrane have been detected separately. Thus, the images of these figures are cropped.
S2
S2
S3
S3
S4
S4

Similar articles

Cited by

References

    1. Kumar S., Stokes J., 3rd, Singh U.P. Targeting Hsp70: a possible therapy for cancer. Canc. Lett. 2016;374:156–166. - PMC - PubMed
    1. Wang C., Zhang Y., Guo K. Heat shock proteins in hepatocellular carcinoma: molecular mechanism and therapeutic potential. Int. J. Canc. 2016;138:1824–1834. - PubMed
    1. Wu J., Liu T., Rios Z., Mei Q., Lin X., Cao S. Heat shock proteins and cancer. Trends Pharmacol. Sci. 2017;38:226–256. - PubMed
    1. Boroughs L.K., Antonyak M.A., Johnson J.L., Cerione R.A. A unique role for heat shock protein 70 and its binding partner tissue transglutaminase in cancer cell migration. J. Biol. Chem. 2011;286:37094–37107. - PMC - PubMed
    1. Li H., Li Y., Liu D. Extracellular HSP70/HSP70-PCs promote epithelial-mesenchymal transition of hepatocarcinoma cells. PloS One. 2013;8 - PMC - PubMed