. 2020 Aug 21;2(2):fcaa133.
doi: 10.1093/braincomms/fcaa133. eCollection 2020.

Haploinsufficiency of TANK-binding kinase 1 prepones age-associated neuroinflammatory changes without causing motor neuron degeneration in aged mice

Affiliations

Haploinsufficiency of TANK-binding kinase 1 prepones age-associated neuroinflammatory changes without causing motor neuron degeneration in aged mice

Clara Bruno et al. Brain Commun. .

Abstract

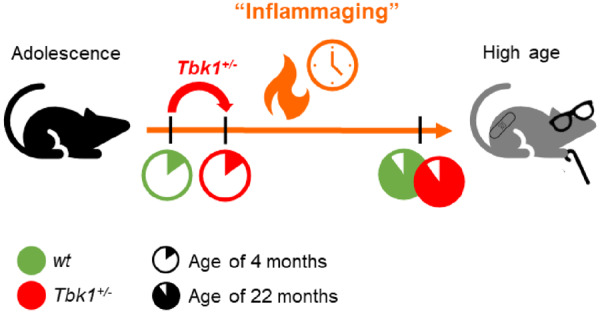
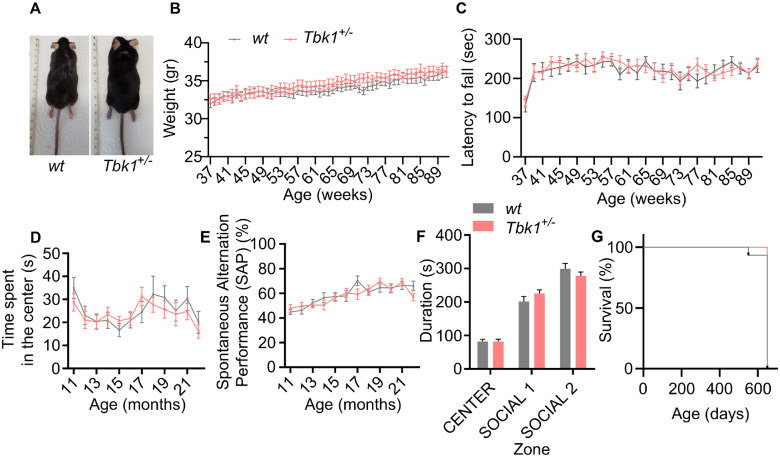
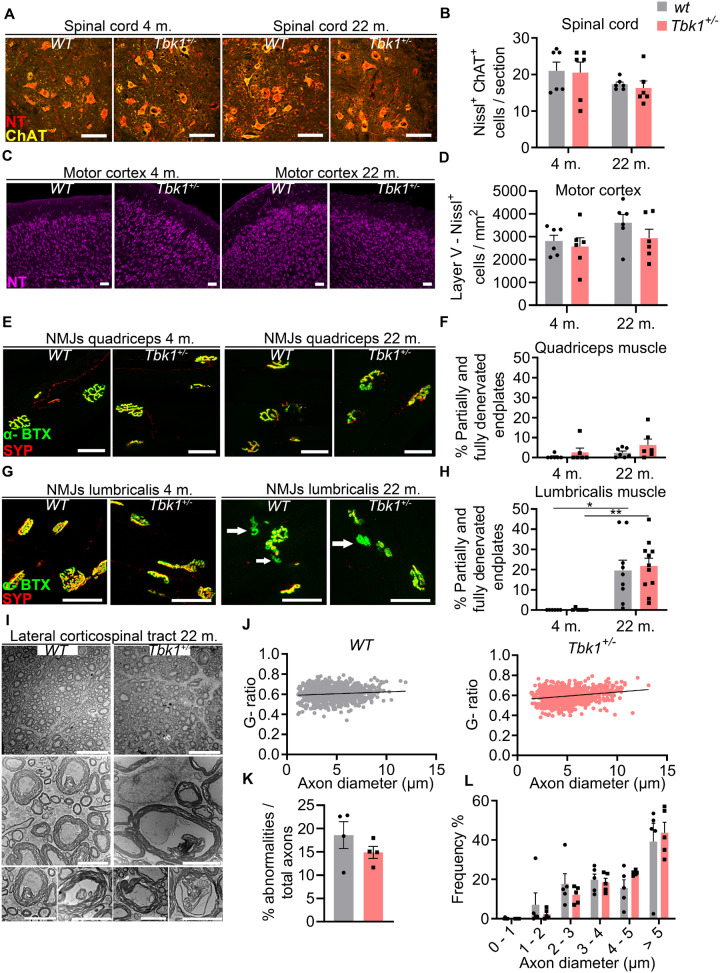
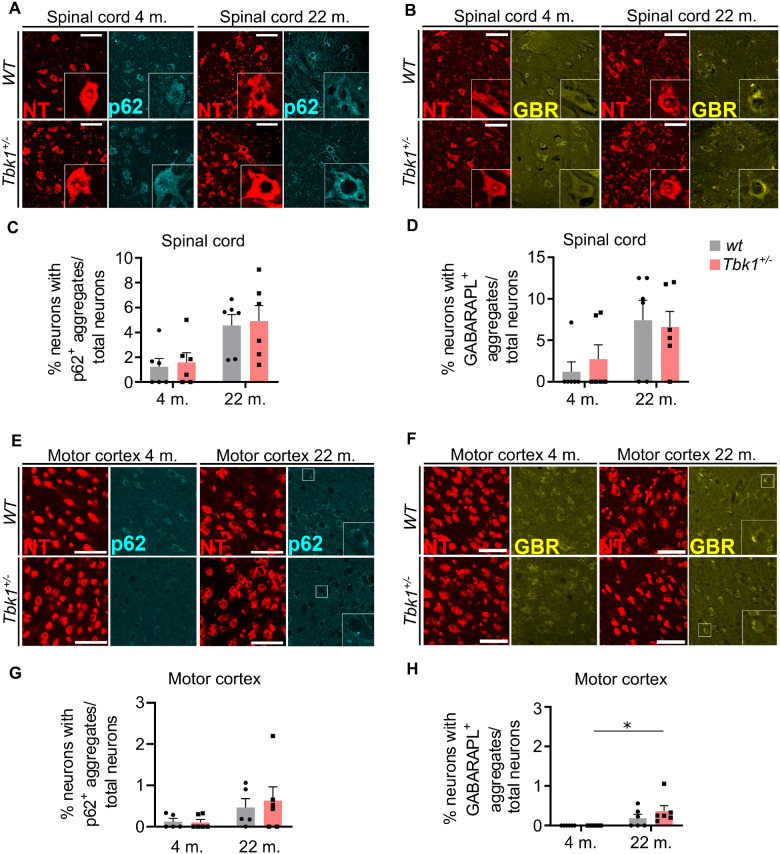
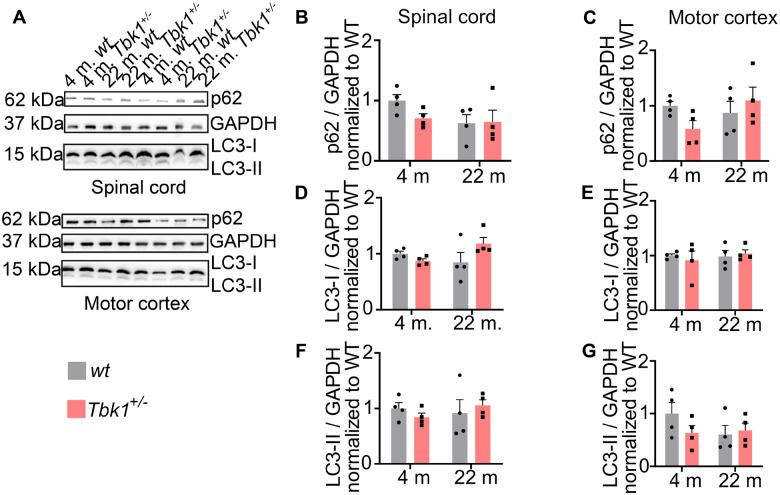
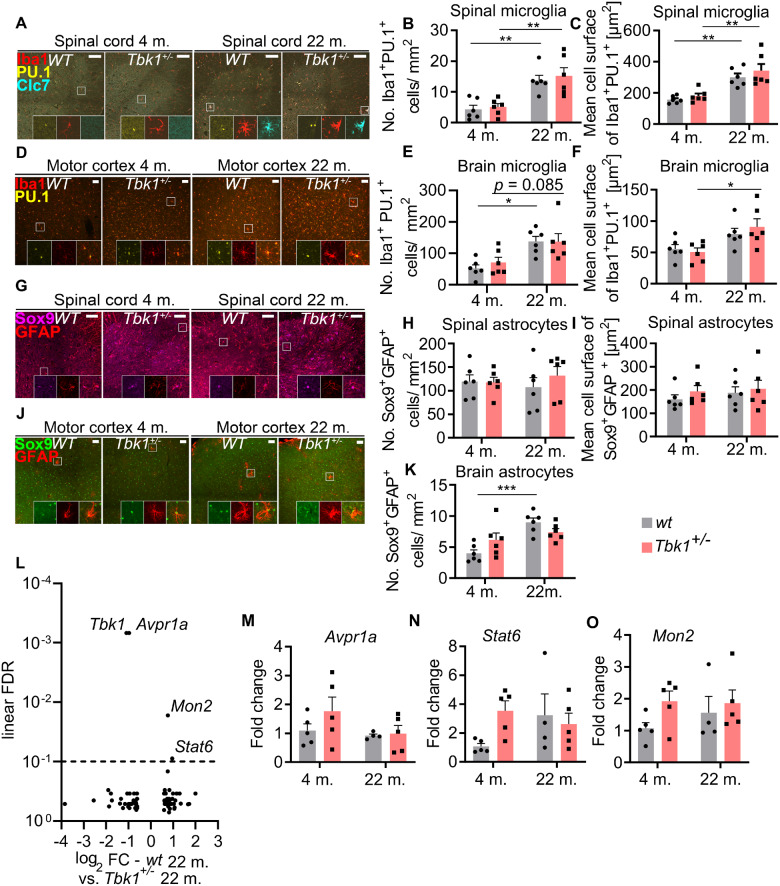
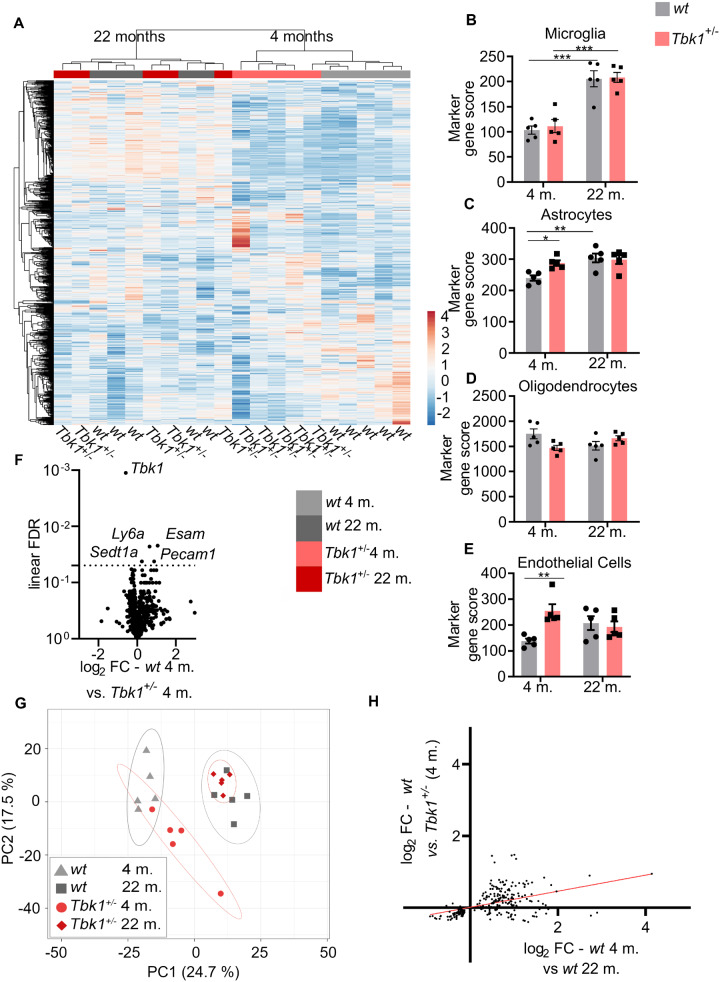
Loss-of-function mutations in TANK-binding kinase 1 cause genetic amyotrophic lateral sclerosis and frontotemporal dementia. Consistent with incomplete penetrance in humans, haploinsufficiency of TANK-binding kinase 1 did not cause motor symptoms in mice up to 7 months of age in a previous study. Ageing is the strongest risk factor for neurodegenerative diseases. Hypothesizing that age-dependent processes together with haploinsufficiency of TANK-binding kinase 1 could create a double hit situation that may trigger neurodegeneration, we examined mice with hemizygous deletion of Tbk1 (Tbk1 +/- mice) and wild-type siblings up to 22 months. Compared to 4-month old mice, aged, 22-month old mice showed glial activation, deposition of motoneuronal p62 aggregates, muscular denervation and profound transcriptomic alterations in a set of 800 immune-related genes upon ageing. However, we did not observe differences regarding these measures between aged Tbk1 +/- and wild-type siblings. High age did also not precipitate TAR DNA-binding protein 43 aggregation, neurodegeneration or a neurological phenotype in Tbk1+/ - mice. In young Tbk1+/ - mice, however, we found the CNS immune gene expression pattern shifted towards the age-dependent immune system dysregulation observed in old mice. Conclusively, ageing is not sufficient to precipitate an amyotrophic lateral sclerosis or frontotemporal dementia phenotype or spinal or cortical neurodegeneration in a model of Tbk1 haploinsufficiency. We hypothesize that the consequences of Tbk1 haploinsufficiency may be highly context-dependent and require a specific synergistic stress stimulus to be uncovered.

Keywords: ALS; TBK1; ageing; inflammation; neurogenetics.


Figures

Graphical Abstract
Graphical Abstract
Figure 1
Figure 1
Mice lacking one Tbk1 allele do not show morphological or behavioural changes. (A) Photographs showing a wt mouse and a Tbk1+/ sibling. (B) Weight development is similar in Tbk1+/ mice and wt siblings during the study period. (C) Tbk1+/ mice and wt siblings show a similar performance in the rotarod test during the study period. (D) Tbk1+/ and wt mice show similar lengths of stay in the centre of the open field arena. (E) Spontaneous alternation performance value does not differ between Tbk1+/ and wt mice in the Y-maze test. (F) The lengths of stay in the social areas in the three-chamber test is not different between Tbk1+/ and wt mice. (G) Tbk1+/ and wt mice do not display premature lethality during the study period. N = 18–20 males per genotype. Data in BF are shown as mean ± SEM and were analysed by paired t-test. Kaplan–Meier plot was analysed using the Log-rank (Mantel–Cox) test.
Figure 2
Figure 2
Hemizygous deletion of Tbk1 does not affect MN viability and muscular innervation. (A) Representative pictures of LSC anterior horn sections of both genotypes at 4 and 22 months stained for NT and choline acetyltransferase. Scale bar = 100 µm. (B) Quantification of LSC MNs shows similar numbers in Tbk1+/ and wt mice at either age. N = 6 mice. (C) Representative pictures of motor cortex sections of 4- and 22-month old Tbk1+/ and wt mice stained with NT. Scale bar = 50 µm. (D) Quantification of NT-positive neurons per mm2 in the V layer of the motor cortex shows similar numbers in Tbk1+/ when compared to aged matched wt mice. N = 6 mice. (E) Representative pictures of NMJs of the m. vastus medialis and m. quadriceps of 4- and 22-month old Tbk1+/ and wt mice stained for α-Bungarotoxin and synaptophysin. Scale bar = 50 µm. (F) Quantification of partially and fully denervated NMJs of the m. vastus medialis/m. quadriceps. N = 6–7 mice. (G) Representative pictures of NMJ of the m. lumbricalis of both genotypes at 4 and 22 months stained for α-Bungarotoxin and synaptophysin). White arrows indicate denervated NMJs. Scale bar = 50 µm. (H) Quantification of fully and partially denervated NMJs of the m. lumbricalis shows a genotype-independent age-related muscular denervation. N = 6–11 mice. (I) Representative pictures of transmission electron microscopy of the corticospinal tract in the LSC of 22-month old Tbk1+/ and wt mice. Scale bar = 20 µm. Lower higher magnification images show from left to right, examples of axons with myelin shield containing inner protrusion, detached axon, myelin out folding and an axon with degenerated myelin. Scale bar = 5 µm. (J) Graphs showing the correlation between the diameter and the g-ratio (axon diameter/total diameter of the axon plus the myelin sheath) per axon. N = 5 mice. (K) Quantification of different axon abnormalities. N = 4 mice. (L) Analysis of the axon diameters distribution shows no differences between 22-month old Tbk1+/ and wt mice. N = 5 mice. Data in B, D, F and H have been analysed by two-way ANOVA followed by Tukey’s multiple comparisons correction. **P < 0.01; *P < 0.05. Data in K and L have been analysed by t-test. All bar graphs are shown as mean ± SEM.
Figure 3
Figure 3
Autophagy in spinal cord and motor cortex is not influenced by hemizygous loss of Tbk1. (A) Representative pictures of LSC sections stained for NT and the autophagy marker p62. Scale bar = 100 µm. (B) Representative pictures of LSC sections stained for NT and the autophagy marker GABARAPL1. Scale bar = 100 µm. (C) and (D) Bar graphs showing the percentage of neurons containing p62 and GABARAPL1 positive inclusions in spinal cord of 4- and 22-month old mice from both genotypes. In both graphs a trend can be seen towards the aged cohorts. (E) and (F) Representative pictures of brain motor cortex sections stained for NT and p62 and NT and GABARAPL1. respectively. Scale bar = 50 µm. (G) and (H) Bar graphs showing the percentage of neurons containing p62 and GABARAPL1 positive inclusions in brain cortex of 4- and 22-month old mice from both genotypes. A genotype-independent age-related accumulation of GABARAPL1 inclusions is observed in the cortex of the transgene mice. All bar graphs are shown as mean ± SEM. All data analysed by two-way ANOVA followed by Tukey’s multiple comparisons. *P < 0.05. N = 5–6.
Figure 4
Figure 4
Autophagic markers stay unchanged upon ageing and Tbk1 reduction in vivo. (A) Representative western blot picture of spinal cord and brain cortex lysates. Protein expression levels of LC3-I/-II and p62 have been analysed; 30 µg of protein have been loaded per lane. GAPDH has been used as loading control. (B), (D) and (F) bar graphs showing the quantifications of p62 and LC3-I/-II protein expression in mice spinal cord lysate while (C), (E) and (G) show quantifications of the same protein expression in brain cortex lysates. All bar graphs are shown as mean ± SEM. All data analysed by two-way ANOVA followed by Tukey’s multiple comparisons. N = 4.
Figure 5
Figure 5
Tbk1 heterozygous loss does not influence age-related microglia activation in mice spinal cord and motor cortex. (A) Representative pictures of LSC sections stained for the microglia markers Iba1, Clec7a (Clc7) and PU.1. Enlargements show that only microglia of 22-month old mice are Clec7a-positive. Scale bar = 100 µm. (B) Quantification of Iba1+/PU.1+ cells in the grey matter of the LSC shows a genotype-independent increase in microglia numbers in 22-month old mice. (C) The mean cell size of Iba1+/PU.1+ microglial cells in the LSC differs between young and old but not between Tbk1+/ and wt mice. (D) Representative pictures of motor cortex sections stained for PU.1 and Iba1. Scale bar = 50 µm. (E) Age-dependent but genotype-independent increase in the numbers of Iba1+/PU.1+ microglia in the motor cortex. (F) The mean cell size of Iba1+/PU.1+ microglial cells in the motor cortex differs significantly only between young and old Tbk1+/ mice. (G) LSC sections stained for the astrocytic markers GFAP and Sox9. Enlargements show GFAP+/Sox9+ astrocytes. Scale bar = 100 µm. (H) Quantification of GFAP+/Sox9+ astrocytes in the LSC reveals similar numbers, independently of genotype and age. (I) The mean cell size of GFAP+/Sox9+ astrocytes in the LSC does not differ between Tbk1+/ and wt and young and old mice. (J) Representative pictures of motor cortex sections stained for GFAP and Sox9. Scale bar = 50 µm. (K) Quantification of GFAP+/Sox9+ astrocytes in motor cortex shows higher numbers only in aged wt mice compared to young ones. N = 6 for all analyses. (L) Volcano plot of RNA sequencing analysis of laser micro-dissected LSC MNs from wt and Tbk1+/ mice at the age of 22 months. Horizontal line indicates threshold for FDR (0.1). After FDR correction for multiple testing only four genes remain significantly altered (including Tbk1). (M)–(O) qPCR results of mRNA analysis from whole LSC lysates for validation of Avpr1a, Stat6 and Mon2 levels. N = 5. All bar graphs are shown as mean ± SEM. All data have been analysed by two-way ANOVA followed by Tukey’s multiple comparisons. *P < 0.05; **P < 0.01;***P < 0.001.
Figure 6
Figure 6
Haploinsufficiency of TBK1 shifts the spinal inflammatory transcriptome towards ageing in young mice. (A) Unbiased hierarchical cluster analysis (average linkage) on all 800 genes of the neuroinflammation panel in the spinal cord of young and aged wt and Tbk1+/ mice. Cluster analysis completely separates young from old mice and wt from Tbk1+/ mice at the age of 4 months. (B) The microglia-specific gene score shows an age-dependent increase that is independent of Tbk1. (C) The astrocyte-specific gene score is increased in Tbk1+/ mice compared to wt siblings at 4 but not at 22 months. The astroglia gene score is age-dependently increased in wt mice. (D) The oligodendrocyte-specific gene score is not affected by genotype or age. (E) The endothelial-specific gene score is increased in Tbk1+/ mice compared to wt siblings at 4 but not at 22 months. (F) Volcano plot showing 5 (including Tbk1) out of 800 genes after FDR correction for multiple testing differently regulated when comparing both genotypes at age 4 months. Horizontal line indicates threshold for FDR (0.05). (G) A principal component analysis of the same 800 gene panel shows a shift of the transcriptomic inflammatory profile of young Tbk1+/ mice towards that of old ones. (H) Positive correlation of age-associated changes with changes caused by Tbk1 haploinsufficiency in young mice, based on the 219 genes significantly altered by ageing. (B)–(E) Graphs have been analysed by two-way ANOVA followed by Tukey’s multiple comparisons. All bar graphs are shown as mean ± SEM. *P < 0.05; **P < 0.01;***P < 0.001. N = 5.

Similar articles

Cited by

References

    1. Ahmad L, Zhang SY, Casanova JL, Sancho-Shimizu V. Human TBK1: a gatekeeper of neuroinflammation [Review]. Trends Mol Med 2016; 22: 511–27. - PMC - PubMed
    1. Bonnard M, Mirtsos C, Suzuki S, et al.Deficiency of T2K leads to apoptotic liver degeneration and impaired NF-kappaB-dependent gene transcription. EMBO J 2000; 19: 4976–85. - PMC - PubMed
    1. Brenner D, Sieverding K, Bruno C, Lüningschrör P, Buck E, Mungwa S, et al.Heterozygous Tbk1 loss has opposing effects in early and late stages of ALS in mice. J Exp Med 2019; 216: 267–78. - PMC - PubMed
    1. Catanese A, Olde Heuvel F, Mulaw M, Demestre M, Higelin J, Barbi G, et al.Retinoic acid worsens ATG10-dependent autophagy impairment in TBK1-mutant hiPSC-derived motoneurons through SQSTM1/p62 accumulation. Autophagy 2019; 15: 1719–37. - PMC - PubMed
    1. Chakrama FZ, Seguin-Py S, Le Grand JN, Fraichard A, Delage-Mourroux R, Despouy G, et al.GABARAPL1 (GEC1) associates with autophagic vesicles. Autophagy 2010; 6: 495–505. - PubMed

LinkOut - more resources