. 2021 Apr 6;15(4):617-630.
doi: 10.1093/ecco-jcc/jjaa199.

Tyrosine Kinase 2 Signalling Drives Pathogenic T cells in Colitis

Affiliations

Tyrosine Kinase 2 Signalling Drives Pathogenic T cells in Colitis

Leonie C S De Vries et al. J Crohns Colitis. .

Abstract

Background and aims: Tyrosine kinase 2 [TYK2] is required for the signalling of key cytokines in the pathogenesis of inflammatory bowel disease [IBD]. We assessed the efficacy of a novel selective TYK2 inhibitor [TYK2i] in experimental colitis, using pharmacological and genetic tools.

Methods: At onset of T cell transfer colitis, RAG1-/- mice received vehicle or TYK2i daily by oral gavage. T cells lacking TYK2 kinase activity [TYK2KE] were used to confirm selectivity of the inhibitor. To this end, RAG1-/- or RAG1-/-TYK2KE animals were transferred with either wild type [WT] or TYK2KE-CD45RBhigh colitogenic T cells. Loss of body weight, endoscopic disease, the disease activity index [DAI], and histopathology scores were recorded. Tissues were analysed ex vivo for lymphocyte populations by flow cytometry. The impact of TYK2 inhibition on human DC-T cell interactions were studied using autologous Revaxis specific T cell assays.

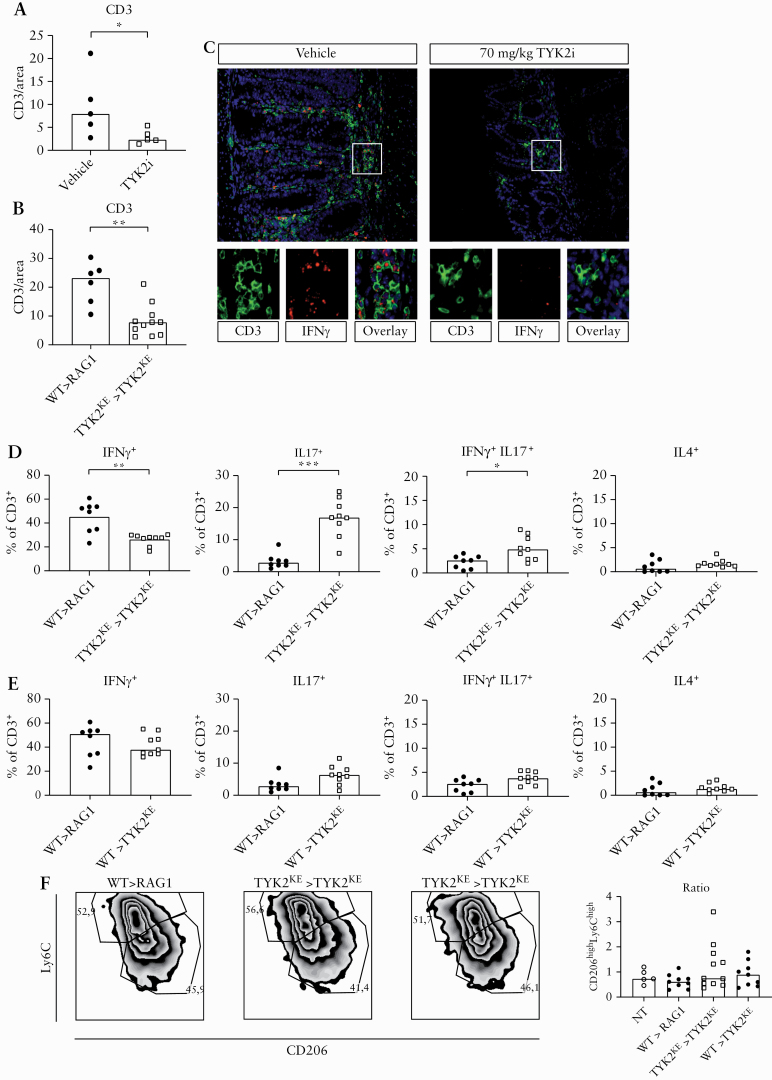
Results: TYK2i [70 mg/kg] prevented weight loss and limited endoscopic activity during T cell transfer colitis. TYK2i [70 mg/kg] decreased DAI. Whereas transfer of WT T cells into RAG-/-TYK2KE hosts induced colitis, TYK2KE T cells transferred into RAG1-/-TYK2KErecipients failed to do so. Ex vivo analysis showed a decrease in colon tissue Th1 cells and an increase in Th17 cells upon transfer of TYK2KE-CD45RBhigh cells. In human antigen-triggered T cells, TYK2i displayed reduced Th1 differentiation, similar to murine Th1 cells.

Conclusions: Oral administration of TYK2i, as well as transfer of T cells lacking TYK2 activity, reduced human Th1 differentiation and ameliorated the course of murine T cell transfer colitis. We conclude that TYK2 is a promising drug target for the treatment of IBD.

Keywords: IBD; Janus kinase inhibitor; Tyrosine kinase 2 inhibitor; experimental colitis.


Figures

Figure 1.
Figure 1.
Oral tyrosine kinase 2 inhibitor reduces disease in T cell transfer colitis. A] Weight curves, expressed as percentage of initial body weight. Data points are expressed as mean with standard error of the mean [SEM]. Animals received daily oral gavage from Day 38 until sacrifice [Day 63] with either vehicle [veh] or 10, 30, or 70 mg/kg of the tyrosine kinase 2 inhibitor [TYK2i]. A non-transferred control group was included [NT]. Symbols indicate statistical significance of NT versus veh and veh versus 70 mg/kg groups, respectively. B] The disease activity index [DAI] was scored at sacrifice [Day 63]. C] Splenic weight at sacrifice expressed in milligrams. D] Colon weight-length ratio at sacrifice expressed as mg/cm. E] The endoscopy score at day of sacrifice. F] Representative endoscopy image comparing NT, vehicle, and TYK2i-treated animals. G] The histology score at sacrifice. H] Representative picture of a haematoxylin and eosin [HE] staining of the distal colon comparing NT, vehicle, and TYK2i-treated animals; 100 × magnification. All bar graphs B‐G: data are expressed as median with individual data points representing individual animals. Statistical analyses A‐G: Mann‐Whitney U test [NT vs vehicle] and Kruskal‐Wallis test followed by post hoc Dunn’s test [veh vs 10, 30, or 70 mg/kg]; *p ≤0.05; **p ≤0.01; ***p ≤0.001.
Figure 2.
Figure 2.
Tyrosine kinase 2 [TYK2] kinase activation drives T cell transfer induced colitis. A] Weight curves, expressed as percentage of initial body weight. Data points are expressed as mean with standard error of the mean [SEM]. RAG1-/- animals were transferred with wild type [WT] T cells [WT >RAG1]; RAG1-/-TYK2KE animals were transferred with T cells lacking TYK2 kinase activity [TYK2KE>TYK2KE]. A non-transferred control group was included [NT]. B] The disease activity index [DAI] was scored at sacrifice [Day 53]. C] Splenic weight at sacrifice expressed in milligrams. D] Colon weight-length ratio at sacrifice expressed as mg/cm. E] The endoscopy score at day of sacrifice. F. Representative endoscopy image comparing NT-, WT-, and TYK2KE-transferred animals. G] The histology score at sacrifice. H] Representative picture of a haematoxylin and eosin [HE] staining of the distal colon comparing NT-, WT-, and TYK2KE-transferred animals; 100 × magnification. All bar graphs, B‐G: data are expressed as median with individual data points. Statistical analyses A‐G: Mann‐Whitney U test; **p ≤0.01; ***p ≤0.001; ****p ≤0.0001.
Figure 3.
Figure 3.
The protective effect of TYK2 kinase inhibition is mediated through T cells. A] Weight curves, expressed as percentage of initial bodyweight. Data points are expressed as mean with standard error of the mean [SEM]. [Left] RAG1-/- animals were transferred with either wild type [WT] T cells [WT > ]RAG1] or with T cells lacking tyrosine kinase 2 [TYK2] activity [TYK2KE>RAG1]. [Right] RAG1-/- animals or RAG1-/- back-crossed with TYK2KE animals [RAG1-/-TYK2KE animals] transferred with WT T cells [respectively WT >RAG1 or WT >TYK2KE]. A non-transferred control group was included [NT] in both experiments. B] The disease activity index [DAI] was scored at sacrifice [Day 56 T cell; Day 53 non-T cell] C] Splenic weight at sacrifice expressed in milligrams. D] Colon weight-length ratio at sacrifice expressed in mg/per cm. E] The endoscopy score. F] Representative endoscopy image comparing NT, RAG1, and TYK2KE animals after transfer of WT T cells. G] The histology score at sacrifice. H] Representative picture of a haematoxylin and eosin [HE] staining of the distal colon comparing NT, RAG1, and TYK2KE animals after transfer of WT T cells; 100 × magnification. All bar graphs B‐G: data are expressed as median with individual data points. Statistical analyses A‐G: Mann‐Whitney U test; *p ≤0.1; **p ≤0.01; ***p ≤0.001; ****p ≤0.0001.
Figure 4.
Figure 4.
TYK2 inhibition interferes with T cell skewing. A] CD3 expression in colon of RAG1-/- animals transferred with wild type [WT] T cells, treated with vehicle or tyrosine kinase 2 inhibitor [TYK2i]. B] CD3 expression in colon of RAG1-/- animals transferred with WT T cells [WT >RAG1] as compared with RAG1-/-TYK2KE recipient animals transferred with TYK2KE T cells [TYK2KE>TYK2KE]. C] Immunofluorescent image of interferon [IFN]γ +CD3+ T cells in colon paraffin sections using RNA Scope in animals treated with vehicle or TYK2i 70 mg/kg. CD3+ expression is indicated in green, IFNγ mRNA is indicated in red. D] Percentage of IFNγ +-, IL17+-, IFNγ +/IL17+-, and IL4+ within the gated CD45+/CD3+ T cell population as measured by flow cytometry obtained from whole colon cell suspension in TYK2 animals transferred as in B, as measured by flow cytometry. E] Experiment performed in in D, in RAG1-/- animals transferred with WT T cells [WT >RAG1] as compared with RAG1-/-TYK2KE recipient animals transferred with WT T cells [WT >TYK2KE]. F] Colonic myeloid cells were gated as DAPICD45+Ly6G-CD11b+ cells and subdivided into regulatory [CD206hiLy6Clo] M2-like macrophages and inflammatory [CD206loLy6Chi] M1-like macrophages. Images depict representative animals, graph depicts the ratio between both subsets for all mice. All bar graphs B‐E: data are expressed as median with individual data points. Statistical analyses B‐E: Mann‐Whitney U test. Statistical analysis F: Kruskall‐Wallis test; *p ≤0.05; **p ≤0.01; ***p ≤0.001; ****p ≤0.0001.
Figure 5.
Figure 5.
TYK2 inhibition inhibits the differentiation of human Th1 cells. A] Relative mRNA expression normalised to vehicle of T helper [Th] transcription factors Th1 [TBX21], Th2 [GATA3], Th17 [RORC], and Treg [FoxP3], in human lymphocytes incubated with vehicle [DMSO] or the TYK2i [2000 nM] for 24 h co-cultured with dendritic cells [DCs] primed with LPS/Revaxis for 6 or 20 h. B] Protein expression normalised to vehicle of interferon [IFNγ] [Th1], IL17 [Th17], IL13 [Th2], and IL10 [Treg] excreted by human lymphocytes incubated with vehicle or TYK2i and co-cultured with LPS/Revaxis-primed DCs for 24 or 48 h. Data are expressed as mean with standard error of the mean [SEM], each bar consists of three individual donors. C] Patient biopsy material [three UC donors, three CD donors] was incubated with TYK2i [2000 nM] or vehicle [veh; DMSO] for 24 , and protein production of TNFα, IFNγ, IL17, and IL6 was measured in the supernatant. Data are expressed as mean of three triplicates per donor. Statistical analyses A‐C: t test [comparisons: vehicle vs TYK2i-treated T cells]; *p ≤0.05; ***p ≤0.001.

References

    1. Baumgart DC, Sandborn WJ. Crohn’s disease. Lancet 2012;380:1590–605. - PubMed
    1. Ordas I, Eckmann L, Talamini M, et al. . Ulcerative colitis. Lancet 2012;380:1606–19. - PubMed
    1. Feagan BG, Rutgeerts P, Sands BE, et al. . Vedolizumab as induction and maintenance therapy for ulcerative colitis. N Engl J Med 2013;369:699–710. - PubMed
    1. Feagan BG, Sandborn WJ, Gasink C, et al. . Ustekinumab as induction and maintenance therapy for Crohn’s disease. N Engl J Med 2016;375:1946–60. - PubMed
    1. Sandborn WJ, Su C, Panes J. Tofacitinib as induction and maintenance therapy for ulcerative colitis. N Engl J Med 2017;377:496–7. - PubMed