

Ewing sarcoma protein promotes dissociation of poly(ADP-ribose) polymerase 1 from chromatin
- PMID: 33006225
- PMCID: PMC7645264
- DOI: 10.15252/embr.201948676
Ewing sarcoma protein promotes dissociation of poly(ADP-ribose) polymerase 1 from chromatin
Abstract
Poly(ADP-ribose) polymerase 1 (PARP1) facilitates DNA damage response (DDR). While the Ewing's sarcoma breakpoint region 1 (EWS) protein fused to FLI1 triggers sarcoma formation, the physiological function of EWS is largely unknown. Here, we investigate the physiological role of EWS in regulating PARP1. We show that EWS is required for PARP1 dissociation from damaged DNA. Abnormal PARP1 accumulation caused by EWS inactivation leads to excessive Poly(ADP-Ribosy)lation (PARylation) and triggers cell death in both in vitro and in vivo models. Consistent with previous work, the arginine-glycine-glycine (RGG) domain of EWS is essential for PAR chain interaction and PARP1 dissociation from damaged DNA. Ews and Parp1 double mutant mice do not show improved survival, but supplementation with nicotinamide mononucleotides extends Ews-mutant pups' survival, which might be due to compensatory activation of other PARP proteins. Consistently, PARP1 accumulates on chromatin in Ewing's sarcoma cells expressing an EWS fusion protein that cannot interact with PARP1, and tissues derived from Ewing's sarcoma patients show increased PARylation. Taken together, our data reveal that EWS is important for removing PARP1 from damaged chromatin.
Keywords: EWS; PAR; DNA damage response; PARP-1; PARylation.
© 2020 The Authors.
Conflict of interest statement
The authors declare that they have no conflict of interest.
Figures
- A
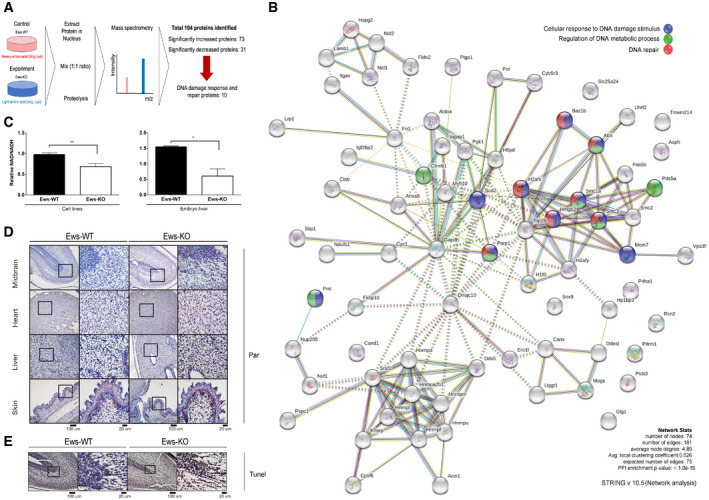
Schematic of SILAC‐mass spectrometry. Wild‐type (WT) and Ews −/− mBA cells were labeled by heavy or light amino acid, respectively. Differently labeled proteins were analyzed by mass spectrometry.
- B
Network analysis of mass spectrometry results.
- C
NAD+/NADH ratio was measured in mBA cell lines and 17.5 days embryo liver. Data represented as mean ± SEMs, and obtained from three different cell line and embryo liver. Significance determined by Student's t‐test, two‐tailed, *P < 0.05, **P < 0.01.
- D
Immunostaining of 17.5 days embryo tissues (mid‐brain, heart, liver, and skin) with anti‐PAR antibody. Insets show higher magnification. Scale bar indicates 100 μm and 20 μm.
- E
Wild‐type (WT) and Ews −/− embryos mid‐brain at E17.5 days were subjected to TUNEL assay. Scale bar indicates 100 μm and 20 μm.
- A
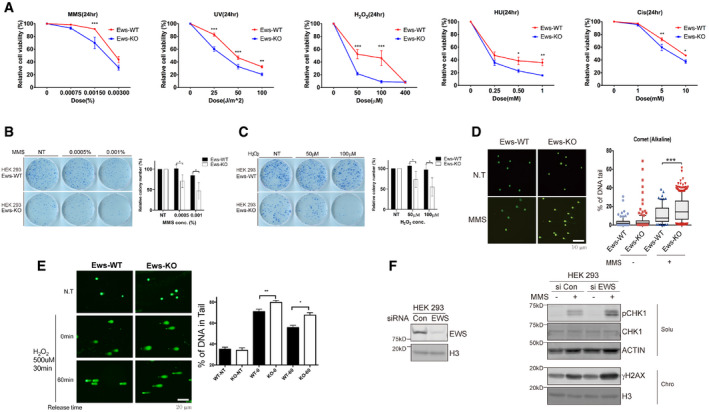
Relative cell viability was measured in wild‐type (WT) and Ews‐KO mBA cells after treatment with various DNA‐damaging agents. MMS: Methyl methane sulfonate, H2O2: Hydrogen peroxide, Cis: Cisplatin, UV: Ultraviolet, and HU: Hydroxyurea. Error bars represent as mean ± SEMs, and technical repeats (n = 3). Significance determined by two‐way ANOVA, *P < 0.05, **P < 0.01, ***P < 0.001.
- B, C
After 10 days of low dose MMS (B) and H2O2 (C) treatment, survived colony were measured using clonogenic assay. Data represented as mean ± SEMs, n > 3. Significance determined by Student's t‐test, two‐tailed, *P < 0.05.
- D
DNA breaks in wild‐type (Ews‐WT) and Ews‐KO mBA cells were measured using Alkaline Comet assay after MMS treatment (0.0015%, 24 h). Error bars represent as mean ± SEMs, n > 50. Significance determined by ***P < 0.001.
- E
Alkaline Comet assay were conducted in Ews‐WT and Ews‐KO mBA cells after treatment and release of H2O2. Error bars represent ± SEMs, n > 50. Significance determined by two‐way ANOVA, *P < 0.05, **P < 0.01.
- F
Upon inactivation of EWS in HEK‐293 cells, expression of DNA damage markers (pCHK1 and γH2AX) were measured using Western blotting after MMS (0.02%, 1 h) treatment.
- A, B
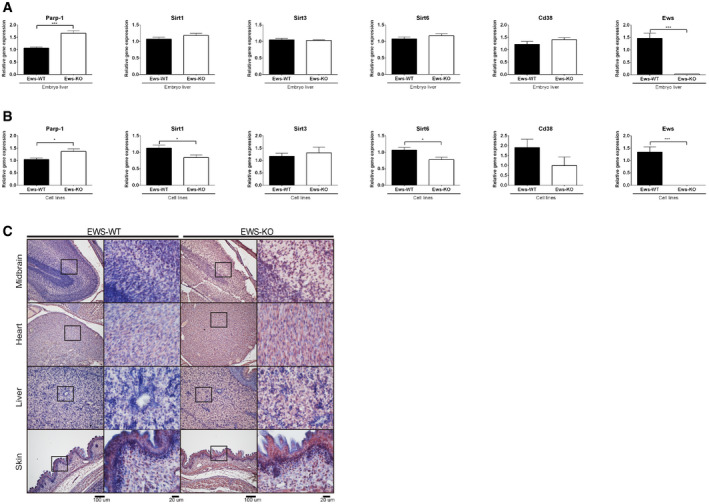
Quantitative real‐time PCR was carried out to investigate the expression level of NAD+ salvage pathway genes using E17.5 day embryos liver (A) and cell lines (B). Data represented as mean ± SEMs, and obtained from three different cell line and embryo liver. Significance determined by Student's t‐test, two‐tailed, *P < 0.05, ***P < 0.001.
- C
Immunostaining of 17.5 days embryo tissues (mid‐brain, heart, liver, and skin) with anti‐PARP1‐antibody. Insert shows higher magnification. Scale bar indicates 200 μm (left).
- A
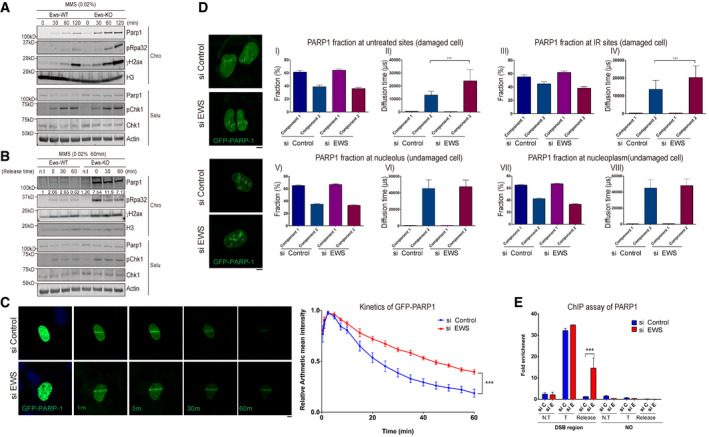
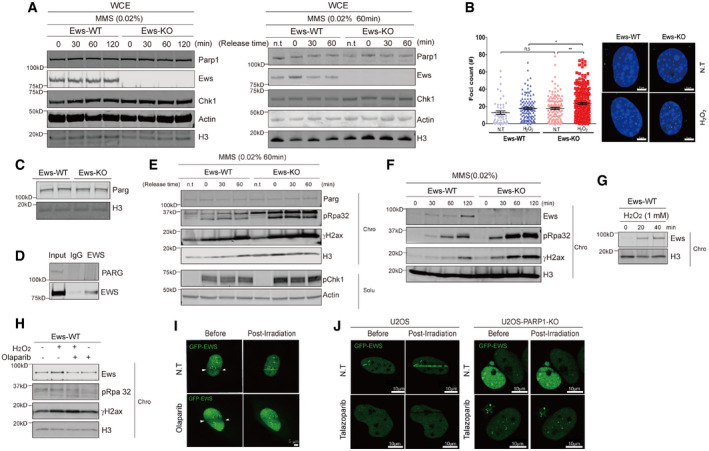
Western blot analysis of Parp1 and DNA damage markers in wild‐type (WT) and Ews −/− mBA cells. Cells were treated with MMS (0.02%) in a time dependent manner. Proteins were fractionated into two groups, chromatin‐bound (Chro) proteins and soluble (Solu) proteins.
- B
After treatment with MMS (0.02%, 1 h), the media was replaced to release the DNA damage. The proteins were fractionated and the specific protein kinetics at chromatin were analyzed by Western blot.
- C
GFP‐PARP1 U2OS cells were transfected with siControl and siEWS. Local DNA damage was induced by micro‐irradiation using a 405 nm laser. Data represented as mean ± SEMs and more than six cells were analyzed from six independent experiments. The statistical significance determined by one‐way ANOVA, ***P < 0.001. Scale bar indicates 5 μm.
- D
Fluorescence correlation spectroscopy (FCS) was measured after 15 min later following micro‐irradiation (Upper) or under normal condition in GFP‐PARP1 U2OS cells with either siControl or siEWS. Data represented as mean ± SEMs, more than 50 cells were analyzed, and significance determined by one‐way ANOVA, ***P < 0.001. Scale bar indicate 5 μm.
- E
AsiSI endonuclease‐integrated U2OS cells were transfected with siControl and siEWS. Cells were incubated with doxycycline for 4 h to induce DSBs. With or without changing the Dox‐added media to fresh media for 2 h (for release samples), the amount of chromatin‐associated PARP1 was measured using ChIP assay. N.T: Non‐treat, T: AsiSI treat, Release: Damage released samples. Data represented as mean ± SEMs, and technical repeats (n = 3), significance determined by two‐way ANOVA, ***P < 0.001.
- A
Whole cell extract of wild‐type and Ews‐KO cells following MMS treatment and releasement were subjected to Western blotting.
- B, C
(B) Immunofluorescence with anti‐PARP1 antibody in wild‐type and Ews‐KO cells following H2O2 treatment. Scale bar indicate 5 μm. n > 150 (C) PARG expression was measured by Western blot in wild‐type and Ews‐KO mBA cells.
- D
Endogenous interaction between EWS and PARG were analyzed by co‐immunoprecipitation followed by Western blot analysis with anti‐EWS antibody.
- E
After release from MMS treatment, proteins in cells were fractionated into chromatin‐bound and soluble forms to measure PARG kinetics in wild‐type and Ews‐KO mBA cells.
- F, G
Chromatin‐bound levels of EWS were measured after treatment of MMS (F) or H2O2 (G).
- H
Wild‐type cells were treated with 1 mM H2O2 for 20 min with or without PARPi (5 μM Olaparib for 7 h). The kinetics of chromatin‐bound EWS was analyzed by Western blot.
- I
Localized specific DNA damage was induced in GFP‐EWS cell lines with or without Olaparib using micro‐irradiation. Scale bar represents 5 μm.
- J
DNA damage was induced by micro‐irradiation in U2OS and U2OS‐PARP1‐KO cells with or without Talazoparib (5 μM, 24 h). Scale bar represents 10 μm. N > 10.
- A
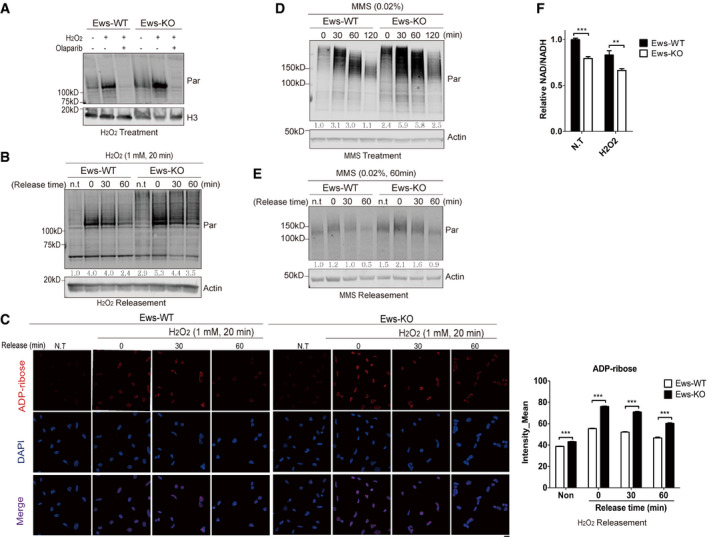
Total levels of PAR in whole cell lysate were measured using Western blot analysis. Wild‐type (WT) and Ews −/− mBA cells were treated with H2O2, (1 mM, 20 min) with or without Olaparib (5 μM, 7 h).
- B, C
(B) The kinetics of PAR accumulation was analyzed by Western blotting. WT and Ews −/− cells were treated with H2O2 (1 mM, 20 min), followed by incubation in fresh media for the indicated times to allow release of DNA damage. (C) Immunohistochemistry detection of PAR by ADP‐ribose antibody in WT and Ews −/− cells after H2O2 treatment (1 mM, 20 min) and recovery from DNA damage. Right graph displays mean of intensities measured from 500 cells. Data represented as mean ± SEMs, significance determined by one‐way ANOVA, ***P < 0.001. Scale bar indicate 20 μm.
- D, E
Whole cell level of PAR was measured in WT and Ews −/− mBA cells upon treatment with (D) MMS (0.02%, 60 min) (E) with or without recovery from DNA damage.
- F
NAD+/NADH ratio was measured in mBA cell lines following treatment of H2O2 (1 mM, 10 min). Data represented as mean ± SEMs, and technical repeats (n = 3). Significance determined by Student's t‐test, two‐tailed, **P < 0.01, ***P < 0.001.
- A
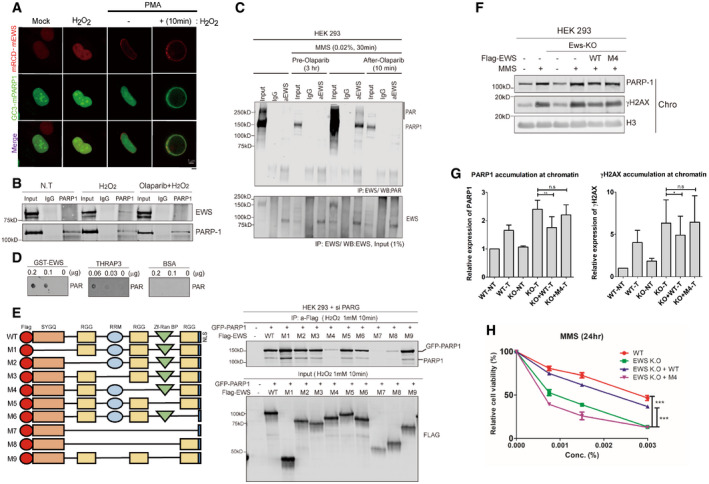
PARP1 and EWS interaction was visualized in cells using the CUPID system. After transfection of mRCD‐EWS and GC3‐PARP1 (EGFP‐PARP1) plasmid, the cells were treated with either H2O2 (1 mM, 10 min) or PMA. Scale bar indicates 5 μm.
- B
Endogenous interaction between EWS and PARP1 was measured using immunoprecipitation Western blot analysis. Cells were treated with H2O2 (1 mM, 10 min) with or without Olaparib (5 μM, 7 h).
- C
MMS‐treated cells, with or without Olaparib, were immunoprecipitated using an anti‐EWS antibody and immunoblotted by anti‐PAR antibody (upper). Pre‐Olaparib group was treated with Olaparib for 3 h before MMS treatment (0.02%, 30 min) and after‐Olaparib group treated Olaparib after 10 min following treatment of MMS. Lower blot indicates input of anti‐EWS antibody.
- D
In vitro PAR‐binding assay. THRAP3 binding to PAR was used as a positive control and BSA binding to PAR was used as a negative control.
- E
Schematic map of nine EWS mutants (left) and IP‐Western blot analysis (right). GFP‐PARP1 and siPARG were transfected into HEK‐293 cells with each EWS‐mutant plasmid. After H2O2 treatment, the cells were conducted to IP with anti‐Flag antibody.
- F
Western blot analysis of PARP1 accumulation on chromatin. EWS‐WT and M4 mutants were transfected into EWS‐depleted HEK‐293 cells. After treatment of MMS (0.02%, 1 h), the proteins were fractionated to either chromatin‐bound or soluble fraction.
- G, H
(G) Quantification of relative amount of PARP1 and γH2AX on chromatin, divided by chromatin H3, from three independent Western experiments is presented. Data represented as mean ± SEMs, were measured from 3 independent experiments. Significance determined by t‐test. *P < 0.05, **P < 0.01. n.s indicate non‐significance, (H) WT and Ews −/− cells were transfected with EWS‐WT and –M4 mutant and cell viability was measured 24 h after MMS treatment (indicated concentration). Error bars represent as mean ± SEMs, and technical repeats (n = 3). Significance determined by two‐way ANOVA, **P < 0.01. n.s indicate non‐significance.
- A
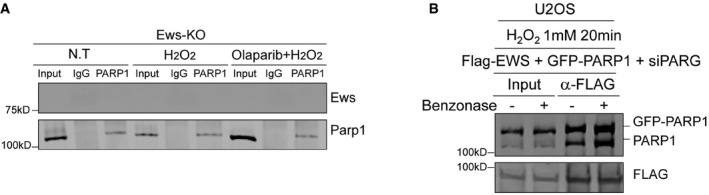
Interaction between EWS and PARP1 was analyzed by Immunoprecipitation assay in Ews‐KO cells. Cells were treated with H2O2 (1 mM, 10 min) with or without Olaparib (5 μM, 7 h).
- B
With or without Benzonase‐treated cells were immune‐precipitated by anti‐FLAG antibody and immunoblotted by anti‐PARP1 and FLAG antibody.
- A
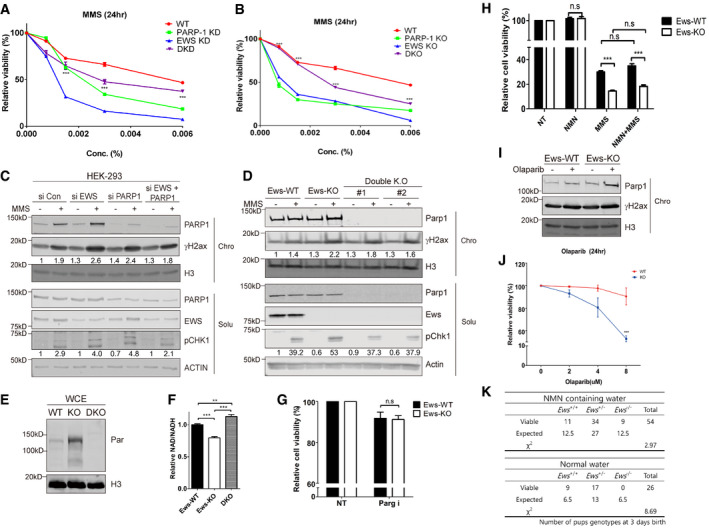
Relative cell viability of cells transfected with siCon (WT), siEWS (EWS KD), PARP1 (PARP‐1 KD), and double siRNA (DKD) after MMS treatment. Error bars represent as mean ± SEMs, and technical repeats (n = 3). Significance determined by two‐way ANOVA, ***P < 0.001. Analysis (***) indicates differences between DKD with EWS KD.
- B
Additional Parp1 knockout in Ews knockout cells (DKO) were subjected to viability test after MMS treatment. Error bars represent as mean ± SEMs, and technical repeats (n = 3). Significance determined by two‐way ANOVA, ***P < 0.001. *** indicated differences between DKO with EWS‐KO.
- C
After transfection of siCon, siEWS, PARP1, and double siRNA, the effect of co‐depletion of PARP1 and EWS on the γH2AX and phosphorylated CHK1 upon MMS treatment was analyzed by Western blot.
- D
After treatment of MMS, the effect of additional Parp1 knockout in Ews knockout cells (Double KO) to the γH2AX and phosphorylated CHK1 were analyzed using Western blot.
- E
Whole cell expression of PAR in mBA (WT: Ews‐WT, KO: Ews‐KO, DKO: double KO).
- F
Relative NAD+/NADH ratios were measured in WT, Ews −/− and DKO cells. Error bars represent as mean ± SEMs, and technical repeats (n = 3). Significance determined by two‐way ANOVA, ***P < 0.001.
- G
PARGi (5 μM, 24 h) treated WT and Ews −/− cells were subjected to cellular viability assay. Error bars represent as mean ± SEMs, and technical repeats (n = 3). Significance determined by two‐way ANOVA.
- H
Relative cellular viability was measured after NMN treatment, with or without MMS pretreatment, in WT and Ews −/− cells. Error bars represent as mean ± SEMs, and technical repeats (n = 3). Significance determined by two‐way ANOVA, ***P < 0.001.
- I
Chromatin‐bound PARP1 was quantified by Western blot in WT and Ews −/− cells treated with Olaparib (5 μM, 24 h) treatment.
- J
Relative viability was measured in WT and Ews −/− cells upon treatment of Olaparib for 24 h. Error bars represent as mean ± SEMs, and technical repeats (n = 3). Significance determined by two‐way ANOVA, ***P < 0.001.
- K
Table of Ews −/− pups survival number in control (normal water) or NMN supplements (NMN containing water) groups 3 days after birth. Statistics (χ2) were determined by chi‐square test.
- A, B
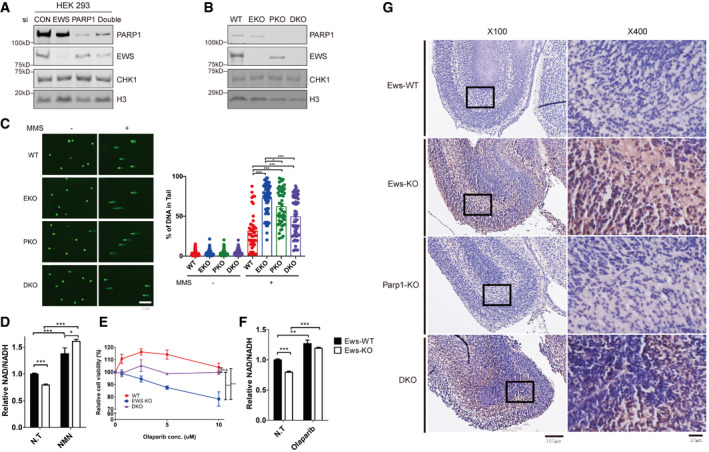
Whole cell expressions of PARP1, EWS and CHK1 were measured in Figs 5A (A) and EV5C (B) cells.
- C
DNA breaks were measured using the Alkaline Comet assay in WT, EKO, PKO, and DKO cells treated with MMS (0.0015%, 24 h). WT: Wild‐type, EKO: Ews‐KO, PKO: Parp1‐KO and DKO: double KO. Error bars represent ± SEMs, n > 35. Significance determined by two‐way ANOVA, *P < 0.05, **P < 0.01, ***P < 0.001.
- D
Relative NAD+/NADH ratios were measured in wild‐type (Ews‐WT) and Ews‐KO cells following treatment of NMN (20 μM, 24 h). Error bars represent as mean ± SEMs, and technical repeats (n = 3). Significance determined by two‐way ANOVA, *P < 0.05, **P < 0.01, ***P < 0.001.
- E
Relative cell viability was measured in HEK293 WT, EWS‐KO and EWS‐PARP1 KO (DKO) cell lines upon Olaparib treatment. Error bars represent as mean ± SEMs, and technical repeats (n = 3). Significance determined by two‐way ANOVA, *P < 0.05, **P < 0.01, ***P < 0.001.
- F
NAD+/NADH ratios were measured in wild‐type (Ews‐WT) and Ews‐KO cells after treatment of Olaparib (5 μM 24 h). Error bars represent as mean ± SEMs, and technical repeats (n = 3). Significance determined by two‐way ANOVA, *P < 0.05, **P < 0.01, ***P < 0.001.
- G
Cell death was observed in wild‐type (Ews‐WT), Ews‐KO, Parp1‐KO, and DKO embryos mid‐brain at E17.5 days using the TUNEL assay. ×100 and ×400 image scale bar represents 100 μm and 20 μm, respectively.
- A
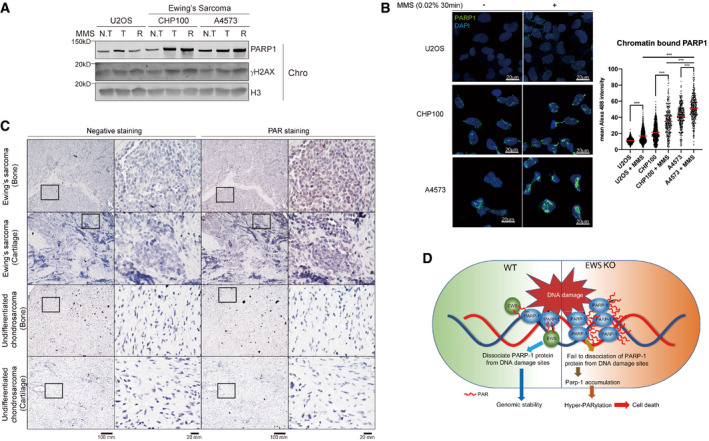
Western blot analysis of PARP1 in chromatin. Two Ewing Sarcoma cells (CHP100 and A4573) were treated with MMS (0.02%, 1 h) with or without release (1 h) from MMS (N.T: non‐treat, T: treat, R: release sample).
- B
U2OS and two Ewing Sarcoma cells were treated MMS (0.02%, 30 min) and subjected to immunofluorescence by PARP1 antibody after chromatin‐bound fraction. Scale bar indicates 20 μm (left). Red line indicates mean and more than 300 cells were analyzed. Significance determined by two‐way ANOVA, ***P < 0.001.
- C
Human Ewing Sarcoma histology samples were analyzed by immunohistochemistry using PAR antibody. Scale bar represents 100 mm.
- D
Model of EWS role in genomic integrity.
References
-
- Boro A, Pretre K, Rechfeld F, Thalhammer V, Oesch S, Wachtel M, Schafer BW, Niggli FK (2012) Small‐molecule screen identifies modulators of EWS/FLI1 target gene expression and cell survival in Ewing's sarcoma. Int J Cancer 131: 2153–2164 - PubMed
-
- Chong PA, Forman‐Kay JD (2016) Liquid‐liquid phase separation in cellular signaling systems. Curr Opin Struct Biol 41: 180–186 - PubMed
Publication types
MeSH terms
Substances
Grants and funding
LinkOut - more resources
Full Text Sources
Molecular Biology Databases
Miscellaneous
