. 2020 Oct 2:9:e58997.
doi: 10.7554/eLife.58997.

Pathway-specific dysregulation of striatal excitatory synapses by LRRK2 mutations

Affiliations

Pathway-specific dysregulation of striatal excitatory synapses by LRRK2 mutations

Chuyu Chen et al. Elife. .

Abstract

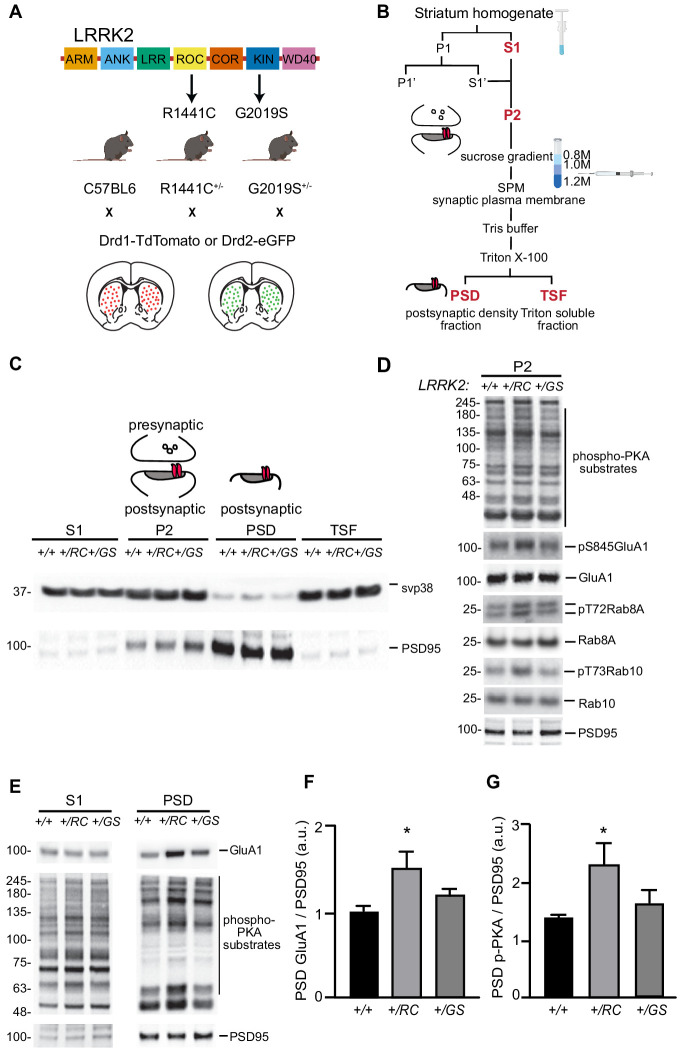
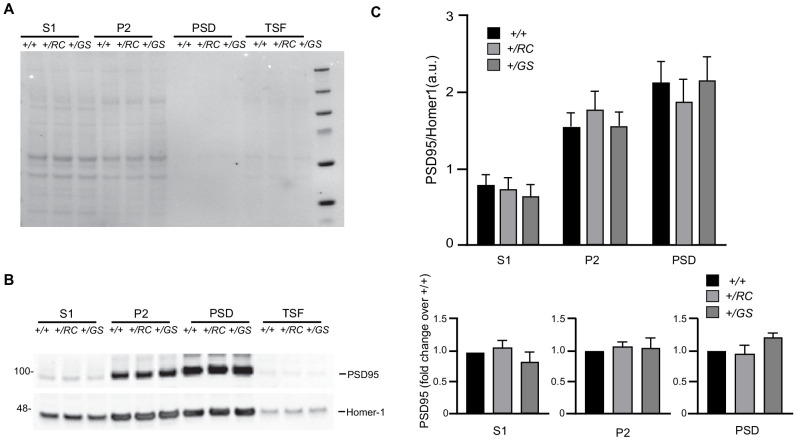
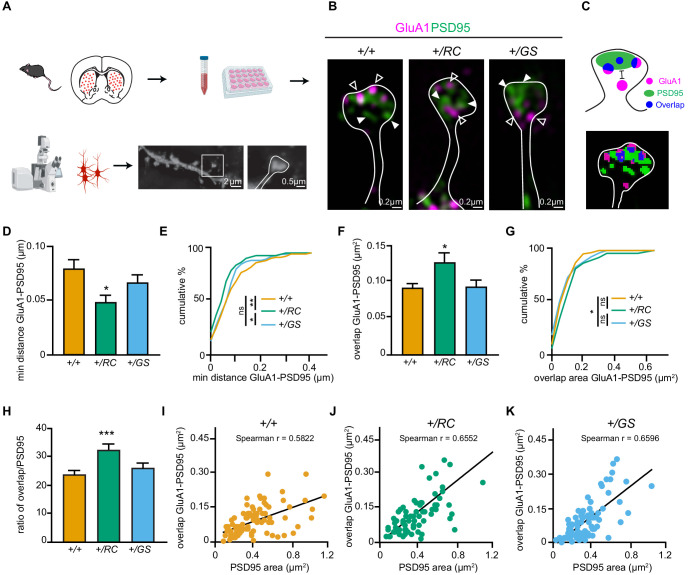
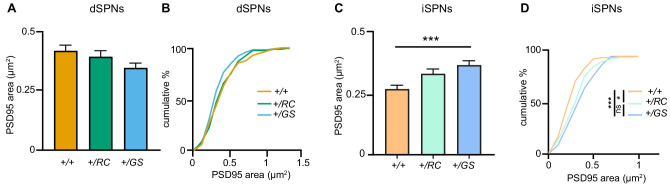
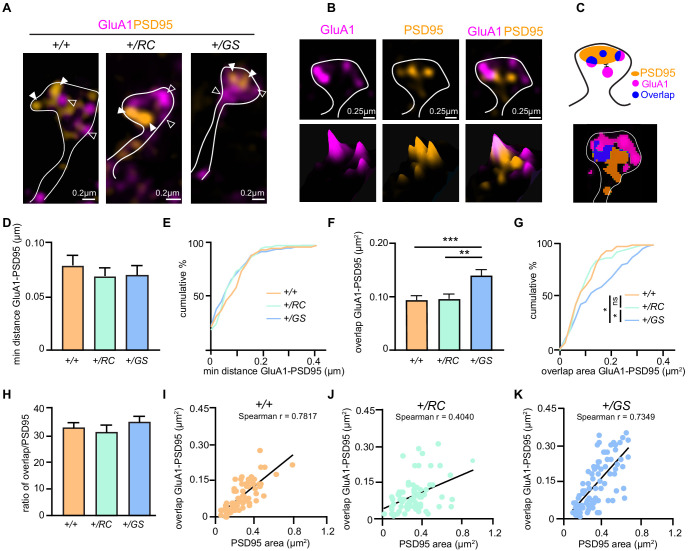
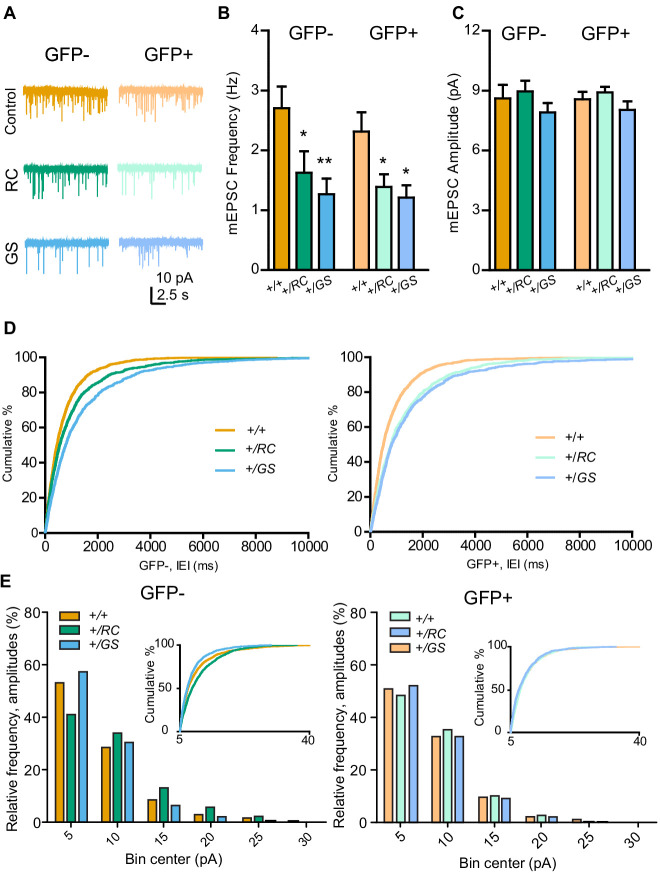
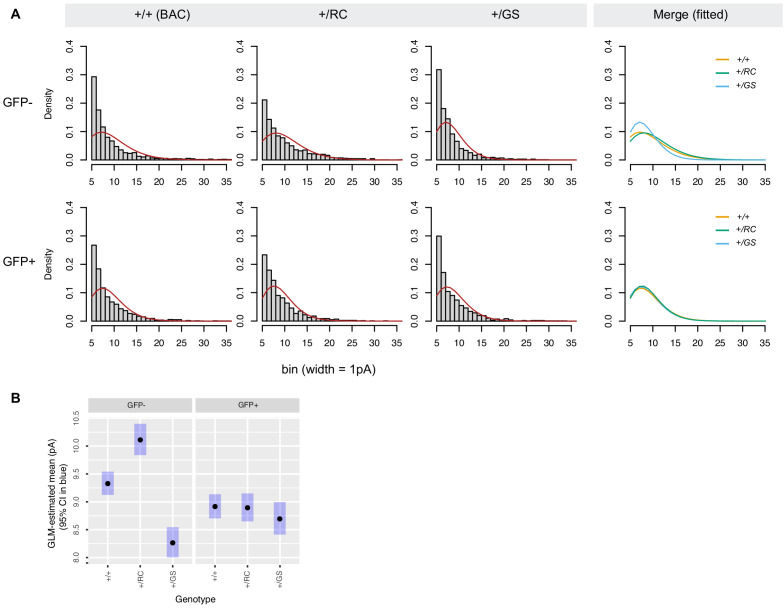
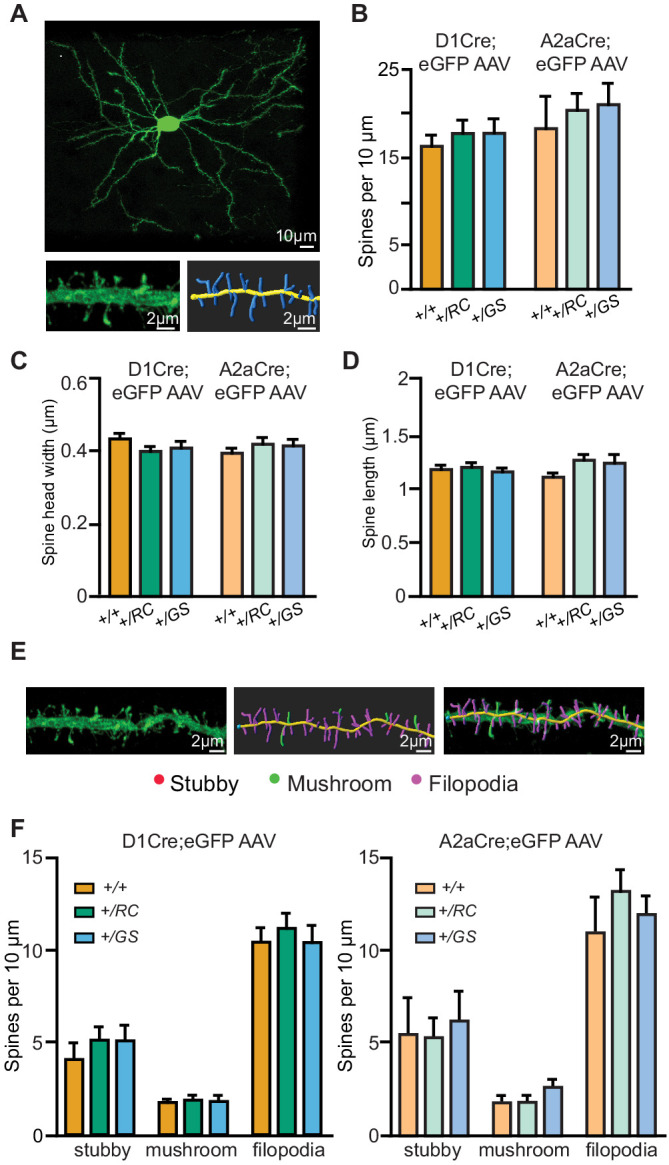
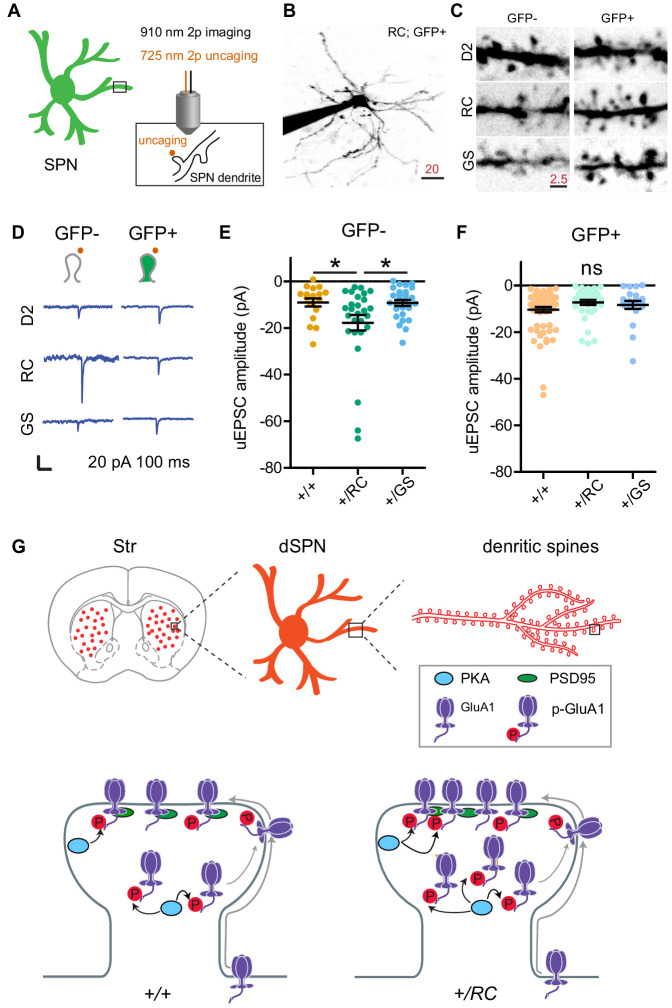
LRRK2 is a kinase expressed in striatal spiny projection neurons (SPNs), cells which lose dopaminergic input in Parkinson's disease (PD). R1441C and G2019S are the most common pathogenic mutations of LRRK2. How these mutations alter the structure and function of individual synapses on direct and indirect pathway SPNs is unknown and may reveal pre-clinical changes in dopamine-recipient neurons that predispose toward disease. Here, R1441C and G2019S knock-in mice enabled thorough evaluation of dendritic spines and synapses on pathway-identified SPNs. Biochemical synaptic preparations and super-resolution imaging revealed increased levels and altered organization of glutamatergic AMPA receptors in LRRK2 mutants. Relatedly, decreased frequency of miniature excitatory post-synaptic currents accompanied changes in dendritic spine nano-architecture, and single-synapse currents, evaluated using two-photon glutamate uncaging. Overall, LRRK2 mutations reshaped synaptic structure and function, an effect exaggerated in R1441C dSPNs. These data open the possibility of new neuroprotective therapies aimed at SPN synapse function, prior to disease onset.

Keywords: AMPAR; LRRK2; dendritic spine; excitatory synapse; mouse; neuroscience; parkinson's disease; striatum.

Plain language summary

Parkinson’s disease is caused by progressive damage to regions of the brain that regulate movement. This leads to a loss in nerve cells that produce a signaling molecule called dopamine, and causes patients to experience shakiness, slow movement and stiffness. When dopamine is released, it travels to a part of the brain known as the striatum, where it is received by cells called spiny projection neurons (SPNs), which are rich in a protein called LRRK2. Mutations in this protein have been shown to cause the motor impairments associated with Parkinson’s disease. SPNs send signals to other regions of the brain either via a ‘direct’ route, which promotes movement, or an ‘indirect’ route, which suppresses movement. Previous studies suggest that mutations in the gene for LRRK2 influence the activity of these pathways even before dopamine signaling has been lost. Yet, it remained unclear how different mutations independently affected each pathway. To investigate this further, Chen et al. studied two of the mutations most commonly found in the human gene for LRRK2, known as G2019S and R1441C. This involved introducing one of these mutations in to the genetic code of mice, and using fluorescent proteins to mark single SPNs in either the direct or indirect pathway. The experiments showed that both mutations disrupted the connections between SPNs in the direct and indirect pathway, which altered the activity of nerve cells in the striatum. Chen et al. found that individual connections were more strongly affected by the R1441C mutation. Further experiments showed that this was caused by the re-organization of a receptor protein in the nerve cells of the direct pathway, which increased how SPNs responded to inputs from other nerve cells. These findings suggest that LRRK2 mutations disrupt neural activity in the striatum before dopamine levels become depleted. This discovery could help researchers identify new therapies for treating the early stages of Parkinson’s disease before the symptoms of dopamine loss arise.


Conflict of interest statement

CC, GS, VD, NB, SK, YK, LP No competing interests declared

Figures

Figure 1.
Figure 1.. LRRK2 RC mutation increases synaptic glutamate receptor content in the striatum.
(A) Schematic diagram of LRRK2 protein highlighting the armadillo repeats (ARM), ankyrin (ANK) repeats, Ras of complex (ROC), C-terminal of ROC (COR), kin (KIN), and WD40 domains. Knock- in mice expressing the R1441C and G2019S mutations found in the ROC and kinase domains respectively, crossed with either Drd1-Tomato or Drd2-eGFP mouse lines. (B) Workflow schematic for subcellular fractionation of striatal homogenate for the enrichment of postsynaptic density fraction (PSD). (C) Representative western blot analysis of the subcellular fractionation results, showing supernatant (S1), crude synaptosomal preparation (P2), PSD, and Triton soluble fractions (TSF). (D) Western blot analysis of +/+, +/RC, and +/GS P2 striatal fractions probed for p-PKA substrates, pS845 GluA1, total GluA1, pT72Rab8A, total Rab8A, pT73Rab10, total Rab10, and PSD95. (E) Western blot analysis of +/+, +/RC, and +/GS mice probed for GluA1, p-PKA, and PSD95. S1 and PSD fractions are shown. (F-G) Quantification of GluA1 and p-PKA proteins in PSD fractions normalized to PSD95. Summary graphs reflect the mean, error bars reflect SEM. *p<0.05, Tukey post-hoc test following one-way ANOVA.
Figure 1—figure supplement 1.
Figure 1—figure supplement 1.. LRRk2 mutations do not alter PSD95 levels.
(A–B) Supernatant (S1), crude synaptosomal preparation (P2), PSD, and Triton soluble fractions (TSF) of wild type, +/RC and +/GS striata were run on the same blot. Ponceau staining shows similar loading across genotypes at a given fraction. Western blot analysis of the fractions described in A, probed for PSD95 and Homer-1. (C) Quantification of PSD95 band intensities normalized to Homer-1. Summary graphs represent the mean, while error bars SEM. (D) Quantification of PSD95 band intensities expressed as a fraction of the intensity of PSD95 wild type in each one of the S1, P2, and PSD fractions.
Figure 2.
Figure 2.. LRRK2 RC mutation restructures the nanoscale synaptic organization of dSPNs.
(A) Schematic depicting experimental design. (B) Structured Illumination super-resolution microscopy (SIM) image of dendritic spines on +/+, +/RC, and +/GS Drd1-Tomato expressing SPNs, labeled with antibodies to GluA1 (purple), and PSD95 (green). Open arrowheads, GluA1 nanodomains; arrowheads, PSD95 nanodomains. (C) Schematic diagram and object masks depicting GluA1, PSD95, and overlap nanodomains within a dendritic spine. Minimum distance between GluA1-PSD95 is measured from the closest edge of the two nanodomains, as shown. (D, E) Summary graphs and cumulative distribution of the minimum distance between GluA1 and PSD95 nanodomains. (F, G) Summary data and cumulative frequency for the overlap area of GluA1 and PSD95 nanodomains within dendritic spines. Asterisk in D and F reflect statistical significance for Tukey’s multiple comparison tests after one-way ANOVA, whereas asterisks in E and G show statistical significance for Bonferroni post-hoc comparisons after Kolmogorov-Smirnov tests. (H) Bar graphs showing the ratio of GluA1-PSD95 overlap area in E relative to PSD95 area, across genotypes. Data are represented as mean ± SEM. (I-K) Correlation plots of overlap in GluA1-PSD95 area versus PSD95 area for +/+, +/RC, and +/GS Drd1-Tomato expressing SPNs. *p<0.05, **p<0.01, ***p<0.001.
Figure 2—figure supplement 1.
Figure 2—figure supplement 1.. LRRK2 mutations alter postsynaptic density area of SPNs.
(A) Summary graph, PSD95 area across genotypes of dSPNs. Error bars reflect SEM. (B) Cumulative percentage of PSD95 area per dendritic spine across dSPN genotypes. (C) Summary graph, PSD95 area across genotypes of iSPNs. Error bars reflect SEM; asterisks, Tukey post-hoc comparisons after one-way ANOVA, +/+ vs. +/GS p<0.001 (D) Cumulative percentage of PSD95 areas per dendritic spine across iSPN genotypes.
Figure 3.
Figure 3.. LRRK2 mutations alter the nanoscale synaptic organization of iSPNs.
(A) SIM image of +/+, +/RC, and +/GS Drd2-eGFP expressing SPNs immunostained with GluA1 (purple), and PSD95 (orange). Open arrowheads, GluA1 nanodomains; arrowheads, PSD95 nanodomains. GFP antibody was used to amplify the Drd2-eGFP signal. (B) Surface intensity through a dendritic spine head in an RC iSPN. (C) Schematic diagram and object masks depicting GluA1, PSD95, overlap nanodomains, and minimum distance between nanodomains within a dendritic spine head. (D) Bar graphs showing the minimum distance between GluA1 and PSD95 nanodomains. (E) Cumulative distribution of data shown in D. (F, G) Summary data and cumulative distribution of the overlap area between GluA1 and PSD95 nanodomains in dendritic spine heads across genotypes. Asterisks in F show statistical significance for Tukey’s multiple comparison tests after one-way ANOVA; asterisks in G reflect statistical significance for Bonferroni post-hoc comparisons after Kolmogorov-Smirnov tests. (H) The ratio of overlap area between GluA1 and PSD95 to the PSD95 area for +/+, +/RC, and +/GS iSPNs. (I-K) Correlation plots of overlap areas versus PSD95 area for iSPNs across genotypes. *p<0.05, **p<0.01, ***p<0.001.
Figure 4.
Figure 4.. Pathway-specific functional alterations of SPN synapses in LRRK2 mutants.
(A) Example miniature excitatory postsynaptic current (mEPSC) traces from individual neurons of six genotype-pathway combinations. GFP-, dSPNs; GFP+, iSPNs; color, as defined in the figure. Scale bars, 10 pA and 2.5 s. (B) Summary graph showing the frequency of pharmacologically isolated mEPSCs, in GFP- and GFP+ SPNs in controls, compared to both RC and GS mutations. Asterisks reflect statistical significance for Bonferroni post hoc comparisons after two-way ANOVA. (C) Same as B, but for mEPSC amplitude. (D) Left, cumulative distribution of inter-event intervals (IEI) for mEPSCs across genotypes for GFP- SPNs. Right, same as left, but for GFP+ SPNs. (E) Binned histograms and cumulative distribution of mEPSC amplitude data. X axis starts at 5 pA, reflecting the amplitude threshold for mEPSC identification. *p<0.05, **p<0.01.
Figure 4—figure supplement 1.
Figure 4—figure supplement 1.. Analyses of mEPSC amplitude distributions.
Left, gamma curve fits to density histogram of mEPSC amplitudes by genotype and cell type (bin width, 1 pA). Gamma AIC for GFP- controls +/+, +/RC, and +/GS was 11813, 7721, and 4920. Gamma AIC for GFP+ controls +/+, +/RC, and +/GS was 9477, 6825, and 4881. Right, overlaid gamma curve fits by genotype and cell type. (B) Amplitudes estimates from GLM using the gamma family of curves, 95% confidence intervals in blue. Bonferroni corrected post-hoc pairwise comparisons, GPF- neurons, ***p<0.0001 for all comparisons; GFP+ neurons, p>0.7.
Figure 5.
Figure 5.. Pathway-specific analysis of dendritic spine morphology in LRRK2 mutants.
(A) Example confocal maximum projection image of a +/RC;Adora2a-Cre iSPN expressing AAV8/Flex-GFP. Representative dendritic fragment with dendritic spines and the corresponding 3D Imaris generated filament. (B) Summary graph showing the dendritic spine density in pathway-identified SPNs across genotypes. Quantification of dendritic spine head width (C), and dendritic spine length (D) in d- and iSPNs. (E) Confocal maximum projection image and the corresponding 3D Imaris generated filament with classified dendritic spines. Red, stubby; green, mushroom; purple, filopodia. (F) Left, summary data showing the density of each dendritic spine category in dSPNs. Right, same as left, but for iSPNs.
Figure 6.
Figure 6.. LRRK2 RC mutation increases glutamate uncaging-evoked currents in dSPNs.
(A) Schematic illustrating experimental design. (B) Example projection of a two-photon laser scanning microscopy stack showing an +/RC; GFP+ SPN (iSPN). Scale bar, 20 µm. (C) Close up images of representative dendrites from SPNs in the six genotype-pathway combinations, shown using inverse greyscale LUT. (D) Example single synapse AMPA-receptor-mediated currents, evoked by focal uncaging of MNI-glutamate. Scale bar, 20 pA and 100 ms. (E) Summary graph showing uncaging-evoked EPSCs (uEPSCs) for GFP-SPNs in controls, RC, and GS mutants. Asterisks reflect statistical significance for Tukey post-hoc comparisons after one-way ANOVA. (F) Same as E, but for GFP+ SPNs. (G) Summary schematic for the study, illustrating changes in synaptic content of glutamate receptors in LRRK2 mutations.

References

    1. Alessi DR, Sammler E. LRRK2 kinase in Parkinson's disease. Science. 2018;360:36–37. doi: 10.1126/science.aar5683. - DOI - PubMed
    1. Banala S, Arvin MC, Bannon NM, Jin XT, Macklin JJ, Wang Y, Peng C, Zhao G, Marshall JJ, Gee KR, Wokosin DL, Kim VJ, McIntosh JM, Contractor A, Lester HA, Kozorovitskiy Y, Drenan RM, Lavis LD. Photoactivatable drugs for nicotinic optopharmacology. Nature Methods. 2018;15:347–350. doi: 10.1038/nmeth.4637. - DOI - PMC - PubMed
    1. Beccano-Kelly DA, Volta M, Munsie LN, Paschall SA, Tatarnikov I, Co K, Chou P, Cao LP, Bergeron S, Mitchell E, Han H, Melrose HL, Tapia L, Raymond LA, Farrer MJ, Milnerwood AJ. LRRK2 overexpression alters glutamatergic presynaptic plasticity, striatal dopamine tone, postsynaptic signal transduction, motor activity and memory. Human Molecular Genetics. 2015;24:1336–1349. doi: 10.1093/hmg/ddu543. - DOI - PubMed
    1. Bermejo MK, Milenkovic M, Salahpour A, Ramsey AJ. Preparation of synaptic plasma membrane and postsynaptic density proteins using a discontinuous sucrose gradient. Journal of Visualized Experiments. 2014;3:e51896. doi: 10.3791/51896. - DOI - PMC - PubMed
    1. Bonet-Ponce L, Cookson MR. The role of rab GTPases in the pathobiology of parkinson' disease. Current Opinion in Cell Biology. 2019;59:73–80. doi: 10.1016/j.ceb.2019.03.009. - DOI - PMC - PubMed

Publication types

Substances