. 2020 Dec 5;143(11):3318-3330.
doi: 10.1093/brain/awaa275.

Brain TSPO-PET predicts later disease progression independent of relapses in multiple sclerosis

Affiliations

Brain TSPO-PET predicts later disease progression independent of relapses in multiple sclerosis

Marcus Sucksdorff et al. Brain. .

Abstract

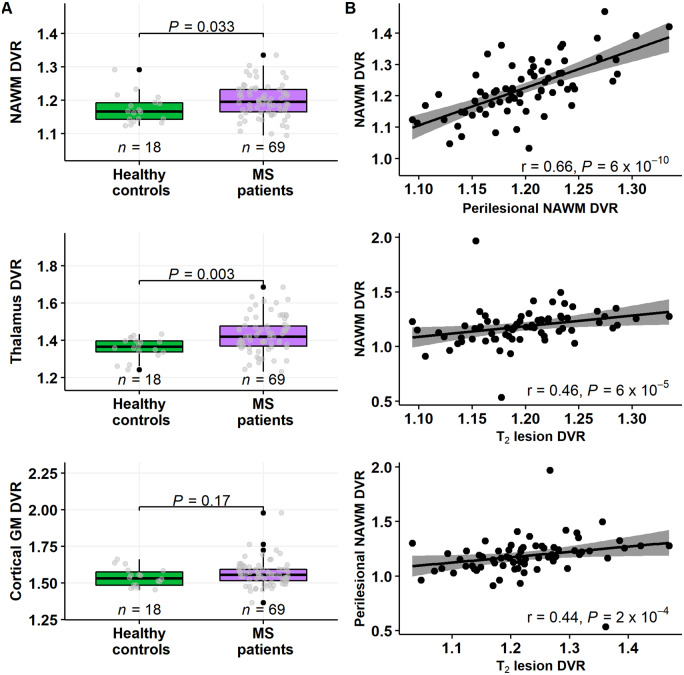
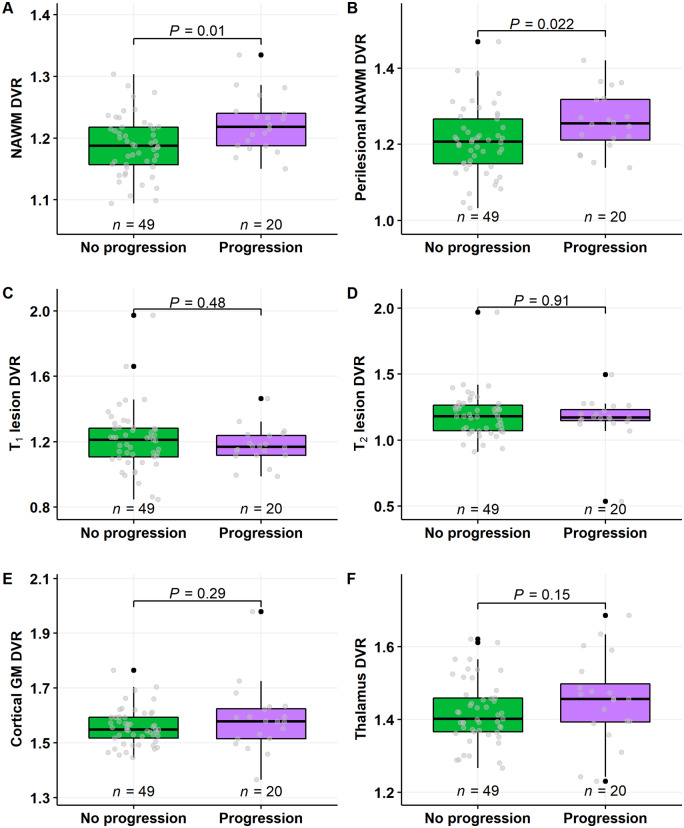
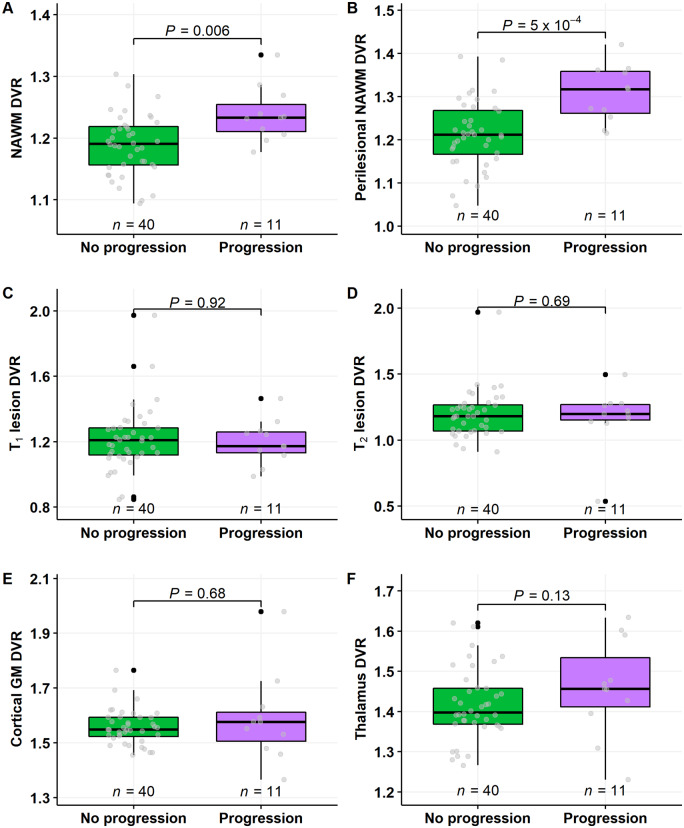
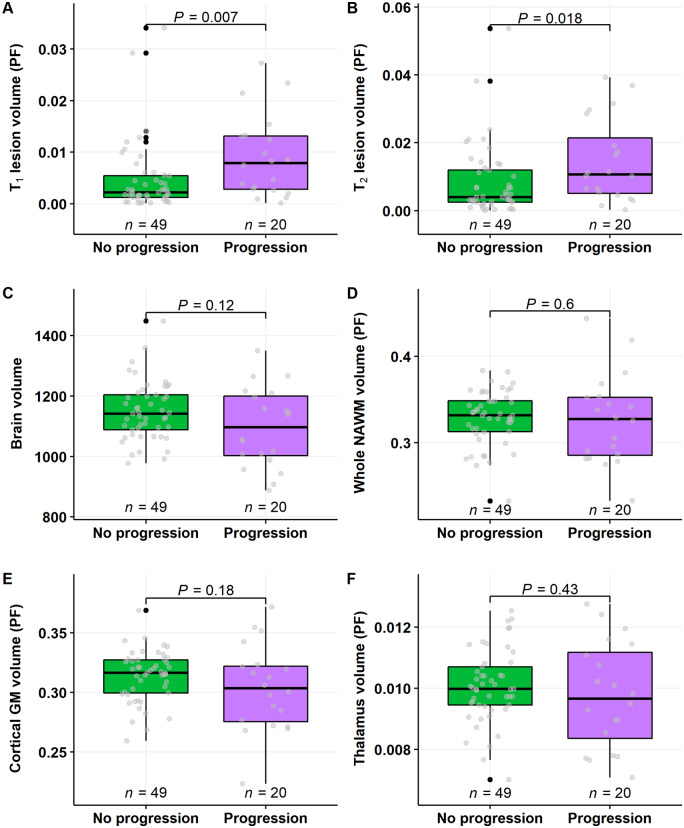
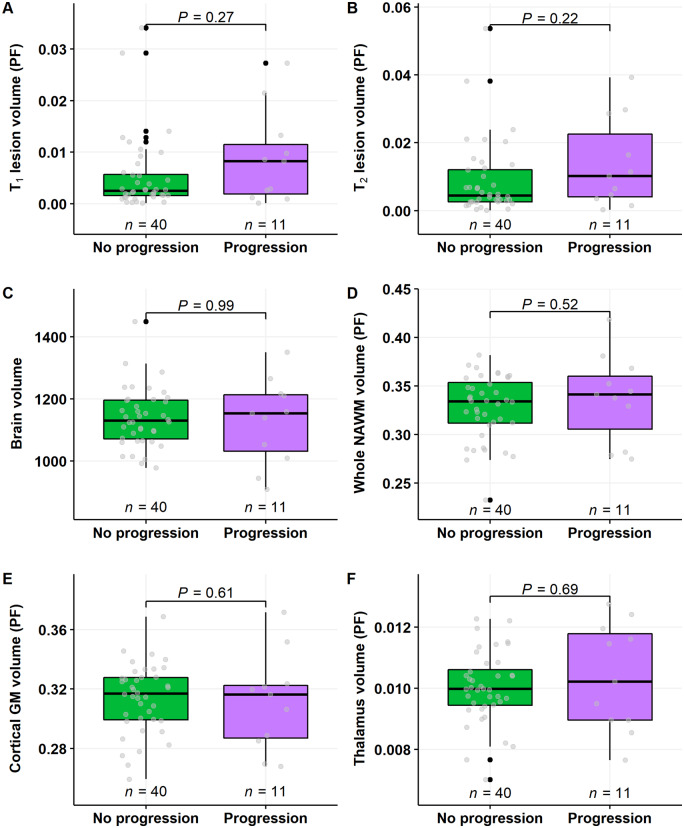
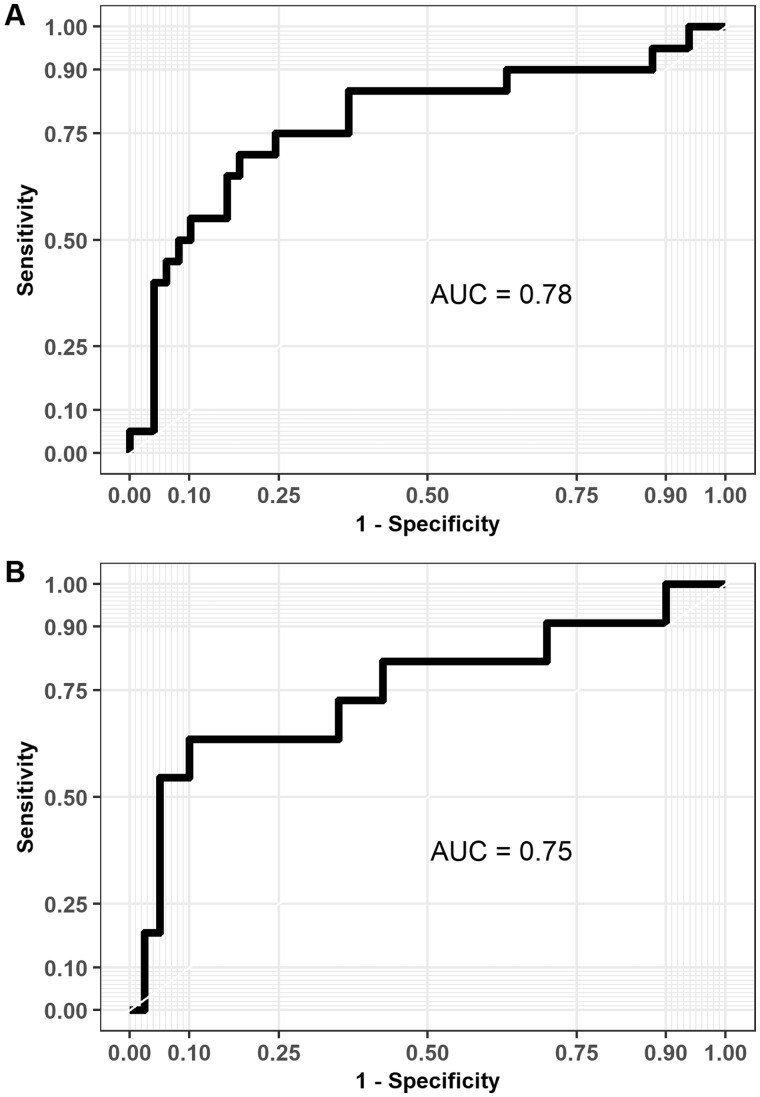
Overactivation of microglia is associated with most neurodegenerative diseases. In this study we examined whether PET-measurable innate immune cell activation predicts multiple sclerosis disease progression. Activation of microglia/macrophages was measured using the 18-kDa translocator protein (TSPO)-binding radioligand 11C-PK11195 and PET imaging in 69 patients with multiple sclerosis and 18 age- and sex-matched healthy controls. Radioligand binding was evaluated as the distribution volume ratio from dynamic PET images. Conventional MRI and disability measurements using the Expanded Disability Status Scale were performed for patients at baseline and 4.1 ± 1.9 (mean ± standard deviation) years later. Fifty-one (74%) of the patients were free of relapses during the follow-up period. Patients had increased activation of innate immune cells in the normal-appearing white matter and in the thalamus compared to the healthy control group (P = 0.033 and P = 0.003, respectively, Wilcoxon). Forward-type stepwise logistic regression was used to assess the best variables predicting disease progression. Baseline innate immune cell activation in the normal-appearing white matter was a significant predictor of later progression when the entire multiple sclerosis cohort was assessed [odds ratio (OR) = 4.26; P = 0.048]. In the patient subgroup free of relapses there was an association between macrophage/microglia activation in the perilesional normal-appearing white matter and disease progression (OR = 4.57; P = 0.013). None of the conventional MRI parameters measured at baseline associated with later progression. Our results strongly suggest that innate immune cell activation contributes to the diffuse neural damage leading to multiple sclerosis disease progression independent of relapses.

Keywords: PET imaging; TSPO; microglia; prediction; progressive multiple sclerosis.


Figures

Figure 1
Figure 1
11C-PK11195 DVR values in various brain regions of interest in multiple sclerosis patients and healthy controls. (A) Box plots of the 11C-PK11195 DVR values of patients with multiple sclerosis and healthy controls in the NAWM (top left), in the thalami and in the cortical grey matter. Evaluation of innate immune cell activation in different brain regions of interest was performed using PET imaging and the 11C-PK11195 radioligand in patients with multiple sclerosis (n =69) and in a healthy control group (n =18). Innate immune cell activation was increased in the NAWM and in the thalamus in patients compared to healthy controls. No statistically significant difference was detected in the cortical grey matter between these groups. Wilcoxon rank-sum test was used for statistical analyses. In box plots the thick horizontal lines represent the medians, the boxes represent the IQR and the end of the whiskers or the points of the outliers represent the minimum and maximum values. (B) Correlation between 11C-PK11195 DVR measurements in the different brain regions of interest. DVR values in the NAWM, in the perilesional NAWM and in T2 lesions correlated highly with each other. Spearman correlation was used for statistical analyses. GM = grey matter; MS = multiple sclerosis.
Figure 2
Figure 2
11C-PK11195 DVR values in multiple sclerosis patients with or without progression during follow-up. Innate immune cell activation was higher both in the NAWM (A) and in the perilesional NAWM (B) in patients who experienced disease progression, compared to those who did not progress, during an average follow-up of 4 years. In other regions of interest, no differences between disease progression and baseline innate immune cell activation was observed (BF). Wilcoxon rank-sum test was used for statistical analysis. GM = grey matter.
Figure 3
Figure 3
11C-PK11195 DVR values in multiple sclerosis patients with no relapses and with or without progression during follow-up. Innate immune cell activation was higher both in the NAWM (A) and in the perilesional NAWM (B) in patients who experienced disease progression, compared to those who did not progress. In other regions of interest, no differences between disease progression and baseline innate immune cell activation was observed (BF). Wilcoxon rank-sum test was used. GM = grey matter.
Figure 4
Figure 4
Baseline conventional MRI lesion load and brain volume measurements in multiple sclerosis patients with or without progression during follow-up. T1 and T2 lesion load at baseline imaging was higher in patients who experienced disease progression, compared to those who did not progress (A and B). There were no differences in brain volume variables between the groups (CF). Wilcoxon rank-sum test was used. GM = grey matter; PF = parenchymal fractions.
Figure 5
Figure 5
Baseline conventional MRI lesion load and brain volume measurements in multiple sclerosis patients with no relapses and with or without progression during follow-up. There were no statistically significant differences on the conventional MRI volumetric measurements. Wilcoxon rank-sum test was used. GM = grey matter; PF = parenchymal fractions.
Figure 6
Figure 6
Receiver operating characteristic curves with AUC values based on the predictions from the logistic regression models using leave-one-out cross validation. (A) The logistic regression model for the whole multiple sclerosis cohort (n =69) predicted correctly progression in 11/20 patients (sensitivity = 55%) and no progression in 44/49 patients (specificity = 90%). (B) The logistic regression model for the cohort without any relapses (n =51) predicted correctly progression in 6/11 patients (sensitivity = 55%) and no progression in 38/40 patients (specificity = 95%).

References

    1. Absinta M, Sati P, Masuzzo F, Nair G, Sethi V, Kolb H. Association of chronic active multiple sclerosis lesions with disability in vivo. JAMA Neurol 2019; 76: 1474–83. - PMC - PubMed
    1. Andelova M, Uher T, Krasensky J, Sobisek L, Kusova E, Srpova B, et al.Additive effect of spinal cord volume, diffuse and focal cord pathology on disability in multiple sclerosis. Front Neurol 2019; 10: 820. - PMC - PubMed
    1. Bar-Zohar D, Agosta F, Goldstaub D, Filippi M.. Magnetic resonance imaging metrics and their correlation with clinical outcomes in multiple sclerosis: a review of the literature and future perspectives. Mult Scler 2008; 14: 719–27. - PubMed
    1. Barro C, Benkert P, Disanto G, Tsagkas C, Amann M, Naegelin Y, et al.Serum neurofilament as a predictor of disease worsening and brain and spinal cord atrophy in multiple sclerosis. Brain 2018; 141: 2382–91. - PubMed
    1. Bermel RA, Bakshi R.. The measurement and clinical relevance of brain atrophy in multiple sclerosis. Lancet Neurol 2006; 5: 158–70. - PubMed

Publication types