

Blood pressure changes PVAT function and transcriptome: use of the mid-thoracic aorta coarcted rat
- PMID: 33006918
- PMCID: PMC7792711
- DOI: 10.1152/ajpheart.00332.2020
Blood pressure changes PVAT function and transcriptome: use of the mid-thoracic aorta coarcted rat
Abstract
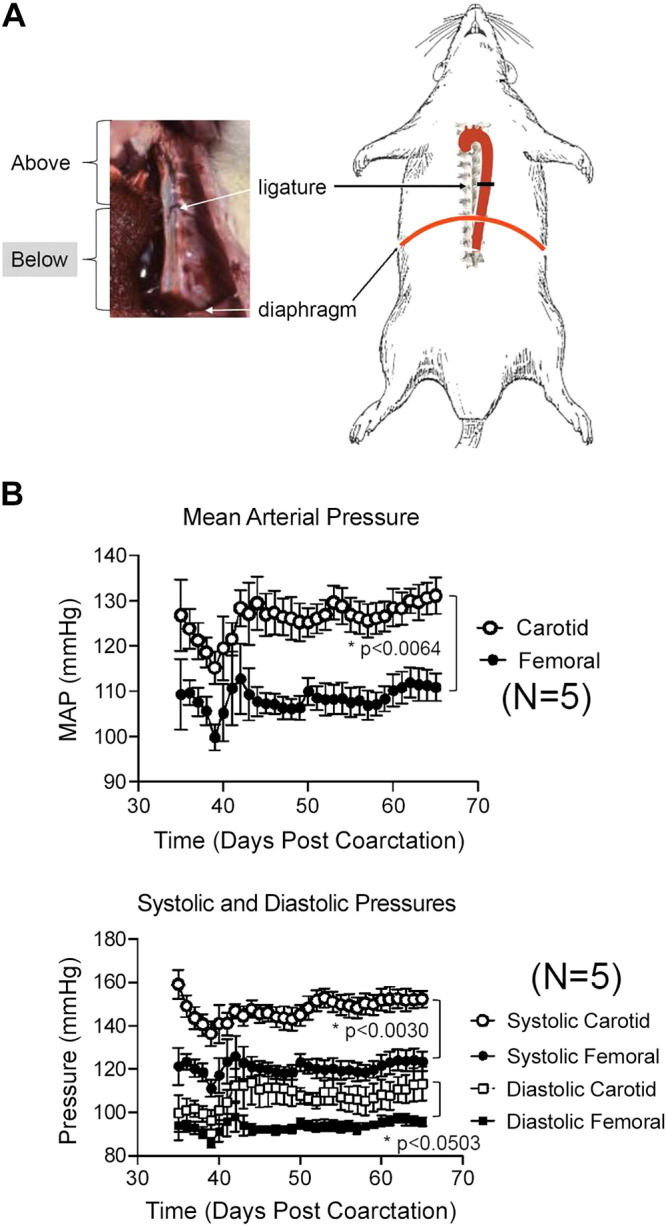
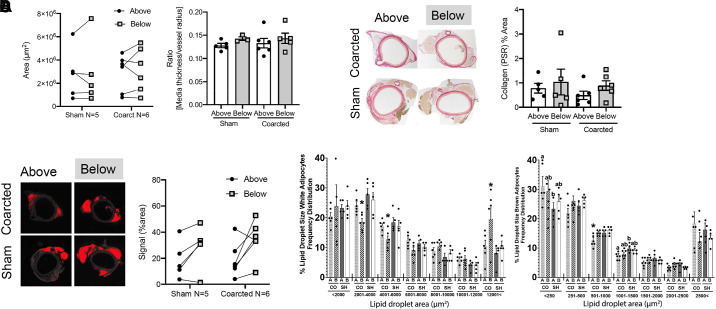
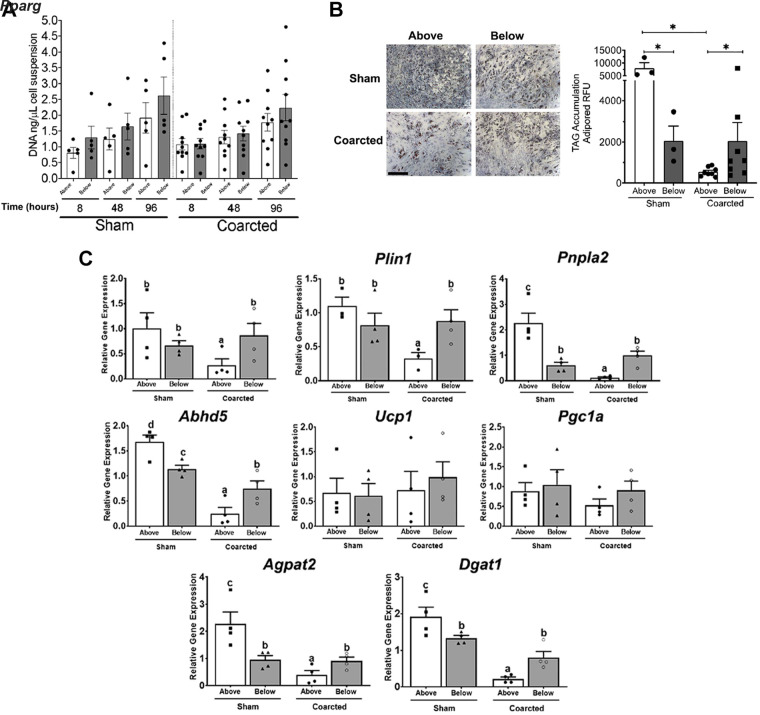
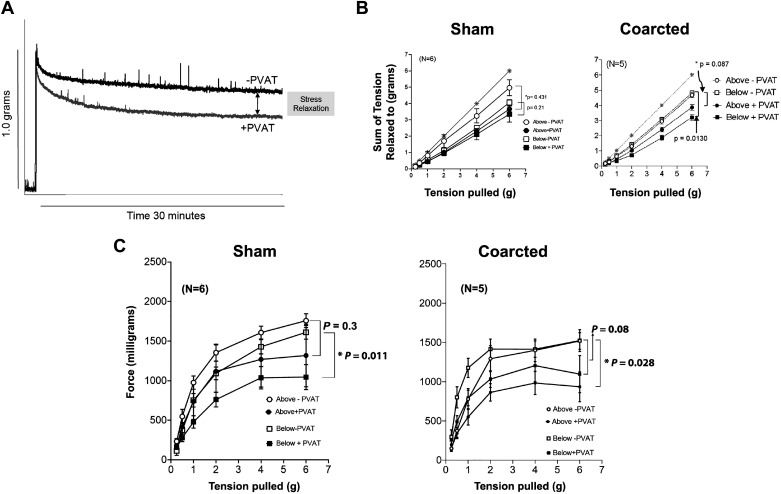
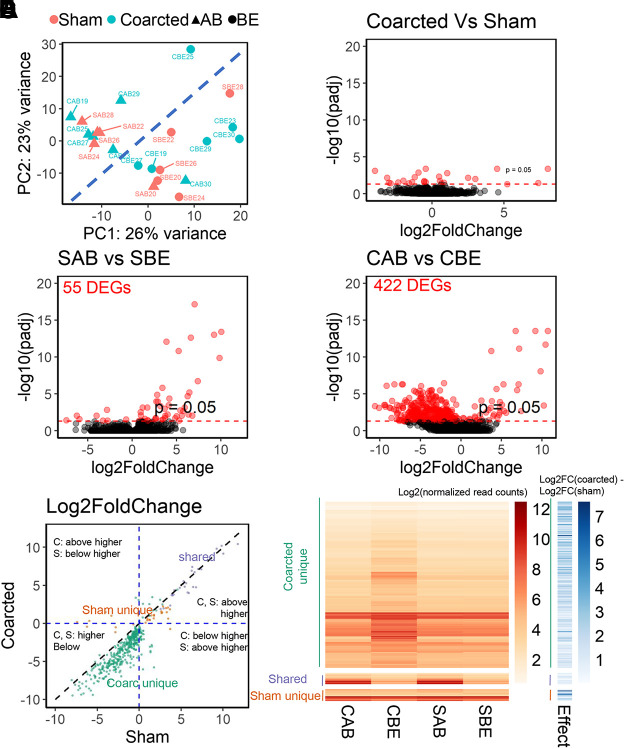
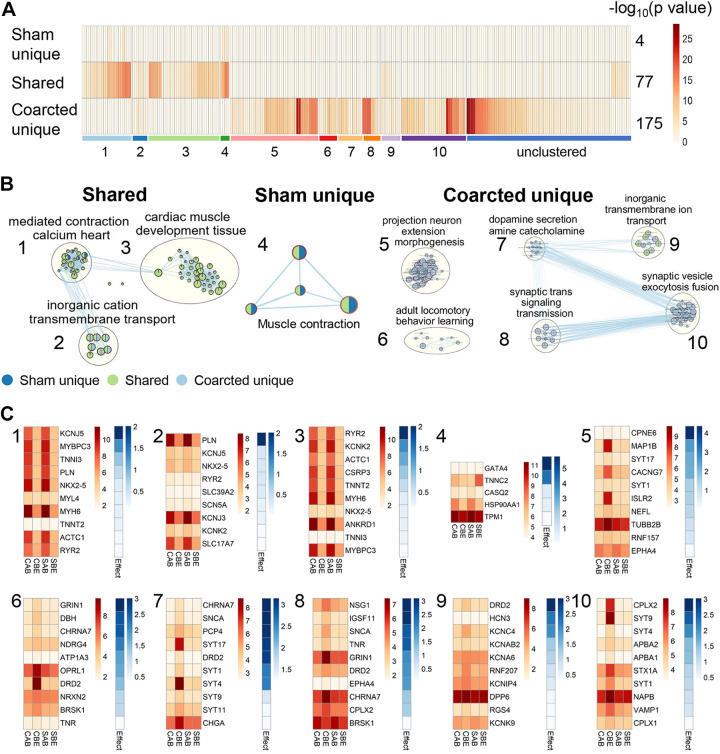
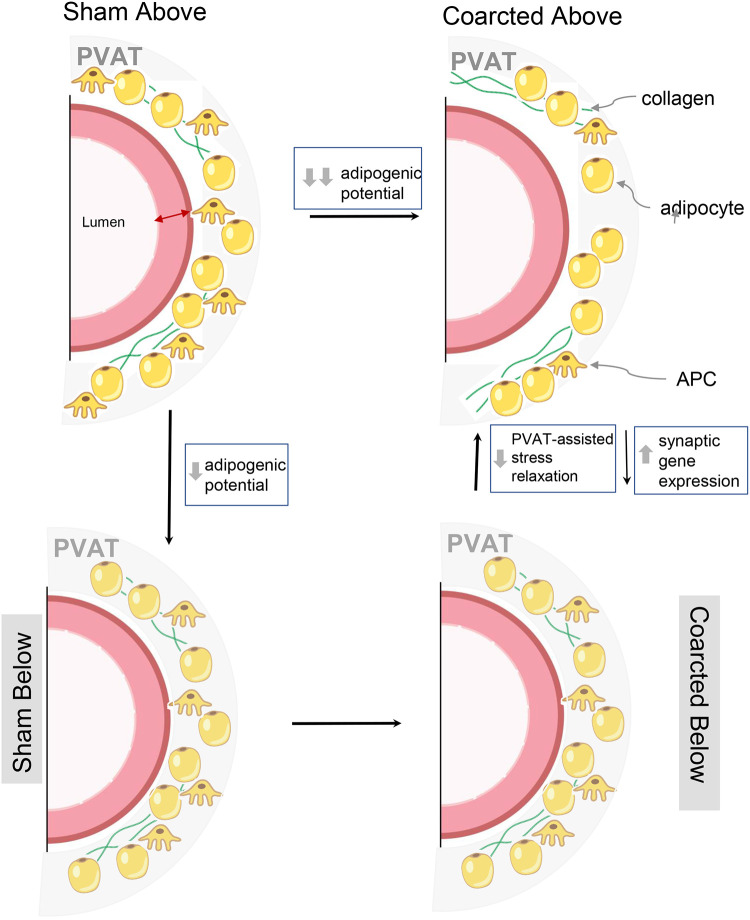
Perivascular adipose tissue (PVAT) modifies the contractile function of the vessel it surrounds (outside-in signaling). Little work points to the vessel actively affecting its surrounding PVAT. We hypothesized that inside-out arterial signaling to PVAT would be evidenced by the response of PVAT to changes in tangential vascular wall stress. Rats coarcted in the mid-thoracic aorta created PVAT tissues that would exemplify pressure-dependent changes (above vs. below coarctation); a sham rat was used as a control. Radiotelemetry revealed a ∼20 mmHg systolic pressure gradient across the coarctation 4 wk after surgery. Four measures (histochemical, adipocyte progenitor proliferation and differentiation, isometric tone, and bulk mRNA sequencing) were used to compare PVAT above versus below the ligature in sham and coarcted rats. Neither aortic collagen deposition in PVAT nor arterial media/radius ratio above coarctation was increased versus below segments. However, differentiated adipocytes derived from PVAT above the coarctation accumulated substantially less triglycerides versus those below; their relative proliferation rate as adipogenic precursors was not different. Functionally, the ability of PVAT to assist stress relaxation of isolated aorta was reduced in rings above versus below the coarctation. Transcriptomic analyses revealed that the coarctation resulted in more differentially expressed genes (DEGs) between PVAT above versus below when compared with sham samples from the same locations. A majority of DEGs were in PVAT below the coarctation and were enriched in neuronal/synaptic terms. These findings provide initial evidence that signaling from the vascular wall, as stimulated by a pressure change, influences the function and transcriptional profile of its PVAT.NEW & NOTEWORTHY A mid-thoracic aorta coarcted rat was created to generate a stable pressure difference above versus below the coarctation ligature. This study determined that the PVAT around the thoracic aorta exposed to a higher pressure has a significantly reduced ability to assist stress relaxation versus that below the ligature and appears to retain the ability to be anticontractile. At the same time, the PVAT around the thoracic aorta exposed to higher pressure had a reduced adipogenic potential versus that below the ligature. Transcriptomics analyses indicated that PVAT below the coarctation showed the greatest number of DEGs with an increased profile of the synaptic neurotransmitter gene network.
Keywords: PVAT; adipocyte; mechanotransduction.
Conflict of interest statement
No conflicts of interest, financial or otherwise, are declared by the authors.
Figures
Similar articles
-
Perivascular Adipocytes' Adipogenesis Is Defined by Their Anatomical Location in the Descending Thoracic Aorta.Cells. 2025 Apr 11;14(8):579. doi: 10.3390/cells14080579. Cells. 2025. PMID: 40277904 Free PMC article.
-
The distribution and adipogenic potential of perivascular adipose tissue adipocyte progenitors is dependent on sexual dimorphism and vessel location.Physiol Rep. 2016 Oct;4(19):e12993. doi: 10.14814/phy2.12993. Physiol Rep. 2016. PMID: 27738018 Free PMC article.
-
Distinct adipocyte progenitor cells are associated with regional phenotypes of perivascular aortic fat in mice.Mol Metab. 2018 Mar;9:199-206. doi: 10.1016/j.molmet.2017.12.014. Epub 2018 Jan 10. Mol Metab. 2018. PMID: 29396370 Free PMC article.
-
The pathobiology of perivascular adipose tissue (PVAT), the fourth layer of the blood vessel wall.Cardiovasc Pathol. 2022 Nov-Dec;61:107459. doi: 10.1016/j.carpath.2022.107459. Epub 2022 Jul 28. Cardiovasc Pathol. 2022. PMID: 35907442 Review.
-
Perivascular Adipose Tissue Regulates Vascular Function by Targeting Vascular Smooth Muscle Cells.Arterioscler Thromb Vasc Biol. 2020 May;40(5):1094-1109. doi: 10.1161/ATVBAHA.120.312464. Epub 2020 Mar 19. Arterioscler Thromb Vasc Biol. 2020. PMID: 32188271 Free PMC article. Review.
Cited by
-
PVAT adipocyte: energizing, modulating, and structuring vascular function during normotensive and hypertensive states.Am J Physiol Heart Circ Physiol. 2025 Jun 1;328(6):H1204-H1217. doi: 10.1152/ajpheart.00093.2025. Epub 2025 Apr 18. Am J Physiol Heart Circ Physiol. 2025. PMID: 40250838 Free PMC article. Review.
-
PVAT-conditioned media from Dahl S rats on high fat diet promotes inflammatory cytokine secretion by activated T cells prior to the development of hypertension.PLoS One. 2024 Oct 3;19(10):e0302503. doi: 10.1371/journal.pone.0302503. eCollection 2024. PLoS One. 2024. PMID: 39361560 Free PMC article.
-
Innervation of adipocytes is limited in mouse perivascular adipose tissue.Am J Physiol Heart Circ Physiol. 2024 Jul 1;327(1):H155-H181. doi: 10.1152/ajpheart.00041.2024. Epub 2024 May 24. Am J Physiol Heart Circ Physiol. 2024. PMID: 38787382 Free PMC article.
-
Mechanotransduction in the Perivascular Adipose Tissue.Arterioscler Thromb Vasc Biol. 2025 Apr;45(4):461-467. doi: 10.1161/ATVBAHA.124.321688. Epub 2025 Feb 13. Arterioscler Thromb Vasc Biol. 2025. PMID: 39945069 Review.
-
Male and female high-fat diet-fed Dahl SS rats are largely protected from vascular dysfunctions: PVAT contributions reveal sex differences.Am J Physiol Heart Circ Physiol. 2021 Jul 1;321(1):H15-H28. doi: 10.1152/ajpheart.00131.2021. Epub 2021 Apr 30. Am J Physiol Heart Circ Physiol. 2021. PMID: 33929898 Free PMC article.
References
Publication types
MeSH terms
Grants and funding
LinkOut - more resources
Full Text Sources