. 2020 Oct 2;16(10):e1008209.
doi: 10.1371/journal.pcbi.1008209. eCollection 2020 Oct.

Non-equilibrium landscape and flux reveal the stability-flexibility-energy tradeoff in working memory

Affiliations

Non-equilibrium landscape and flux reveal the stability-flexibility-energy tradeoff in working memory

Han Yan et al. PLoS Comput Biol. .

Abstract

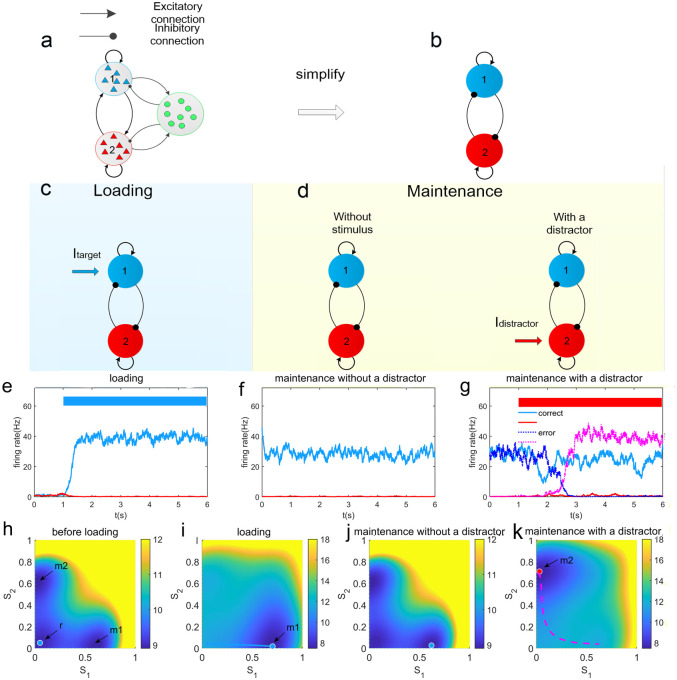
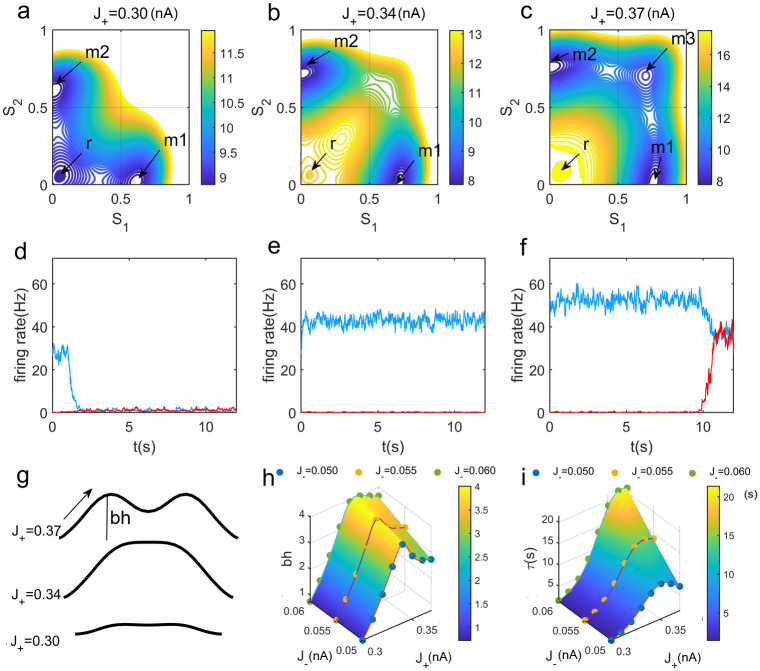
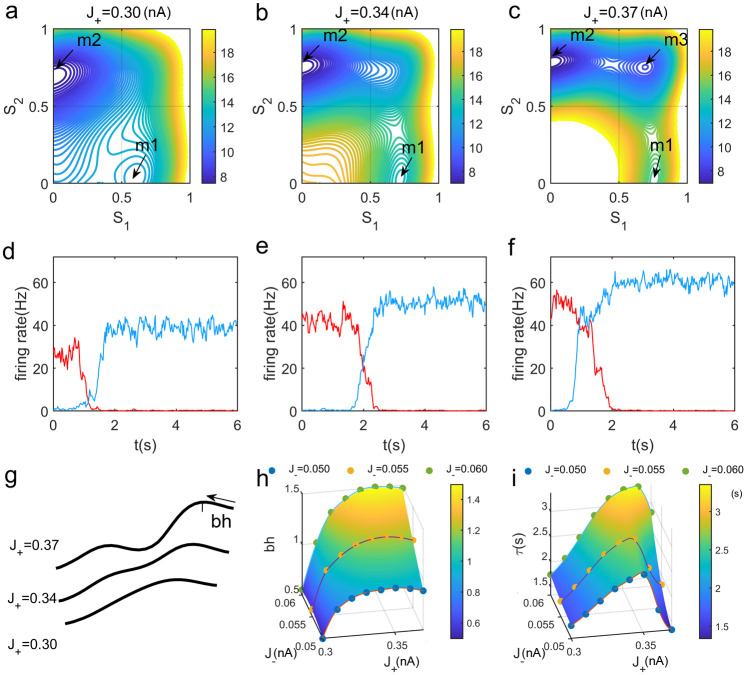
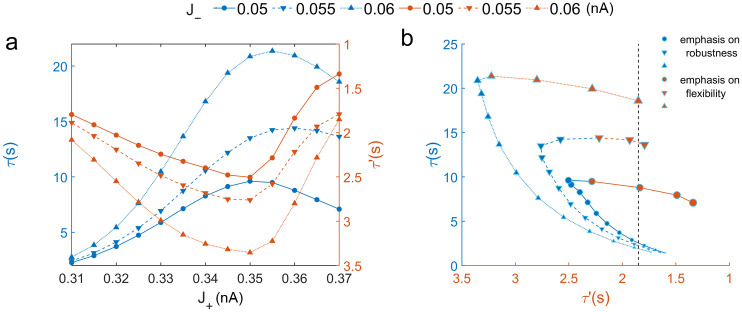
Uncovering the underlying biophysical principles of emergent collective computational abilities, such as working memory, in neural circuits is one of the most essential concerns in modern neuroscience. Working memory system is often desired to be robust against noises. Such systems can be highly flexible for adapting environmental demands. How neural circuits reconfigure themselves according to the cognitive task requirement remains unclear. Previous studies explored the robustness and the flexibility in working memory by tracing individual dynamical trajectories in a limited time scale, where the accuracy of the results depends on the volume of the collected statistical data. Inspired by thermodynamics and statistical mechanics in physical systems, we developed a non-equilibrium landscape and flux framework for studying the neural network dynamics. Applying this approach to a biophysically based working memory model, we investigated how changes in the recurrent excitation mediated by slow NMDA receptors within a selective population and mutual inhibition mediated by GABAergic interneurons between populations affect the robustness against noises. This is realized through quantifying the underlying non-equilibrium potential landscape topography and the kinetics of state switching. We found that an optimal compromise for a working memory circuit between the robustness and the flexibility can be achieved through the emergence of an intermediate state between the working memory states. An optimal combination of both increased self-excitation and inhibition can enhance the flexibility to external signals without significantly reducing the robustness to the random fluctuations. Furthermore, we found that the enhanced performance in working memory is supported by larger energy consumption. Our approach can facilitate the design of new network structure for cognitive functions with the optimal balance between performance and cost. Our work also provides a new paradigm for exploring the underlying mechanisms of many cognitive functions based on non-equilibrium physics.


Conflict of interest statement

The authors have declared that no competing interests exist.

Figures

Fig 1
Fig 1. The schematic diagram of the circuit model for working memory.
(a)The model is comprised of two selective, excitatory populations, labeled 1 and 2. Each excitatory population is recurrently connected and inhibit each other through a common pool of inhibitory interneurons. (b)The circuit model can be simplified through a mean field approach and the linearization of the inhibition. The effective inhibition from the pool of interneurons can be implicitly represented by the inhibitory connections between the excitatory populations. (c-d)The schematic diagrams for the WM during different phases in a WM task. During the loading phase, a target stimulus is presented. During the maintenance phase, this target should be held in WM against random fluctuations and distractors after the stimulus offset. (e-g)Neural activities of single trails during different phases. The colored bars mark the presentation of the stimulus input to the population 1(blue) and 2 (red), as the target and distractor stimulus, respectively. The blue and red lines represent the activities of population 1 and population 2, respectively. (e)Before the stimulus onset, the system stays at the resting state with both populations 1 and 2 at low activity. A target stimulus can quickly induce a stimulus-selective, high activity state. (f)This stimulus-selective state can be maintained in the absence of the target stimulus. (g)Correct and error trails in the presentation of a distractor stimulus. (h-k) The corresponding potential landscapes in the (S1, S2) state space during different phases. The dimensionless quantities S1 and S2 are average synaptic gating variables of the two selective populations, which can represent the mean population activities. The label r indicates the attractor representing the resting state. The attractors representing the target-related and distractor-related memory state are labeled with m1 and m2, respectively. After the onset of the target stimulus, the target-related memory state becomes dominated. The blue solid line indicates the transition from the resting state to the target-related memory state. (k)During the maintenance phase, the underlying potential landscape is changed by the presentation of a distractor stimulus, which may induce the transition to the distractor-related attractor(pink dashed line). In this figure, we used the baseline values of circuit connection strengths as J+ = 0.30nA, J = 0.05nA.
Fig 2
Fig 2. The robustness against random fluctuations during the maintenance phase.
(a-c) The potential landscapes for different self-excitations J+ = 0.30, 0.34, 0.37nA after the stimulus offset. Here J = 0.05nA in (a-g). The attractor r for the resting-state becomes weaker while the attractors m1 and m2 for the two memory states become stronger with increasing J+. A new intermediate state m3 between the two memory state can emerge for further increasing J+ in Fig 2(c). (d-f)Neural activities of the single trails correspond to the potential landscapes for increasing J+ in the top panels. The blue and red lines represent the activities of population 1 and population 2, respectively. For both smaller and quite large J+, the system can be driven away from the target-related WM attractor under noise interferences. (g)The schematic diagram of the barrier heights on the corresponding potential landscapes for increasing J+. The barrier height is defined as the difference between the Umin(the potential minimum of the present memory attractor) and the Usaddle(the potential at the saddle point or barrier top between this memory attractor and its neighboring attractor). If the system tries to escape from the current memory state, the corresponding barrier needs to be crossed. (h-i)Robustness of WM against random fluctuations as a function of self-excitations J+ and mutual inhibition J through quantifying the corresponding barrier height and the mean first passage time(MFPT). The MFPT represents the average kinetic time of switching from the present attractor to a neighboring one. It measures the average transition time from the attractor m1 representing stimulus 1 to the resting state r before the emergence of the intermediate state for smaller self-excitation(J+ < 0.35nA). For the case that the intermediate state m3 emerges due to increasing self-excitation(J+ > 0.35nA), the MFPT measures the transition time from the attractor m1 to the intermediate state m3.
Fig 3
Fig 3. The robustness against distractors during the maintenance phase.
(a-c) The potential landscapes for different self-excitations J+ = 0.30, 0.34, 0.37nA in the presence of a distractor stimulus. Here J = 0.05nA in (a-g). The attractor r for the resting-state cannot be held and the distractor-related memory attractor m2 becomes dominated. There is also a new intermediate state m3 between the two memory states for further increasing J+ in Fig 3(c). (d-f)Neural activities of the single trails correspond to the potential landscapes for increasing J+ in the top panels. The blue and red lines represent the activities of population 1 and population 2, respectively. The system can be driven away from the target-related WM attractor by the intervening distractor. (g)The schematic diagram of the barrier heights on the corresponding potential landscapes for increasing J+. (h-i)Robustness of WM against distractors as a function of self-excitations J+ and mutual inhibition J through quantifying the corresponding barrier height and the mean first passage time(MFPT).
Fig 4
Fig 4. The relationship between the robustness against random fluctuations and the flexibility to a new stimulus.
(a)The robustness against random fluctuations and flexibility to a new stimulus as functions of self-excitation J+ and mutual inhibition J. The curves marked with the circles, lower and upper triangles represent different mutual inhibition J = 0.05, 0.055, 0.06nA, respectively. τ and τ′ represent the MFPT in the absence and presence of a new stimulus respectively. Larger τ indicates better robustness against random fluctuations and smaller τ′ implies better flexibility to a new stimulus. (b)The relationship between the robustness and flexibility. The larger size of markers on each curve indicates stronger self-excitation J+. The emergence of the intermediate state(the inflection point on each curve) leads to better flexibility to a new stimulus, while the robustness against random noise might be not significantly reduced. The blue part of each curve represents that the system is in the configuration of emphasizing the robustness where strengthening the self-excitation J+ enhanced the robustness against random fluctuations at the expense of reducing the flexibility to a new stimulus. The red part of each curve implies that the flexibility to a new stimulus can be enhanced without seriously reducing the robustness against the random fluctuations through strengthening J+.
Fig 5
Fig 5. The energy cost quantified by the entropy production rate in working memory.
(a)The entropy production rate increases with increasing J+ and J in the absence and presence of a new stimulus. The curves marked with the circles, lower and upper triangles represent different mutual inhibition J = 0.05, 0.055, 0.06nA, respectively. (b-d)The relationship among the robustness against random fluctuations, flexibility to a new stimulus and the entropy production rate. (b)Before the emergence of the intermediate state(before the inflection point on each curve), better robustness against the random fluctuations quantified in terms of the MFPT τ requires more energy cost. (c)After the emergence of the intermediate state, the additional energy is used for supporting the new attractor which can enhance the flexibility to a new stimulus quantified in terms of the MFPT τ′. The colors of circles in (d) indicate the corresponding entropy production rate. The larger size of markers on each curve indicates stronger self-excitation J+.
Fig 6
Fig 6. The emergence of the intermediate state can improve the performance in a WM task with an emphasis on flexibility to a new stimulus.
(a)Better robustness against random fluctuations with the same flexibility to a new stimulus due to the emergence of the intermediate state. For any specific mutual inhibition J, we choose a pair of self-excitation J+, which correspond to the same flexibility to a new stimulus from the data shown in Fig 4(a). Each pair of J+ corresponds to different robustness to random fluctuations. The circles on the right side indicate the robustness against random fluctuations in terms of both size and color(the escape time from the original memory attractor) for systems in the presence of the intermediate state. The circles on the left side indicate the robustness for systems without the intermediate state. For any specific pair of J+ with the same J and also the same flexibility to new signals, the robustness against random fluctuations is better for the system with the presence of the intermediate state(circles on the right side). (b-c) The distributions of the single trials switching from the target-related memory state to the distractor-related one in the absence and presence of the new intermediate state. It is obvious that the pathways are more restrained with the intermediate state. The self-excitation J+ = 0.30, 0.36nA, respectively with the mutual inhibition J = 0.05nA.
Fig 7
Fig 7. The non-equilibrium landscapes and flux in the absence and presence of a distractor stimulus.
(a)There is no external stimulus presented. (b)A distractor stimulus is presented. The purple arrows indicate the flux part of driving force. m1 and m2 indicate the two memory attractors and m3 indicates the new intermediate state. Here J+ = 0.36nA and J = 0.05nA. The color map indicates the value of potential (U = −lnPss) at each state, which is a dimensionless quantity.

Similar articles

Cited by

References

    1. Hopfield JJ. Neural Networks and Physical Systems with Emergent Collective Computational Abilities. Proceedings of the National Academy of Sciences of the United States of America-Biological Sciences. 1982;79(8):2554–2558. 10.1073/pnas.79.8.2554 - DOI - PMC - PubMed
    1. Hopfield JJ, Tank DW. Computing with Neural Circuits—a Model. Science. 1986;233(4764):625–633. 10.1126/science.3755256 - DOI - PubMed
    1. Varela F, Lachaux JP, Rodriguez E, Martinerie J. The brainweb: Phase synchronization and large-scale integration. Nature Reviews Neuroscience. 2001;2(4):229–239. 10.1038/35067550 - DOI - PubMed
    1. Deisboeck TS, Kresh JY. Complex Systems Science in Biomedicine. Springer; US; 2006. 10.1007/978-0-387-33532-2 - DOI
    1. Jonides J, Lewis RL, Nee DE, Lustig CA, Berman MG, Moore KS. The mind and brain of short-term memory. Annu Rev Psychol. 2008;59:193–224. 10.1146/annurev.psych.59.103006.093615 - DOI - PMC - PubMed

Publication types

Substances