. 2020 Oct 2;16(10):e1008821.
doi: 10.1371/journal.pgen.1008821. eCollection 2020 Oct.

The O-GlcNAc transferase OGT is a conserved and essential regulator of the cellular and organismal response to hypertonic stress

Affiliations

The O-GlcNAc transferase OGT is a conserved and essential regulator of the cellular and organismal response to hypertonic stress

Sarel J Urso et al. PLoS Genet. .

Abstract

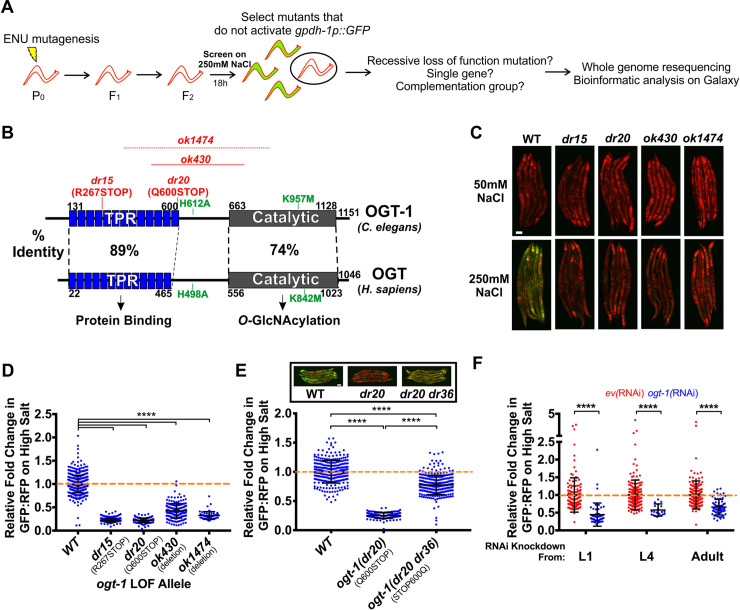
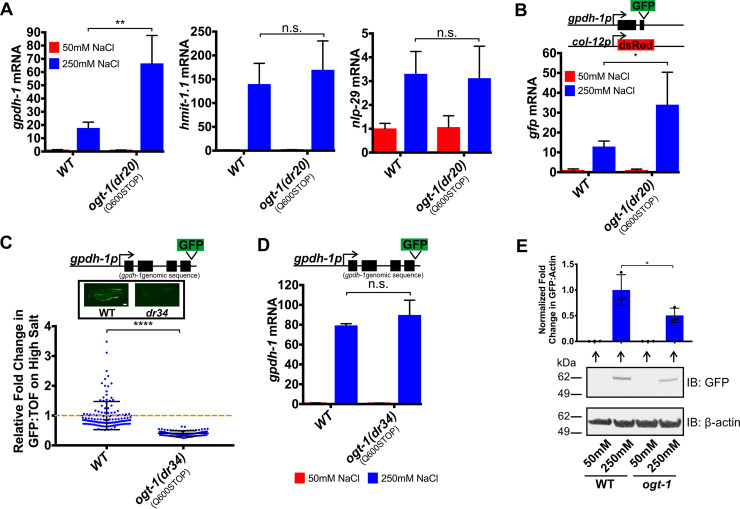
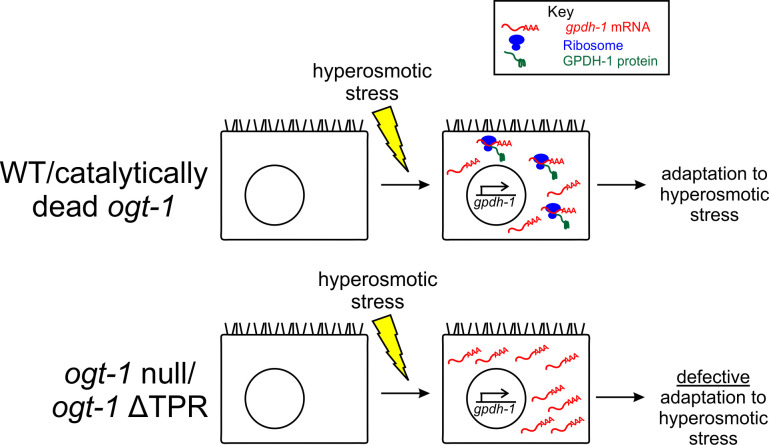
The conserved O-GlcNAc transferase OGT O-GlcNAcylates serine and threonine residues of intracellular proteins to regulate their function. OGT is required for viability in mammalian cells, but its specific roles in cellular physiology are poorly understood. Here we describe a conserved requirement for OGT in an essential aspect of cell physiology: the hypertonic stress response. Through a forward genetic screen in Caenorhabditis elegans, we discovered OGT is acutely required for osmoprotective protein expression and adaptation to hypertonic stress. Gene expression analysis shows that ogt-1 functions through a post-transcriptional mechanism. Human OGT partially rescues the C. elegans phenotypes, suggesting that the osmoregulatory functions of OGT are ancient. Intriguingly, expression of O-GlcNAcylation-deficient forms of human or worm OGT rescue the hypertonic stress response phenotype. However, expression of an OGT protein lacking the tetracopeptide repeat (TPR) domain does not rescue. Our findings are among the first to demonstrate a specific physiological role for OGT at the organismal level and demonstrate that OGT engages in important molecular functions outside of its well described roles in post-translational O-GlcNAcylation of intracellular proteins.


Conflict of interest statement

The authors have declared that no competing interests exist.

Figures

Fig 1
Fig 1. gpdh-1 transcriptional and translational reporters are upregulated by hypertonic stress.
(A) Wide-field fluorescence microscopy of day 2 adult animals expressing drIs4 (col-12p::dsRed; gpdh-1p::GFP) exposed to 50 or 250 mM NaCl NGM plates for 18 hours. Images depict merged GFP and RFP channels. Scale bar = 100 microns. (B) COPAS Biosort quantification of GFP and RFP signal in day 2 adult animals expressing drIs4 exposed to 50 or 250 mM NaCl NGM plates for 18 hours. Each point represents the quantified signal from a single animal. N ≥ 276 for each group. (C) Population mean of the normalized GFP/RFP ratio from data in 1B. Data are expressed as mean ± S.D. with individual points shown. ****—p<0.0001 (Mann-Whitney test). (D) Wide-field fluorescence microscopy of day 2 adult animals expressing a kbIs6 (gpdh-1p::GPDH-1-GFP) translational fusion protein exposed to 50 or 250 mM NaCl NGM plates for 18 hours. Scale bar = 100 microns. (E) COPAS Biosort quantification of GFP and TOF signal in day 2 adult animals expressing the kbIs6 translational fusion protein exposed to 50 or 250 mM NaCl NGM plates for 18 hours. N ≥ 276 for each group. (F) Population mean of the normalized GFP/TOF ratio from data in 1E. Data are expressed as mean ± S.D. ****—p<0.0001 (Mann-Whitney test).
Fig 2
Fig 2. The conserved O-GlcNAc transferase OGT-1 is required for the upregulation of the gpdh-1 transcriptional reporter by hypertonic stress.
(A) ENU-based forward genetic screening strategy and mutant identification workflow. (B) C. elegans OGT-1 and Homo sapiens OGT protein domain diagrams detailing the positions of the two LOF ogt-1 alleles identified in the screen (dr15 and dr20), two independently isolated ogt-1 deletion mutations (ok430 and ok1474), and two mutations that disrupt catalytic activity of the enzyme (H612A and K957M). The precise breakpoints of ok1474 have not been determined. (C) Wide-field fluorescence microscopy of day 2 adult drIs4 and ogt-1;drIs4 mutant animals exposed to 50 or 250 mM NaCl NGM plates for 18 hours. Images depict merged GFP and RFP channels. Scale bar = 100 microns. (D) COPAS Biosort quantification of GFP and RFP signal in day 2 adult animals expressing drIs4 or ogt-1;drIs4 exposed to 50 or 250 mM NaCl NGM plates for 18 hours. Data are represented as the relative fold induction of normalized GFP/RFP ratio on 250 mM NaCl NGM plates versus 50 mM NaCl NGM plates, with WT fold induction set to 1. Each point represents the quantified signal from a single animal. Data are expressed as mean ± S.D. ****—p<0.0001 (Kruskal-Wallis test with post hoc Dunn’s test). N ≥ 62 for each group. (E) COPAS Biosort quantification of GFP and RFP signal in day 2 adult animals expressing drIs4 or drIs4;ogt-1(dr20) exposed to 50 or 250 mM NaCl NGM plates for 18 hours. ogt-1(dr20 dr36) is a strain in which the dr20 mutation is converted back to WT using CRISPR/Cas9 genome editing. Data are represented as relative fold induction of normalized GFP/RFP ratio on 250 mM NaCl NGM plates versus 50 mM NaCl NGM plates, with WT fold induction set to 1. Each point represents the quantified signal from a single animal. Data are expressed as mean ± S.D. ****—p<0.0001 (Kruskal-Wallis test with post hoc Dunn’s test). N ≥ 170 for each group. Inset: Wide-field fluorescence microscopy of day 2 adult animals expressing drIs4 in the WT or indicated ogt-1 mutant background exposed to 250 mM NaCl NGM plates for 18 hours. Images depict merged GFP and RFP channels. Scale bar = 100 microns. (F) COPAS Biosort quantification of GFP and RFP signal in day 2 adult animals expressing drIs4 exposed to 50 or 250 mM NaCl NGM plates for 18 hours. Animals were placed on empty vector(RNAi) (ev(RNAi)) or ogt-1(RNAi) plates at the indicated stage. Data are represented as normalized fold induction of normalized GFP/RFP ratio on 250 mM NaCl RNAi plates relative to on 50 mM NaCl RNAi plates, with ev(RNAi) set to 1 for each RNAi timepoint. Each point represents the quantified signal from a single animal. Data are expressed as mean ± S.D. ****—p<0.0001 (Mann-Whitney test). N ≥ 144 for each group.
Fig 3
Fig 3. OGT-1 functions post-transcriptionally to regulate osmosensitive GPDH-1-GFP protein expression.
(A) qPCR of gpdh-1, hmit-1.1, and nlp-29 mRNA from WT and ogt-1(dr20) day 2 adult animals expressing drIs4 exposed to 50 or 250 mM NaCl NGM plates for 24 hours. Data are represented as fold induction of RNA on 250 mM NaCl relative to 50 mM NaCl. Data are expressed as mean ± S.D. **—p<0.01, n.s. = nonsignificant (Student’s two-tailed t-test). N ≥ 3 biological replicates of 35 animals for each group. (B) qPCR of GFP mRNA from WT and ogt-1(dr20) day 2 animals expressing drIs4 exposed to 50 or 250 mM NaCl NGM plates for 24 hours. Data are represented as fold induction of RNA on 250 mM NaCl relative to 50 mM NaCl. Data are expressed as mean ± S.D. *—p<0.05 (Student’s two-tailed t-test). N ≥ 3 biological replicates of 35 animals for each group. (C) COPAS Biosort quantification of GFP and TOF signal in day 2 adult animals expressing the kbIs6 GPDH-1 translational fusion exposed to 50 or 250 mM NaCl NGM plates for 18 hours. The ogt-1(dr34) allele carries the same homozygous Q600STOP mutation as the ogt-1(dr20) allele and was introduced using CRISPR/Cas9. Data are represented as relative fold induction of normalized GFP/TOF ratio on 250 mM NaCl NGM plates versus 50 mM NaCl NGM plates. Each point represents the quantified signal from a single animal. Data are expressed as mean ± S.D. ****—p<0.0001 (Mann-Whitney test). N ≥ 84 for each group. Inset: Wide-field fluorescence microscopy of day 2 adult animals expressing the kbIs6 translational fusion protein exposed to 250 mM NaCl NGM plates for 18 hours. Scale bar = 100 microns. (D) qPCR of gpdh-1 mRNA from day 2 adult animals expressing the kbIs6 translational fusion exposed to 50 or 250 mM NaCl NGM plates for 24 hours. Strains include WT and ogt-1(dr34). The ogt-1(dr34) allele is the dr20 point mutation introduced using CRISPR/Cas9. Data are represented as fold induction of RNA on 250 mM NaCl relative to 50 mM NaCl. Data are expressed as mean ± S.D. n.s. = nonsignificant (Student’s two-tailed t-test). N = 3 biological replicates of 35 animals for each group. (E) Immunoblot of GFP and β-actin in lysates from day 2 adult animals exposed to 50 mM or 250 mM NaCl for 18 hours. The animals express a CRISPR/Cas9 edited knock-in of GFP into the endogenous gpdh-1 gene (gpdh-1(dr81)). ogt-1 carries the dr83 allele, which is the same homozygous Q600STOP mutation as the ogt-1(dr20) allele and was introduced using CRISPR/Cas9. Top: Normalized quantification of immunoblots. *—p<0.05 (One-way ANOVA with post hoc Dunnett’s test). Bottom: Representative immunoblot. N = 3 biological replicates.
Fig 4
Fig 4. ogt-1 is required for physiological and genetic adaptation to hypertonic stress.
(A) Percent of moving unadapted and adapted day 3 adult animals exposed to 600 mM NaCl NGM plates for 24 hours. Strains expressing drIs4 are on the left of the dashed orange line and those not expressing drIs4 are on the right. ok1558 is an out-of-frame deletion allele that generates a premature stop codon in exon 2 of gpdh-1 and is therefore a likely null allele. Data are expressed as mean ± S.D. ****—p<0.0001 (One-way ANOVA with post hoc Dunnett’s test). N = 5 replicates of 20 animals for each strain. (B) COPAS Biosort quantification of GFP and RFP signal in day 2 adult animals expressing drIs4 exposed to 50 mM NaCl NGM plates. Data are represented as the fold induction of normalized GFP/RFP ratio on 50 mM NaCl NGM plates, with osm-8(dr9) set to 1. osm-8(dr9) was isolated in a previous genetic screen for new osm-8 alleles but encodes the same mutation as the n1518 reference allele. Each point represents the quantified signal from a single animal. Data are expressed as mean ± S.D. ****—p<0.0001 (Mann-Whitney test). N ≥ 109 for each group. Inset: Wide-field fluorescence microscopy of day 2 adult animals expressing drIs4 exposed to 50 mM NaCl NGM plates. Images depict merged GFP and RFP channels. Scale bar = 100 microns. (C) Percent of moving (OSR, osmotic stress resistant) day 1 animals after exposure to 500 mM NaCl or 700 mM NaCl for 10 minutes. Data are represented as mean ± S.D. ***—p<0.001, ****—p<0.0001 (Student’s two-tailed t-test). N = 5 replicates of 10 animals for each strain.
Fig 5
Fig 5. Non-canonical activity of ogt-1 primarily in the hypodermis regulates gpdh-1 induction by hypertonic stress through a functionally conserved mechanism.
(A) Wide-field fluorescence microscopy of day 2 adult animals expressing drIs4 exposed to 50 or 250 mM NaCl NGM plates for 18 hours. Strains express an ogt-1 cDNA from the indicated tissue-specific promoter. Images depict the GFP channel only for clarity. The RFP signal was unaffected in these rescue strains (not shown). Scale bar = 100 microns. (B) COPAS Biosort quantification of GFP and RFP signal in day 2 adult animals expressing drIs4 exposed to 50 or 250 mM NaCl NGM plates for 18 hours. Data are represented as the ‘Degree of Rescue’ on 250 mM NaCl NGM plates relative to on 50 mM NaCl NGM plates (see ‘Methods’ for description of this calculation). Each point represents the quantified signal from a single animal. Data are expressed as mean ± S.D. ***—p<0.001, ****—p<0.0001, n.s. = nonsignificant (Kruskal-Wallis test with post hoc Dunn’s test). N ≥ 110 for each group. (C) Wide-field fluorescence microscopy of day 2 adult animals expressing drIs4 exposed to 50 or 250 mM NaCl NGM plates for 18 hours. For the WT and catalytically inactive human rescue strains, we expressed a human cDNA corresponding to isoform 1 of OGT using an extrachromosomal array. Images depict the GFP channel for clarity. The RFP signal was unaffected in these rescue strains (not shown). Scale bar = 100 microns. (D) COPAS Biosort quantification of GFP and RFP signal in day 2 adult animals expressing drIs4 exposed to 50 or 250 mM NaCl NGM plates for 18 hours. Data are represented as the ‘Degree of Rescue’ on 250 mM NaCl NGM plates relative to on 50 mM NaCl NGM plates (see ‘Methods’ for description of this calculation). Each point represents the quantified signal from a single animal. Data are expressed as mean ± S.D. ****—p<0.0001, ***—p <0.001, **—p<0.01 (Kruskal-Wallis test with post hoc Dunn’s test). N ≥ 40 for each group. (E) Wide-field fluorescence microscopy of day 2 adult animals expressing drIs4 exposed to 50 or 250 mM NaCl NGM plates for 18 hours. Images depict the GFP channel only for clarity. The RFP signal was unaffected in these rescue strains (not shown). Scale bar = 100 microns. (F) COPAS Biosort quantification of GFP and RFP signal in day 2 adult animals expressing drIs4 exposed to 50 or 250 mM NaCl NGM plates for 18 hours. Data are represented as the fold induction of normalized GFP/RFP ratio on 50 and 250 mM NaCl NGM plates relative to on 50 mM NaCl NGM plates. Each point represents the quantified signal from a single animal. Data are expressed as mean ± S.D. ****—p<0.0001, n.s = nonsignificant (Kruskal-Wallis test with post hoc Dunn’s test). N ≥ 81 for each group. (G) Percent of moving unadapted and adapted day 3 adult animals expressing drIs4 exposed to 600 mM NaCl NGM plates for 24 hours. Data are expressed as mean ± S.D. ****—p<0.0001 (One-way ANOVA with post hoc Tukey’s test). N = 5 replicates of 20 animals for each strain.
Fig 6
Fig 6. A non-catalytic function of ogt-1 is required to couple hypertonic stress induced transcription and translation to enable physiological adaptation to hypertonic stress.
In WT, animals exposed to hypertonic stress induce the transcription of osmosensitive mRNAs, such as gpdh-1. These mRNAs are rapidly translated into protein by the ribosome, facilitating adaptation to hyperosmotic stress. Loss of ogt-1 does not interfere with hypertonic stress induced transcription. Rather, loss of ogt-1 decreases hypertonic stress induced protein levels. ogt-1 may facilitate stress-induced translation via several potential mechanisms, including regulation of mRNA cleavage and 3’UTR usage, mRNA export, initiation factor interactions, or ribosomal elongation of the transcript. Importantly, the tetratricopeptide repeat (TPR) domain but not the O-GlcNAcylation function of OGT-1 is required in the hypertonic stress response.

Similar articles

Cited by

References

    1. Burg MB. Molecular basis of osmotic regulation. The American journal of physiology. 1995;268(6 Pt 2):F983–96. Epub 1995/06/01. 10.1152/ajprenal.1995.268.6.F983 . - DOI - PubMed
    1. Terada Y, Inoshita S, Hanada S, Shimamura H, Kuwahara M, Ogawa W, et al. Hyperosmolality activates Akt and regulates apoptosis in renal tubular cells. Kidney Int. 2001;60(2):553–67. Epub 2001/07/28. 10.1046/j.1523-1755.2001.060002553.x . - DOI - PubMed
    1. Stookey JD, Pieper CF, Cohen HJ. Hypertonic hyperglycemia progresses to diabetes faster than normotonic hyperglycemia. Eur J Epidemiol. 2004;19(10):935–44. Epub 2004/12/04. 10.1007/s10654-004-5729-y . - DOI - PubMed
    1. Go WY, Liu X, Roti MA, Liu F, Ho SN. NFAT5/TonEBP mutant mice define osmotic stress as a critical feature of the lymphoid microenvironment. Proceedings of the National Academy of Sciences of the United States of America. 2004;101(29):10673–8. Epub 2004/07/13. 10.1073/pnas.0403139101 - DOI - PMC - PubMed
    1. Yancey PH. Compatible and counteracting solutes: protecting cells from the Dead Sea to the deep sea. Sci Prog. 2004;87(Pt 1):1–24. Epub 2005/01/18. 10.3184/003685004783238599 . - DOI - PMC - PubMed

Publication types

MeSH terms