. 2020 Oct 2;15(10):e0239051.
doi: 10.1371/journal.pone.0239051. eCollection 2020.

The red flour beetle Tribolium castaneum: A model for host-microbiome interactions

Affiliations

The red flour beetle Tribolium castaneum: A model for host-microbiome interactions

Aparna Agarwal et al. PLoS One. .

Abstract

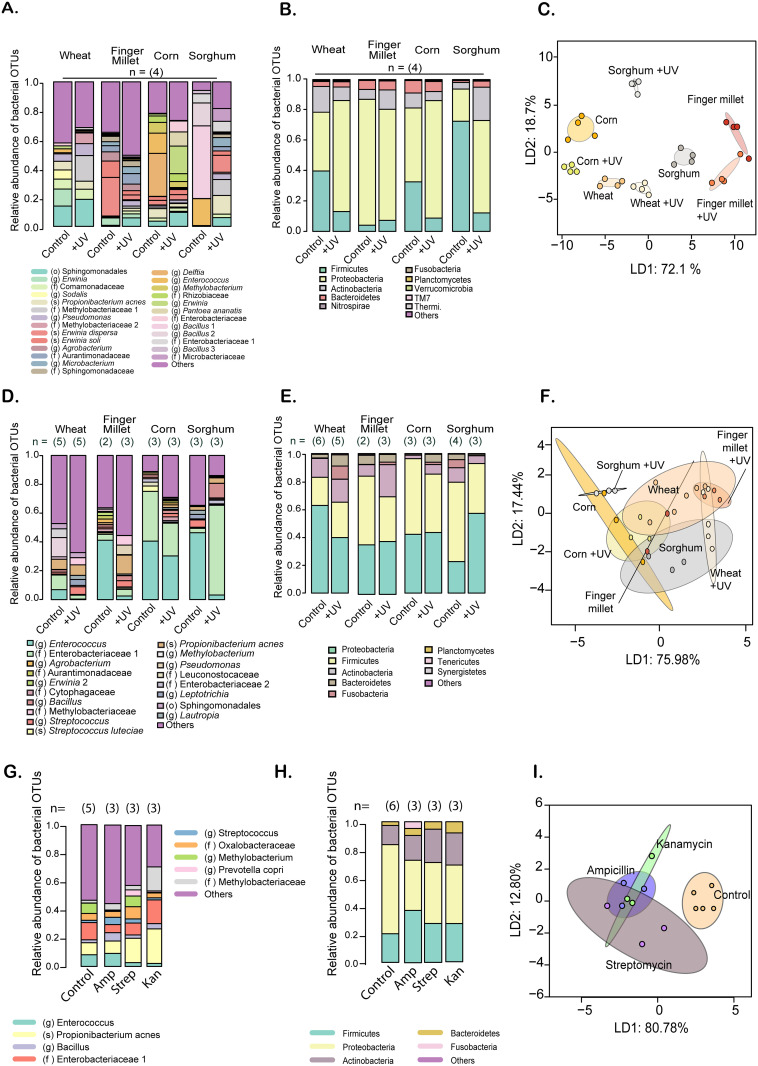
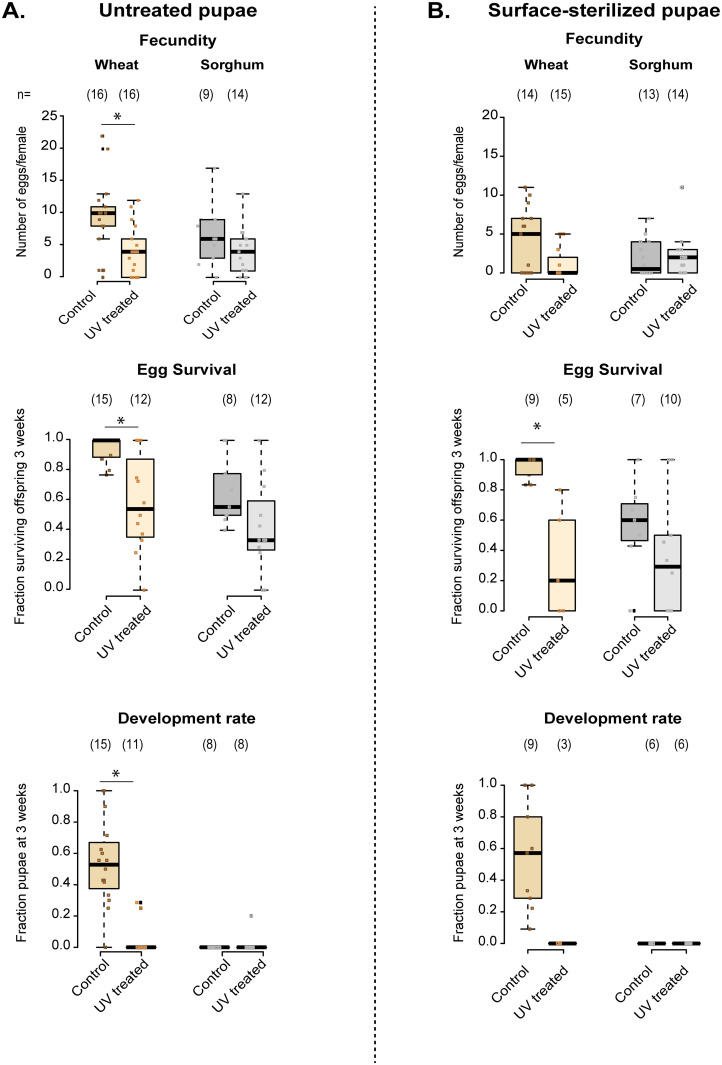
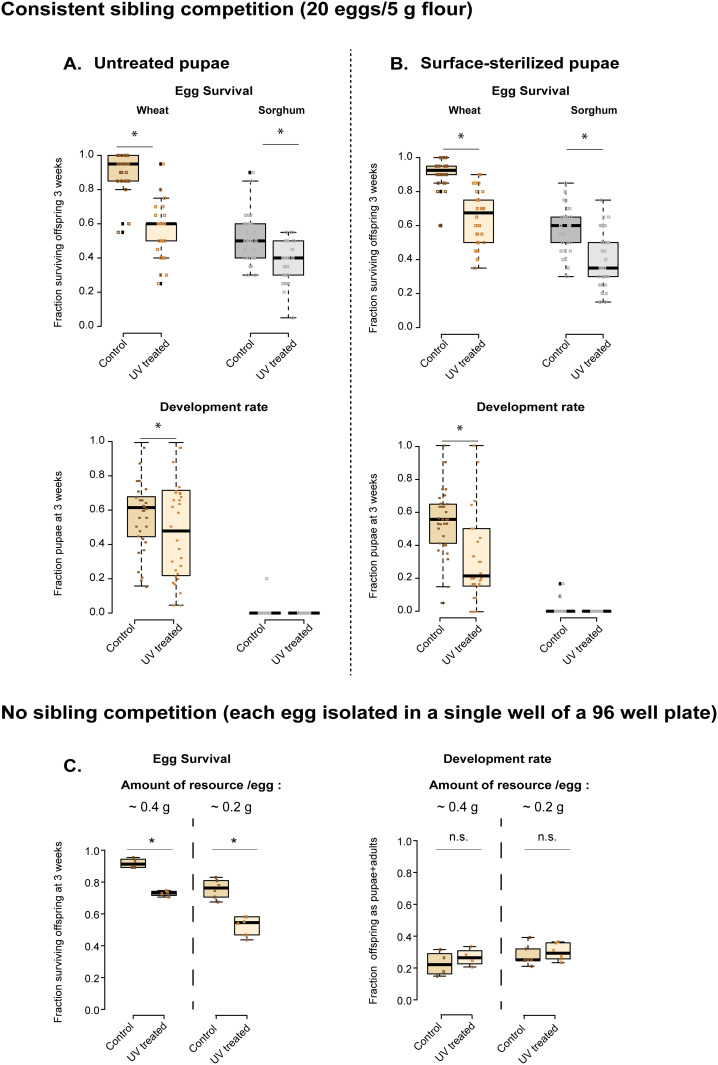
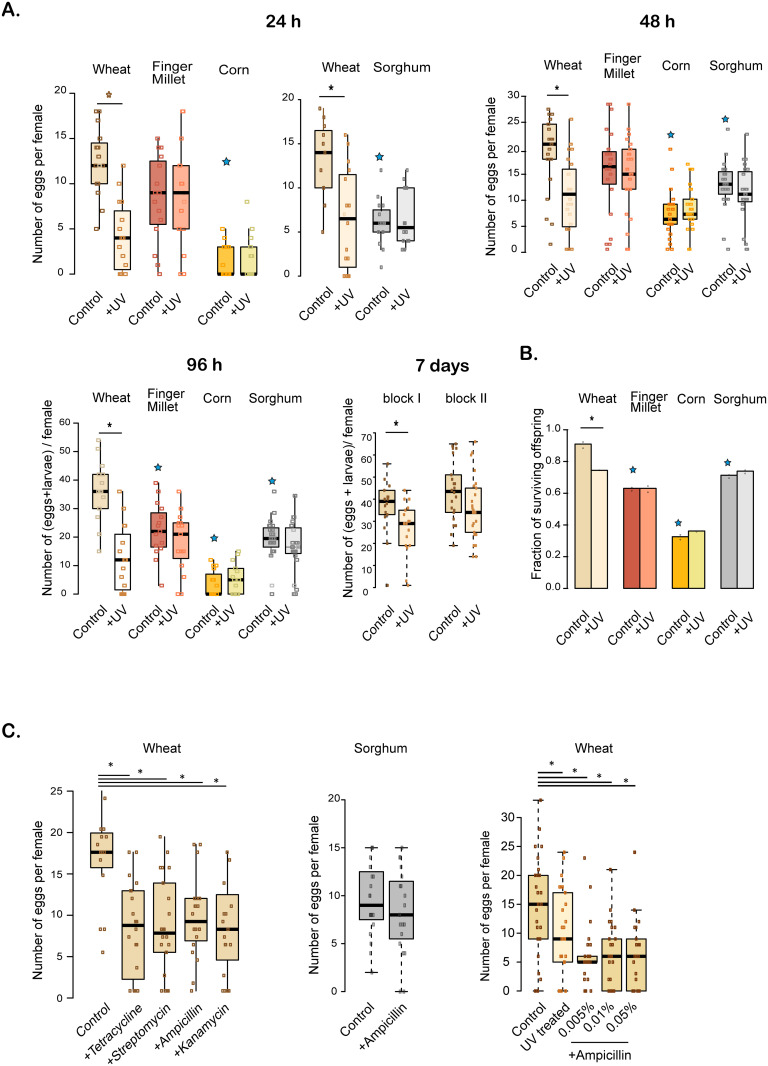
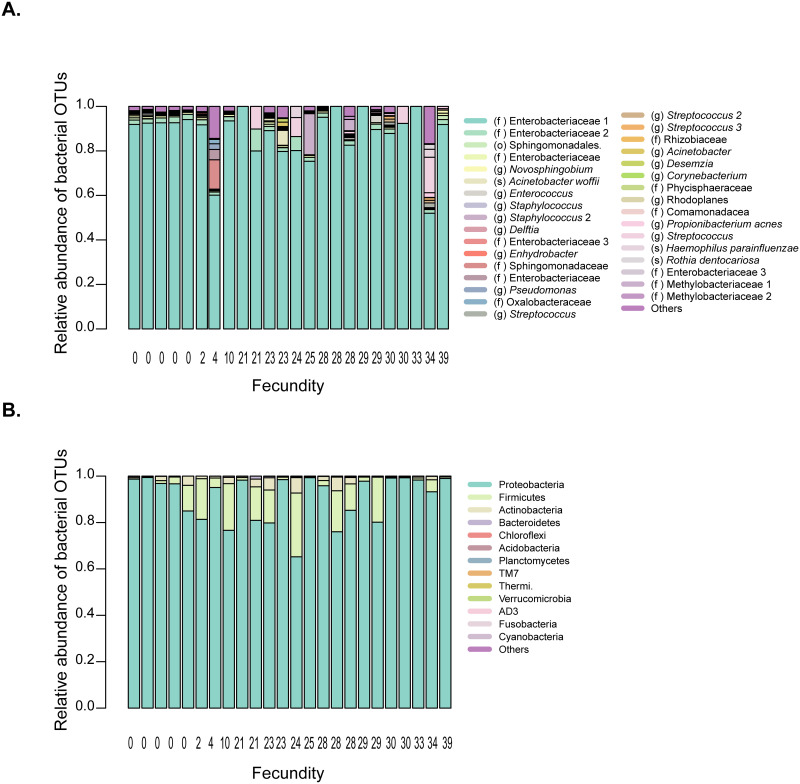
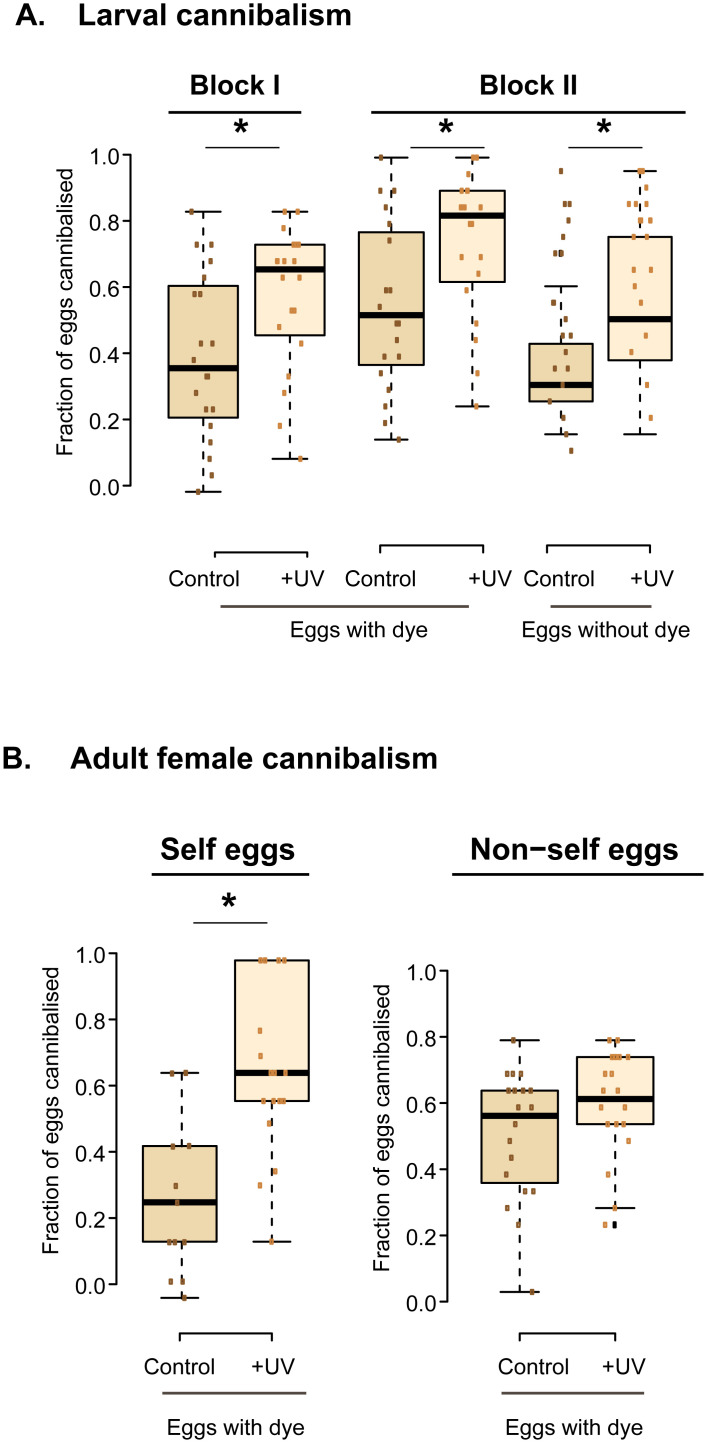
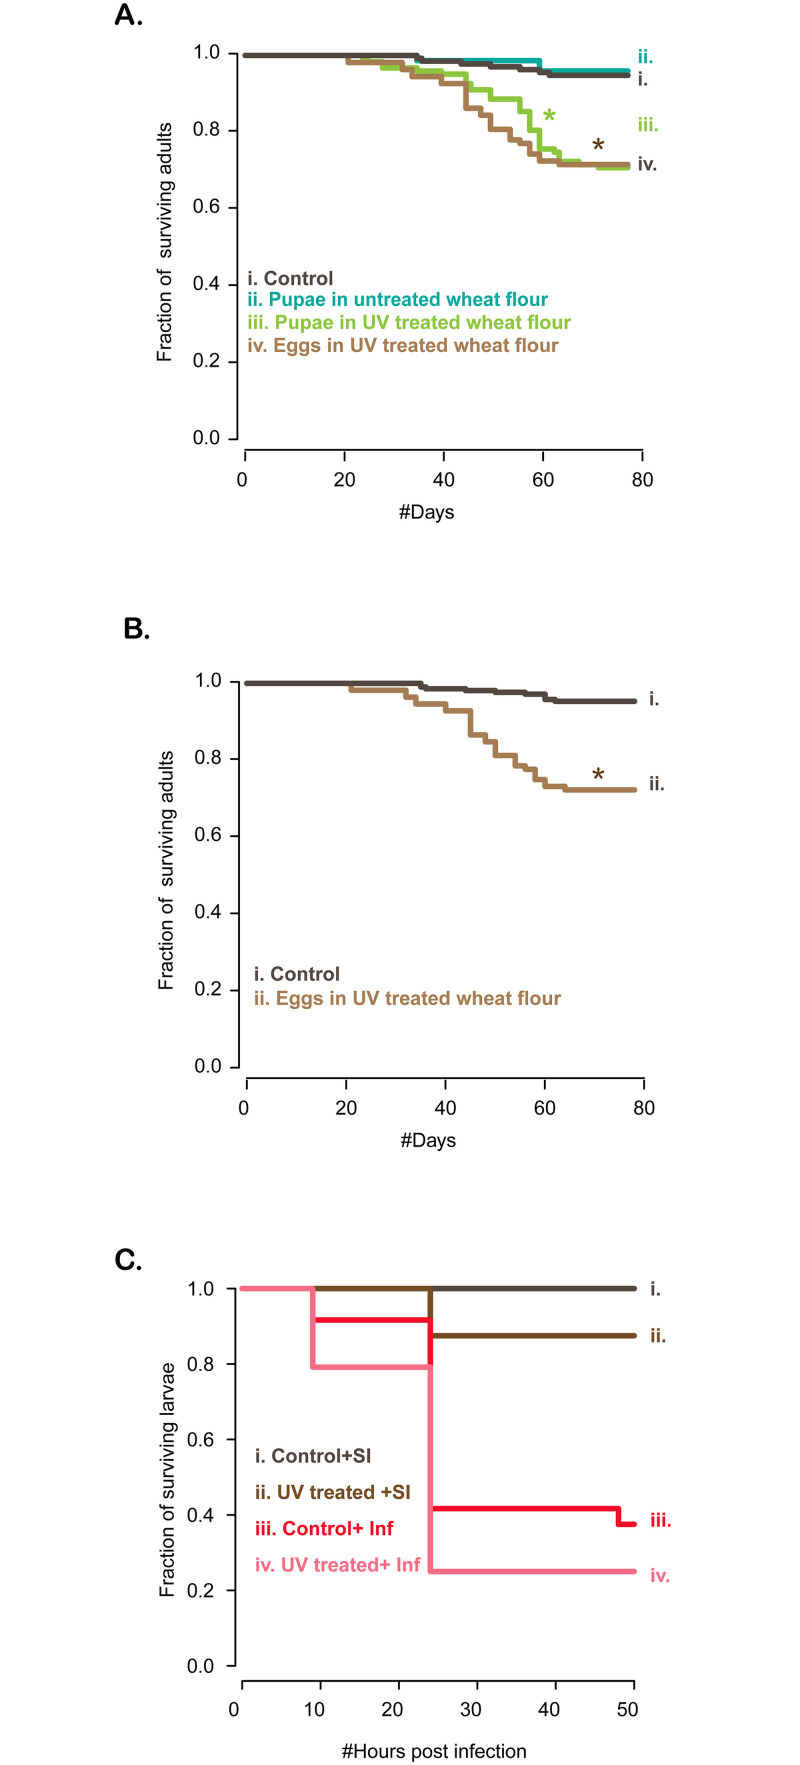
A large body of ongoing research focuses on understanding the mechanisms and processes underlying host-microbiome interactions, and predicting their ecological and evolutionary outcomes. To draw general conclusions about such interactions and understand how they are established, we must synthesize information from a diverse set of species. We analysed the microbiome of an important insect model-the red flour beetle Tribolium castaneum-which is a widespread generalist pest of stored cereals. The beetles complete their entire life cycle in flour, which thus serves multiple functions: habitat, food, and a source of microbes. We determined key factors that shape the T. castaneum microbiome, established protocols to manipulate it, and tested its consequences for host fitness. We show that the T. castaneum microbiome is derived from flour-acquired microbes, and varies as a function of (flour) resource and beetle density. Beetles gain multiple fitness benefits from their microbiome, such as higher fecundity, egg survival, and lifespan; and reduced cannibalism. In contrast, the microbiome has a limited effect on development rate, and does not enhance pathogen resistance. Importantly, the benefits are derived only from microbes in the ancestral resource (wheat flour), and not from novel resources such as finger millet, sorghum, and corn. Notably, the microbiome is not essential for beetle survival and development under any of the tested conditions. Thus, the red flour beetle is a tractable model system to understand the ecology, evolution and mechanisms of host-microbiome interactions, while closely mimicking the host species' natural niche.


Conflict of interest statement

The authors have declared that no competing interests exist.

Figures

Fig 1
Fig 1. Microbiome of wheat flour and beetles reared in wheat flour.
(A–D) Stacked bar plots show the relative abundance of the 5 most abundant bacterial OTUs, classified to (A, B) the lowest possible taxonomic level (see color key; o = order, f = family, g = genus, s = species) or (C, D) phylum. Panels A and C show data for individual samples of flour and beetles at various life stages; panels B and D show average relative abundance across replicates of each group (sample size is noted above each bar). In the key, numbers after each name distinguish OTUs with the same taxonomic classification (with 97% sequence identity). (E) Linear Discriminant (LD) analysis of the complete bacterial communities of flour and beetle samples; axis labels indicate % variation explained. For statistical analysis of full bacterial communities, see Table 1.
Fig 2
Fig 2. Flour and beetle microbiomes vary with flour type and bactericidal treatment.
(A, B, D, E, G, H) Stacked bar plots show the average relative abundance of the 5 most abundant bacterial OTUs in flour or beetle samples, across replicates in each group (sample size is noted above bars). OTUs were classified to (A, D, G) the lowest possible taxonomic level (see color key; o = order, f = family, g = genus, s = species) or (B, E, H) phylum level. (C, F, I) Principal Coordinate Analysis (PCoA) of the complete bacterial community of samples in panels A, D and G. Axis labels indicate % variation explained. Panels A–C show data for flour samples; panels D–F show data for beetle samples (isolated females reared in each flour); panels G–I show data for beetles reared in antibiotic treated wheat flour. In the colour keys, numbers after each name distinguish OTUs with the same taxonomic classification (with 97% sequence identity). Control = untreated flour, +UV = UV-treated flour, Amp = flour + ampicillin; Strep = flour + streptomycin, Kan = flour + kanamycin. For statistical analysis of full bacterial communities, see Table 1.
Fig 3
Fig 3. Effects of pupal surface sterilization and UV treatment of flour on fecundity, survival, and development rate.
Fecundity, offspring survival and offspring development rate in untreated (“control”) vs. UV-treated wheat and sorghum, measured for adults obtained from (A) untreated and (B) surface-sterilized pupae. Boxplots show median values per female (boxes indicate interquartile length (IQL); whiskers indicate 1.5x IQL), with overlaid raw data (each point indicates data for a single female). Asterisks indicate a significant difference between control and UV treatment, based on pairwise comparisons using a generalized linear model (for full analysis with ANOVA or GLM, see S1 Table). Sample sizes are indicated in parentheses above each box. The sample sizes for offspring survival are lower because some females did not lay any eggs. Similarly, sample sizes for development rate are reduced further because replicates with no surviving offspring were removed.
Fig 4
Fig 4. Effects of disrupting the flour microbiome on offspring survival and development rate, while controlling competition.
(A–B) Offspring survival and development rate in untreated (“control”) vs. UV-treated wheat and sorghum, measured for replicate groups of 20 eggs (n = 14 replicates for sorghum; n = 15 for wheat) obtained from (A) untreated and (B) surface-sterilized pupae. (C) Survival and development rate of isolated eggs provided with either 0.2 g flour (6 microplates, 576 eggs/treatment) or 0.4 g of flour (4 microplates, 384 eggs/treatment). In all panels, boxplots show median values (boxes indicate interquartile length (IQL); whiskers indicate 1.5x IQL), with overlaid raw data (each point indicates data for one replicate). Asterisks indicate a significant difference between control and UV treatment, based on pairwise comparisons using a generalized linear model.
Fig 5
Fig 5. Impact of exposure to UV-treated or antibiotic-treated flour on fecundity and offspring survival.
(A) Total fecundity (larvae+eggs) of females obtained from stocks and placed in untreated (“control”) vs. UV treated flour for 24 h, 48 h, 96 h or 7 d in wheat, or three novel resources (corn, finger millet, and sorghum). For the 24 h assay, sorghum was tested in an independent experimental block, with a separate wheat control; hence, it is shown as a separate figure. We included two independent experimental blocks for the 7d trial. (B) Offspring survival (average survival from eggs isolated in two 96-well plates per flour per treatment). (C) Total fecundity (larvae+eggs) of females obtained from stocks and placed in untreated (“control”) vs. antibiotic-treated flour (wheat or sorghum) for 48 hrs. In the first two panels, antibiotic concentrations are 0.005% w/w. Boxplots and raw data are as described in Fig 4; n = 25 females/treatment. Small black asterisks indicate a significant difference between control and treated resources; large coloured asterisks indicate a significant different between control for wheat vs. control for a novel resource. For statistical analysis, see S3 Table.
Fig 6
Fig 6. Females with varying fecundity have similar microbial communities.
Stacked bar plots show the average relative abundance of the 5 most abundant bacterial OTUs, (A) classified to the lowest possible taxonomic level (o = order, f = family, g = genus, s = species). Numbers after each name distinguish OTUs with the same taxonomic classification (with 97% sequence identity). (B) Phylum level.
Fig 7
Fig 7. Impact of flour microbes on cannibalism rate.
The fraction of eggs eaten by (A) isolated larvae (tested in two independent experimental blocks), and (B) single adult females in untreated (“control”) vs. UV treated wheat flour (n = 20 replicates/treatment). Eggs provided for cannibalism (20 eggs per replicate) were laid by females in flour with vs. without neutral red dye (which colors eggs pink). In panel B, eggs were either provided to the same female (“self eggs”) or a randomly chosen other female (“non-self eggs”). For statistical analysis, see S4 Table.
Fig 8
Fig 8. Impact of UV treatment on lifespan with and without infection.
(A) The fraction of surviving adults as a function of the number of days since eclosion, for individuals isolated in wells of 96 well plates from the egg stage (n = 96–192 eggs/treatment). Control individuals (i) were reared in untreated wheat flour throughout; as pupae, some of them were either transferred to fresh untreated wheat flour (ii) or UV-treated wheat flour (iii); and eggs were reared in UV-treated wheat flour without transfer as pupae. (B) A second experimental block with two of the treatments shown in panel A (i.e. without pupal transfer) (C) Survival of larvae reared in untreated (control) or UV-treated flour, after being injected with a sham infection (“SI”) or infection with a live pathogen (“Inf”) (n = 30/treatment). For statistical analysis, see S5 Table.

Similar articles

Cited by

References

    1. Lee W-J, Brey PT. How microbiomes influence metazoan development: Insights from history and Drosophila modeling of gut-microbe interactions. Annu Rev Cell Dev Biol. 2013;29: 571–592. 10.1146/annurev-cellbio-101512-122333 - DOI - PubMed
    1. Johnson KVA, Foster KR. Why does the microbiome affect behaviour? Nat Rev Micro. Springer US; 2018: 1–9. 10.1038/s41579-018-0014-3 - DOI - PubMed
    1. Moran NA, Ochman H, Hammer TJ. Evolutionary and Ecological Consequences of Gut Microbial Communities. Annu Rev Ecol Evol Syst. 2019;50: 451–475. 10.1146/annurev-ecolsys-110617-062453 - DOI - PMC - PubMed
    1. Mueller UG, Sachs JL. Engineering microbiomes to improve plant and animal health. Trends in Microbiology. Elsevier Ltd; 2015;: 1–12. 10.1016/j.tim.2015.07.009 - DOI - PubMed
    1. Colman DR, Toolson EC, Takacs-Vesbach CD. Do diet and taxonomy influence insect gut bacterial communities? Molecular Ecology. 2012;21: 5124–5137. 10.1111/j.1365-294X.2012.05752.x - DOI - PubMed

Publication types

MeSH terms

Substances