. 2020 Oct 1;183(1):197-210.e32.
doi: 10.1016/j.cell.2020.08.006.

Distinct Classes of Complex Structural Variation Uncovered across Thousands of Cancer Genome Graphs

Affiliations

Distinct Classes of Complex Structural Variation Uncovered across Thousands of Cancer Genome Graphs

Kevin Hadi et al. Cell. .

Abstract

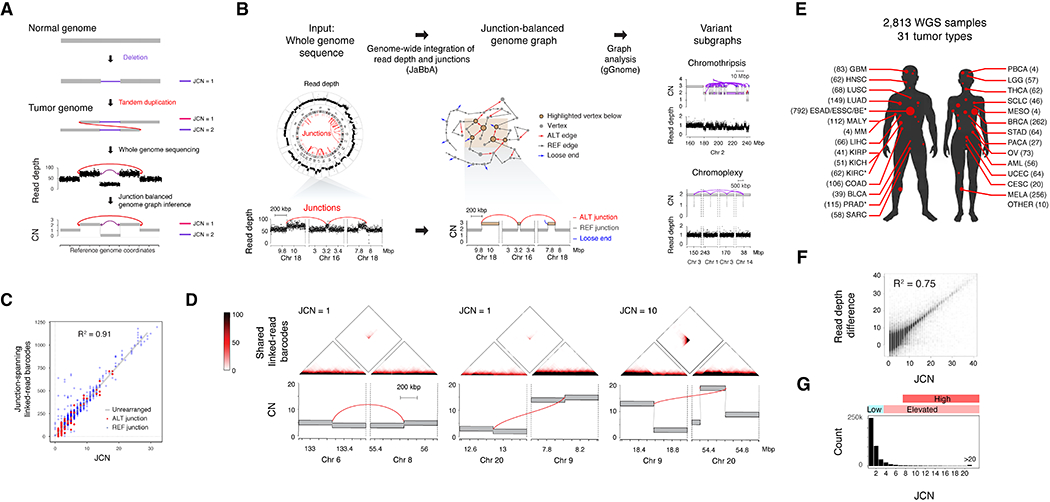
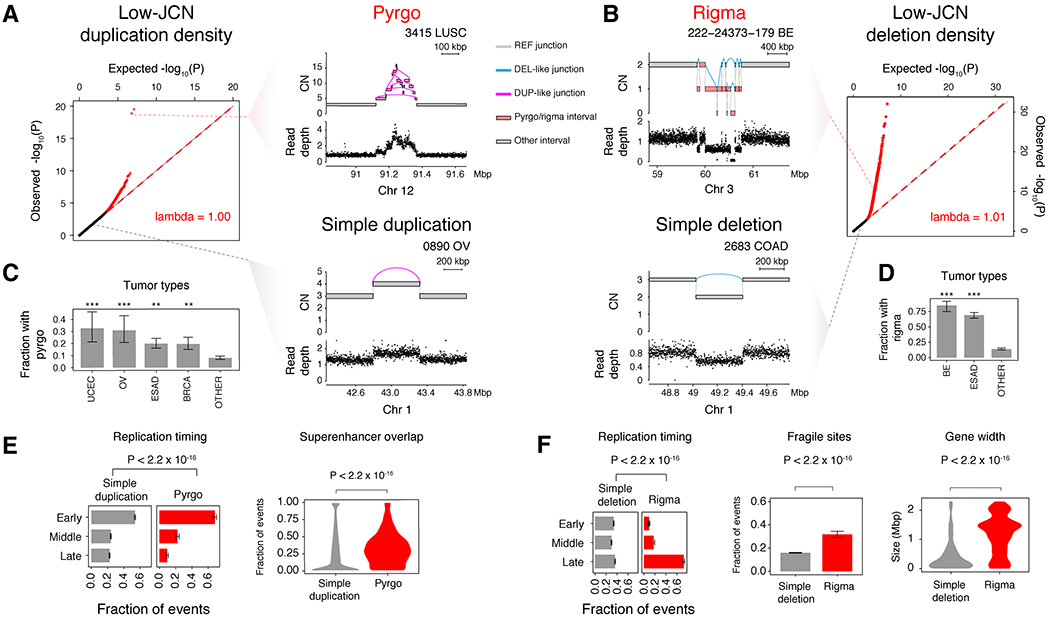
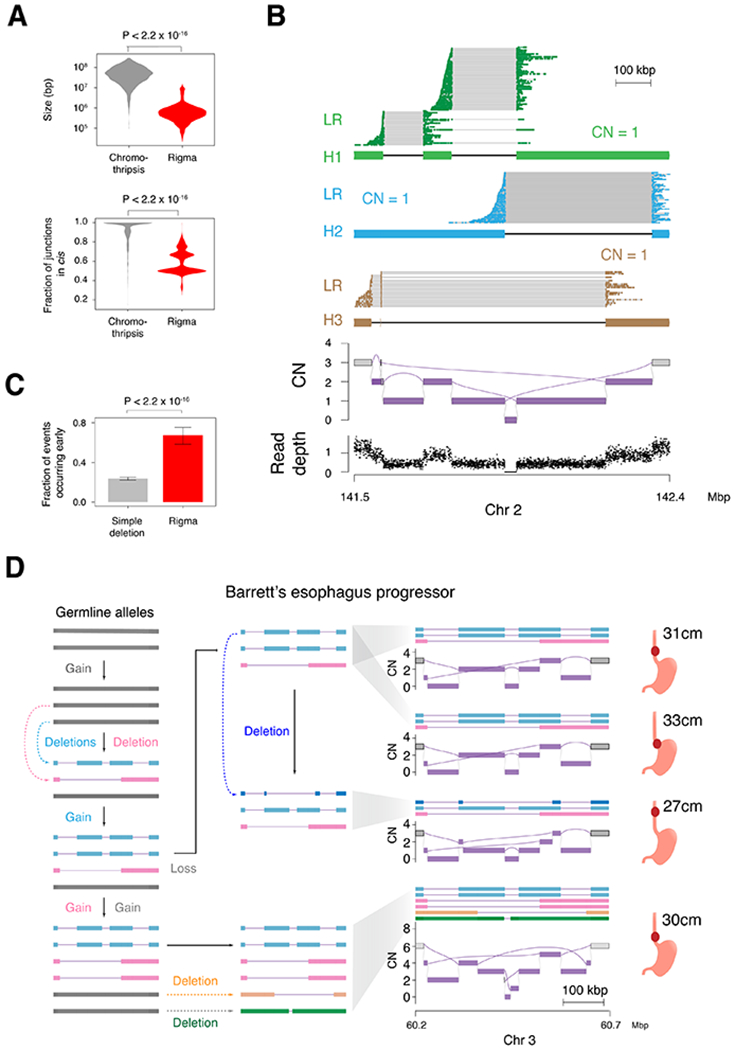
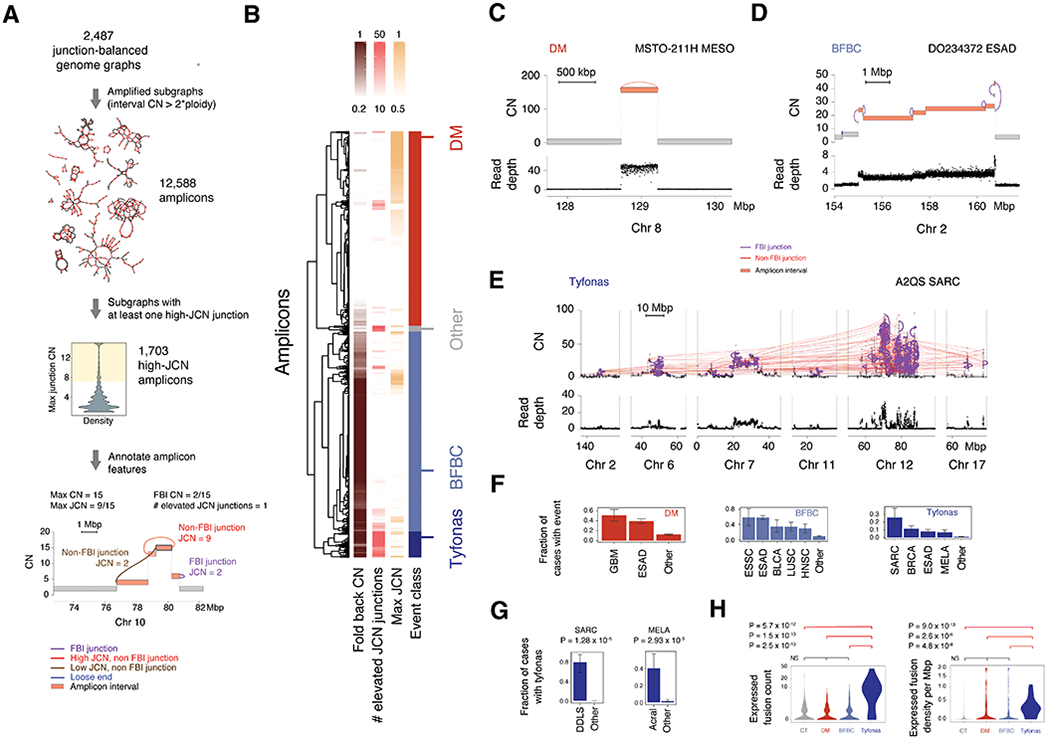
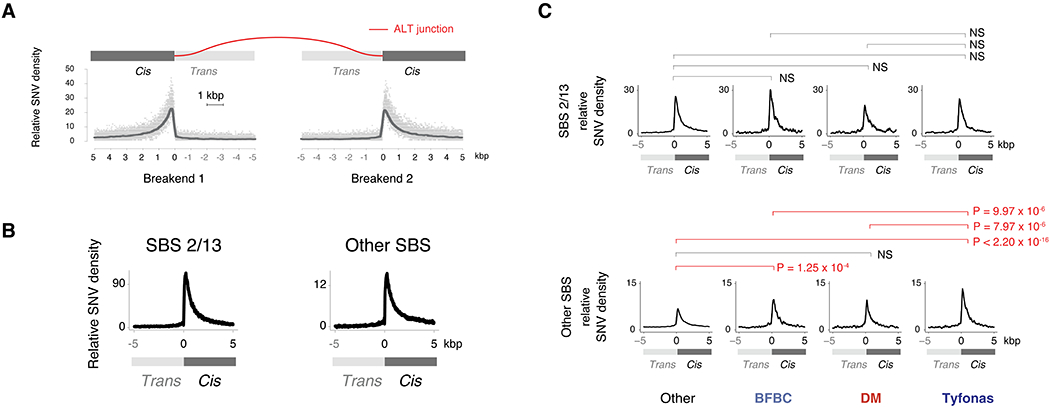
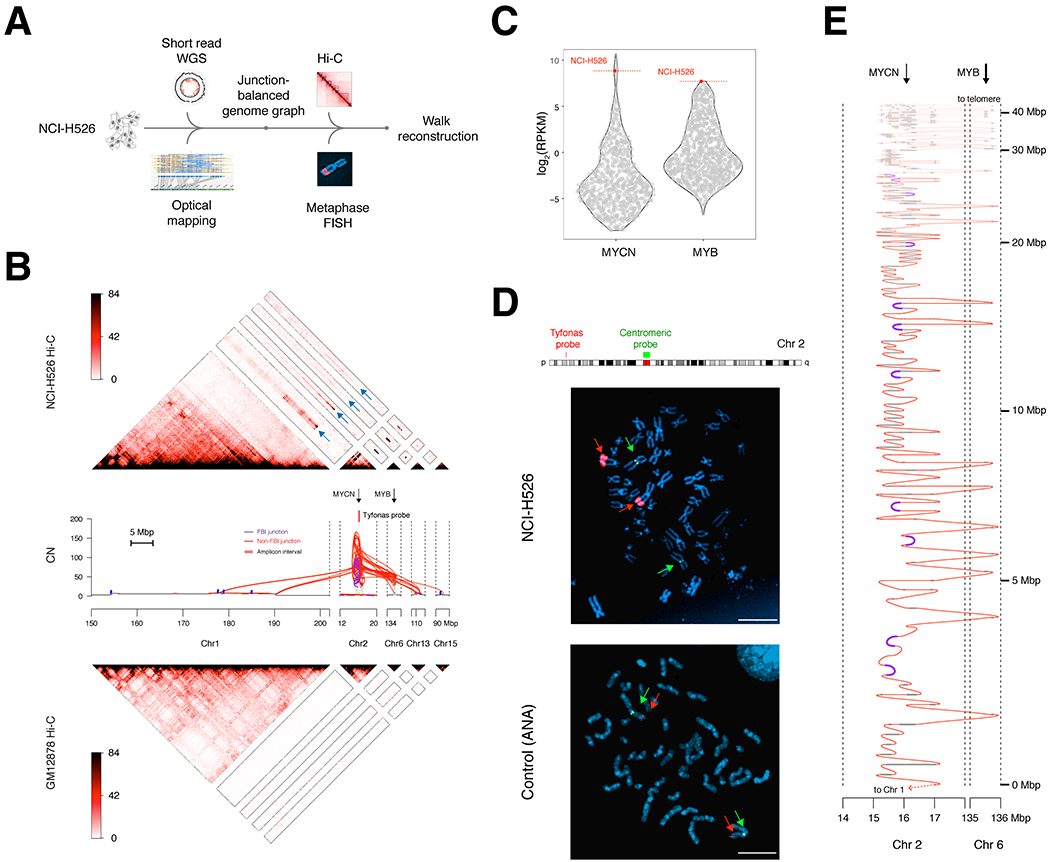
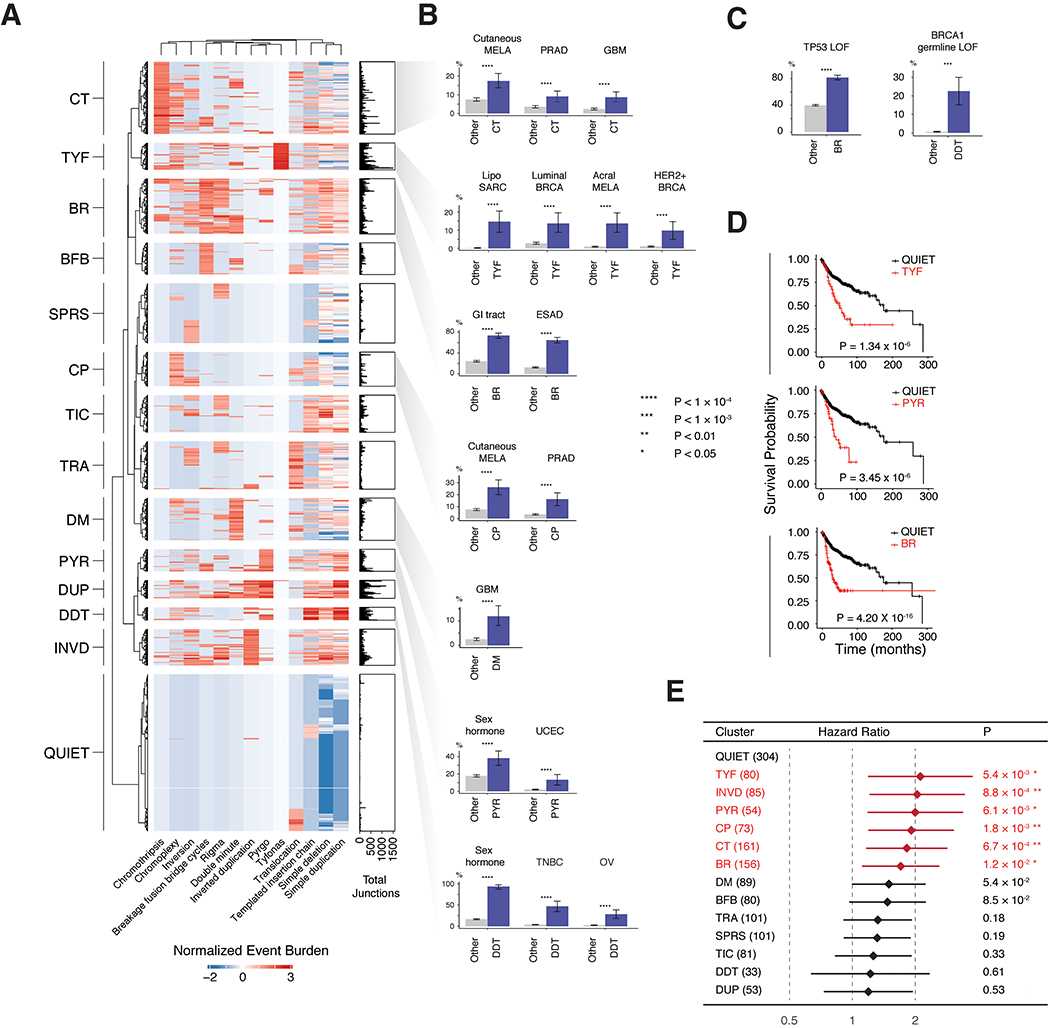
Cancer genomes often harbor hundreds of somatic DNA rearrangement junctions, many of which cannot be easily classified into simple (e.g., deletion) or complex (e.g., chromothripsis) structural variant classes. Applying a novel genome graph computational paradigm to analyze the topology of junction copy number (JCN) across 2,778 tumor whole-genome sequences, we uncovered three novel complex rearrangement phenomena: pyrgo, rigma, and tyfonas. Pyrgo are "towers" of low-JCN duplications associated with early-replicating regions, superenhancers, and breast or ovarian cancers. Rigma comprise "chasms" of low-JCN deletions enriched in late-replicating fragile sites and gastrointestinal carcinomas. Tyfonas are "typhoons" of high-JCN junctions and fold-back inversions associated with expressed protein-coding fusions, breakend hypermutation, and acral, but not cutaneous, melanomas. Clustering of tumors according to genome graph-derived features identified subgroups associated with DNA repair defects and poor prognosis.

Keywords: aneuploidy; cancer evolution; cancer genomics; chromothripsis; fragile sites; genome graphs; mutational processes; phasing; structural variation; superenhancers.


Conflict of interest statement

Declaration of Interests J.S.R.-F. reports receiving personal/consultancy fees from VolitionRx, Paige.AI, Goldman Sachs, REPARE Therapeutics, GRAIL, Ventana Medical Systems, Roche, Genentech, and InviCRO outside of the scope of the submitted work.

Figures

Figure 1.
Figure 1.. Junction-balanced genome graphs enable complex structural variant characterization
(A) Schematic of elevated junction copy number (JCN) from the duplication of an allele harboring a DEL-like junction, resulting in a characteristic read depth and junction pattern from which a junction-balanced genome graph can be reconstructed. (B) Junction balance analysis (JaBbA) integrates binned WGS read depth data and junctions to estimate JCN and generates coherent models of rearranged genome structure. The topology of JCN can be used to define complex SV events as variant subgraphs. (C) The coverage of junction-spanning 10X linked-read barcodes in HCC1954 (y axis) correlates highly with the JaBbA JCN estimate, obtained through the analysis of HCC1954 short-read WGS (x axis). (D) Top, heatmap of the number of 10X linked-read barcodes shared between each pair of 1 kbp genomic bins. Bottom, JaBbA genome graphs within 400 kbp of the featured junctions. (E) Tumor type sample counts across 2,778 genome graphs. See Table S1 for abbreviations. * marks datasets with multiple samples. (F) Correlation of the purity and ploidy corrected read depth difference vs. JaBbA-fitted JCN. (G) Histogram of JCNs and their associated categories in the cohort. See also Fig. S1 and Tables S1–S3
Figure 2.
Figure 2.. Rigma and pyrgo are novel patterns of clustered low copy rearrangements
(A) Quantile-quantile (Q-Q) plot of observed vs. expected −log10(P) quantiles obtained from a gamma-Poisson model of low-JCN DUP-like junction density across genomic bins (see STAR Methods). Red dots indicate sample-specific model outliers (FDR<0.5). Top right, an example of a pyrgo-associated outlier window with a high density of low-JCN DUP-like rearrangements within a sample. Bottom right, a non-outlier window containing a simple duplication event. (B) Right, Q-Q plot similar to (A), but low-JCN DEL-like junctions. Top left, an example of a rigma-associated outlier window containing a high density of low-JCN DEL-like junctions within a sample. Bottom left, a non-outlier window containing a simple deletion event. (C-D) Fraction of samples within tumor types that harbor pyrgo and rigma, respectively. Significantly enriched tumor types (compared to all others) are marked by asterisks (Fisher’s exact test). Significance levels: *** (P < 1 × 10⁻³), ** (P < 0.01), * (P < 0.05). (E-F) Association of events with replication timing (ordinal logistic regression), superenhancers (Hnisz et al., 2013) (logistic regression), known fragile sites (Kumar et al., 2019) (logistic regression), and gene width (Wilcoxon rank-sum test, Bonferroni corrected P-values < 0.05). Error bars on bar plots represent 95% confidence intervals on the Bernoulli trial parameter. See also Fig. S2
Figure 3.
Figure 3.. Rigma junctions evolve gradually and in trans
(A) Top, comparison of the total genomic territory covered by chromothripsis and rigma footprints. Bottom, the fraction of rearrangements that occur in cis (i.e. on the same predicted haplotype) when the longest possible contigs are inferred from the JaBbA graph. (B) Linked-read (LR) sequencing and local allelic deconvolution of a rigma found in a lung adenocarcinoma cell line (NCI-H838, see STAR Methods) demonstrates DEL-like junctions occur on separate haplotypes (i.e. in trans). (C) A comparison of the fraction of events that occur early (i.e. in multiple samples from the same patient) for simple deletions and rigma in the BE cohort, which has a median of 4 samples per patient across 80 patients. (D) Reconstruction of haplotypes across multiple samples from a single case in the BE WGS dataset. P-values obtained by Wilcoxon rank-sum test in (A) and Fisher’s exact test in (C). RD, read depth. Error bars on bar plots represent 95% confidence intervals on the Bernoulli trial parameter. See also Fig. S3
Figure 4.
Figure 4.. Analysis of amplified subgraphs identifies tyfonas
(A) Framework to identify features of complex amplicons through the analysis of amplified subgraphs. Each subgraph is annotated for three features: number of elevated (JCN>3) junctions, maximum JCN relative to the highest vertex CN in the subgraph, and total JCN of all fold back junctions relative to maximum JCN. (B) Hierarchical clustering of subgraph features reveals three stable clusters, representing distinct amplification SV classes: (C) double minutes, (D) BFBCs, and a new event pattern, (E) tyfonas. Top track in C-E is the JaBbA-estimated CN. Bottom, normalized read depth data. (F) Tumor types significantly enriched in each amplicon class. Significance determined by Fisher’s exact test comparing each tumor type against all others. All enrichments with FDR < 0.25 are shown. “Other” category denotes non-significant tumor types in the respective analysis. (G) Tyfonas enrichment in melanoma and sarcoma subtypes. (H) Enrichment of expressed protein-coding fusion transcripts by count (left) and density per Mbp of event territory (right) in tyfonas relative to other amplicon types and chromothripsis (Wilcoxon rank-sum test). Error bars on bar plots represent 95% confidence intervals on the Bernoulli trial parameter. See also Fig. S4
Figure 5.
Figure 5.. Tyfonas are enriched in breakend hypermutation outside of SBS 2/13
(A) Breakend-centered coordinate system to analyze mutational patterns near junctions. Top, the cis (+ coordinates) sides of the breakend (i.e. attached to the junction) have been fused across the rearrangement junction (red-colored line), while the trans (− coordinates) sides are disconnected from this derivative allele. Bottom, relative SNV density is the CN corrected and 101 bp smoothed density of SNVs at every base pair on this axis normalized to the average SNV density between −5 and 0 kbp. (B) Relative SNV density of SBS 2/13 and all other SBS associated contexts near breakends demonstrates a peak in the first 1 kbp on the cis side of the breakend. (C) Normalized breakend density for SBS 2/13 (top) and other SBS (bottom) SNVs for each of amplified event types. Enrichment P-values obtained from Wald test by gamma-Poisson regression (see STAR Methods). Significance determined by Bonferroni correction at a threshold of < 0.05. See also Fig. S5
Figure 6.
Figure 6.. Chromosomal integration of a MYB / MYCN -associated tyfonas in a small cell lung cancer cell line.
(A) Multi-platform profiling of a tyfonas in the small cell lung cancer cell line NCI-H526. (B) Top, heatmap of Hi-C in cell line NCI-H526 demonstrating MYCN and MYB co-amplification and contiguity with chromosome 1. Blue arrows on the Hi-C heatmap highlight the pixels supporting contiguity of tyfonas fragments with chromosome 1. Middle, JaBbA graph of the NCI-H526 tyfonas, where junction input was derived from short-read WGS and Bionano genomics optical mapping. The locations of MYCN, MYB, and the tyfonas BAC probes used for FISH experiments are shown. Bottom, Hi-C profiling of the normal cell line GM12878, obtained from (Rao et al., 2014). (C) Relative expression of MYCN and MYB across the Cancer Cell Line Encyclopedia (Ghandi et al., 2019b). (D) Metaphase FISH of NCI-H526 using a chromosome 2 probe targeting the center of the tyfonas near MYCN (red) and a second probe targeting the chromosome 2 centromere (green) (scale bars, 5 μm). (E) Candidate reconstruction of a linear allele spanning the tyfonas amplicon. The coordinates of the reconstructed allele (y axis) are shown using a nonlinear axis which begins at a junction adjacent to chromosome 1, and repeatedly threads between the MYCN and MYB genes, which are both amplified by the event. See also Fig. S6
Figure 7.
Figure 7.. Genome graph-derived features define biologically distinct patient groups
(A) Heatmap of normalized junction burden across 2,487 unique patients yields 14 clusters named after their most prevalent event types (CT, chromothripsis; TYF, tyfonas; BFB, BFBC; BR, BFBC and rigma; SPRS, sparse; CP, chromoplexy; TIC, templated insertion chain; TRA, translocations; DM, double minute; PYR, pyrgo; DUP, various duplications; DDT, deletion, duplication, and TIC; INVD, inverted duplications). (B-C) Significantly enriched tumor types within and outside of selected clusters. Blue (vs. gray) bars indicate the fraction of cases within (vs. outside of) the cluster that have the given feature, e.g. tumor type (B) or mutation (C). Significance in (B) and (C) determined by Bayesian logistic regression (Wald Test), with significant results (FDR < 0.1) for 742 hypotheses in (B) and 4,774 hypotheses in (C) (see STAR Methods). (D) Kaplan-Meier curves across BR, PYR and TYF clusters. P-values obtained via log-rank test. (E) Cox proportional hazard analysis correcting for age, tumor type, sex, metastasis status, tumor mutational burden, SV junction burden, and TP53 status demonstrating confidence bounds on the adjusted hazard ratio for 13 clusters relative to the QUIET cluster. Significantly associated variables (FDR < 0.1, 13 hypotheses) colored in red. Error bars on bar plots represent 95% confidence intervals on the Bernoulli trial parameter. See also Fig. S7 and Tables S3, S4

Similar articles

  • Chromothripsis during telomere crisis is independent of NHEJ, and consistent with a replicative origin.
    Cleal K, Jones RE, Grimstead JW, Hendrickson EA, Baird DM. Cleal K, et al. Genome Res. 2019 May;29(5):737-749. doi: 10.1101/gr.240705.118. Epub 2019 Mar 14. Genome Res. 2019. PMID: 30872351 Free PMC article.
  • Defining the diverse spectrum of inversions, complex structural variation, and chromothripsis in the morbid human genome.
    Collins RL, Brand H, Redin CE, Hanscom C, Antolik C, Stone MR, Glessner JT, Mason T, Pregno G, Dorrani N, Mandrile G, Giachino D, Perrin D, Walsh C, Cipicchio M, Costello M, Stortchevoi A, An JY, Currall BB, Seabra CM, Ragavendran A, Margolin L, Martinez-Agosto JA, Lucente D, Levy B, Sanders SJ, Wapner RJ, Quintero-Rivera F, Kloosterman W, Talkowski ME. Collins RL, et al. Genome Biol. 2017 Mar 6;18(1):36. doi: 10.1186/s13059-017-1158-6. Genome Biol. 2017. PMID: 28260531 Free PMC article.
  • Genomic Hallmarks and Structural Variation in Metastatic Prostate Cancer.
    Quigley DA, Dang HX, Zhao SG, Lloyd P, Aggarwal R, Alumkal JJ, Foye A, Kothari V, Perry MD, Bailey AM, Playdle D, Barnard TJ, Zhang L, Zhang J, Youngren JF, Cieslik MP, Parolia A, Beer TM, Thomas G, Chi KN, Gleave M, Lack NA, Zoubeidi A, Reiter RE, Rettig MB, Witte O, Ryan CJ, Fong L, Kim W, Friedlander T, Chou J, Li H, Das R, Li H, Moussavi-Baygi R, Goodarzi H, Gilbert LA, Lara PN Jr, Evans CP, Goldstein TC, Stuart JM, Tomlins SA, Spratt DE, Cheetham RK, Cheng DT, Farh K, Gehring JS, Hakenberg J, Liao A, Febbo PG, Shon J, Sickler B, Batzoglou S, Knudsen KE, He HH, Huang J, Wyatt AW, Dehm SM, Ashworth A, Chinnaiyan AM, Maher CA, Small EJ, Feng FY. Quigley DA, et al. Cell. 2018 Jul 26;174(3):758-769.e9. doi: 10.1016/j.cell.2018.06.039. Epub 2018 Jul 19. Cell. 2018. PMID: 30033370 Free PMC article.
  • Mechanistic origins of diverse genome rearrangements in cancer.
    Dahiya R, Hu Q, Ly P. Dahiya R, et al. Semin Cell Dev Biol. 2022 Mar;123:100-109. doi: 10.1016/j.semcdb.2021.03.003. Epub 2021 Apr 3. Semin Cell Dev Biol. 2022. PMID: 33824062 Free PMC article. Review.
  • Child development and structural variation in the human genome.
    Zhang Y, Haraksingh R, Grubert F, Abyzov A, Gerstein M, Weissman S, Urban AE. Zhang Y, et al. Child Dev. 2013 Jan-Feb;84(1):34-48. doi: 10.1111/cdev.12051. Epub 2013 Jan 13. Child Dev. 2013. PMID: 23311762 Review.

Cited by

References

    1. Alexandrov LB, Kim J, Haradhvala NJ, Huang MN, Tian Ng AW, Wu Y, Boot A, Covington KR, Gordenin DA, Bergstrom EN, Islam SMA, Lopez-Bigas N, Klimczak LJ, McPherson JR, Morganella S, Sabarinathan R, Wheeler DA, Mustonen V, PCAWG Mutational Signatures Working Group, Getz G, Rozen SG, Stratton MR. and PCAWG Consortium (2020). The repertoire of mutational signatures in human cancer. Nature 578, 94–101. - PMC - PubMed
    1. Anantharaman T and Mishra B (2001). False positives in genomic map assembly and sequence validation. In International Workshop on Algorithms in Bioinformatics 27–40, Springer.
    1. Baca S, Prandi D, Lawrence M, Mosquera J, Romanel A, Drier Y, Park K, Kitabayashi N, MacDonald T, Ghandi M, Van Allen E, Kryukov G, Sboner A, Theurillat J-P, Soong T, Nickerson E, Auclair D, Tewari A, Beltran H, Onofrio R, Boysen G, Guiducci C, Barbieri C, Cibulskis K, Sivachenko A, Carter S, Saksena G, Voet D, Ramos A, Winckler W, Cipicchio M, Ardlie K, Kantoff P, Berger M, Gabriel S, Golub T, Meyerson M, Lander E, Elemento O , Getz G, Demichelis F, Rubin M and Garraway L (2013). Punctuated Evolution of Prostate Cancer Genomes. Cell. 153, 666–677. - PMC - PubMed
    1. Barretina J, Caponigro G, Stransky N, Venkatesan K, Margolin AA, Kim S, Wilson CJ, Lehár J, Kryukov GV, Sonkin D, Reddy A, Liu M, Murray L, Berger MF, Monahan JE, Morais P, Meltzer J, Korejwa A, Jané-Valbuena J, Mapa FA, Thibault J, Bric-Furlong E, Raman P, Shipway A, Engels IH, Cheng J, Yu GK, Yu J, Aspesi P Jr , de Silva M, Jagtap K, Jones MD, Wang L, Hatton C, Palescandolo E, Gupta S, Mahan S, Sougnez C, Onofrio RC, Liefeld T, MacConaill L, Winckler W, Reich M, Li N, Mesirov JP, Gabriel SB, Getz G, Ardlie K, Chan V, Myer VE, Weber BL, Porter J, Warmuth M, Finan P, Harris JL, Meyerson M, Golub TR, Morrissey MP, Sellers WR, Schlegel R and Garraway LA. (2012). The Cancer Cell Line Encyclopedia enables predictive modelling of anticancer drug sensitivity. Nature 483, 603–607. - PMC - PubMed
    1. Beroukhim R, Mermel CH, Porter D, Wei G, Raychaudhuri S, Donovan J, Barretina J, Boehm JS, Dobson J, Urashima M, Henry KTM, Pinchback RM, Ligon AH, Cho Y-J, Haery L, Greulich H, Reich M, Winckler W, Lawrence MS, Weir BA, Tanaka KE, Chiang DY, Bass AJ, Loo A, Hoffman C, Prensner J, Liefeld T, Gao Q , Yecies D, Signoretti S, Maher E, Kaye FJ, Sasaki H, Tepper JE, Fletcher JA, Tabernero J, Baselga J, Tsao M-S, Demichelis F, Rubin MA, Janne PA, Daly MJ, Nucera C, Levine RL, Ebert BL, Gabriel S, Rustgi AK, Antonescu CR, Ladanyi M, Letai A, Garraway LA, Loda M, Beer DG, True LD, Okamoto A, Pomeroy SL, Singer S, Golub TR, Lander ES, Getz G, Sellers WR and Meyerson M (2010). The landscape of somatic copy-number alteration across human cancers. Nature 463, 899. - PMC - PubMed

Publication types