. 2020 Dec 1:169:112643.
doi: 10.1016/j.bios.2020.112643. Epub 2020 Sep 21.

Array-based analysis of SARS-CoV-2, other coronaviruses, and influenza antibodies in convalescent COVID-19 patients

Affiliations

Array-based analysis of SARS-CoV-2, other coronaviruses, and influenza antibodies in convalescent COVID-19 patients

Daniel J Steiner et al. Biosens Bioelectron. .

Abstract

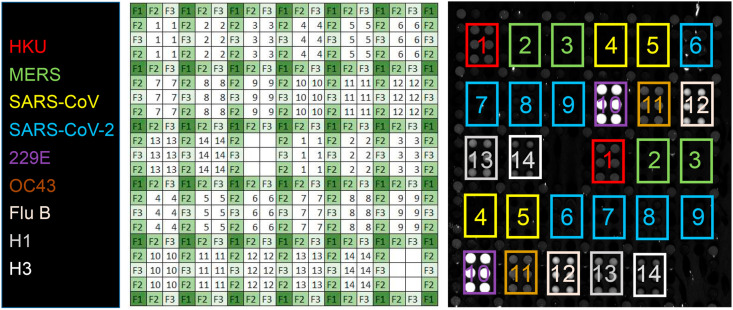
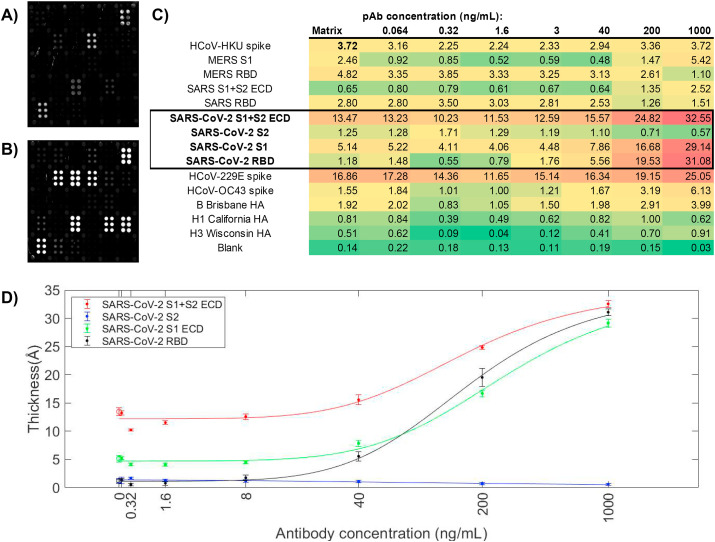
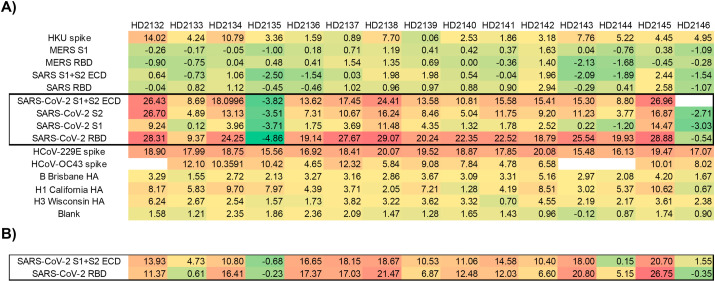
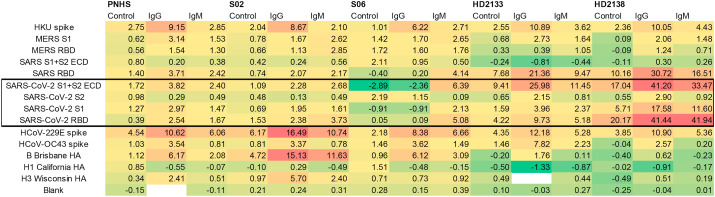
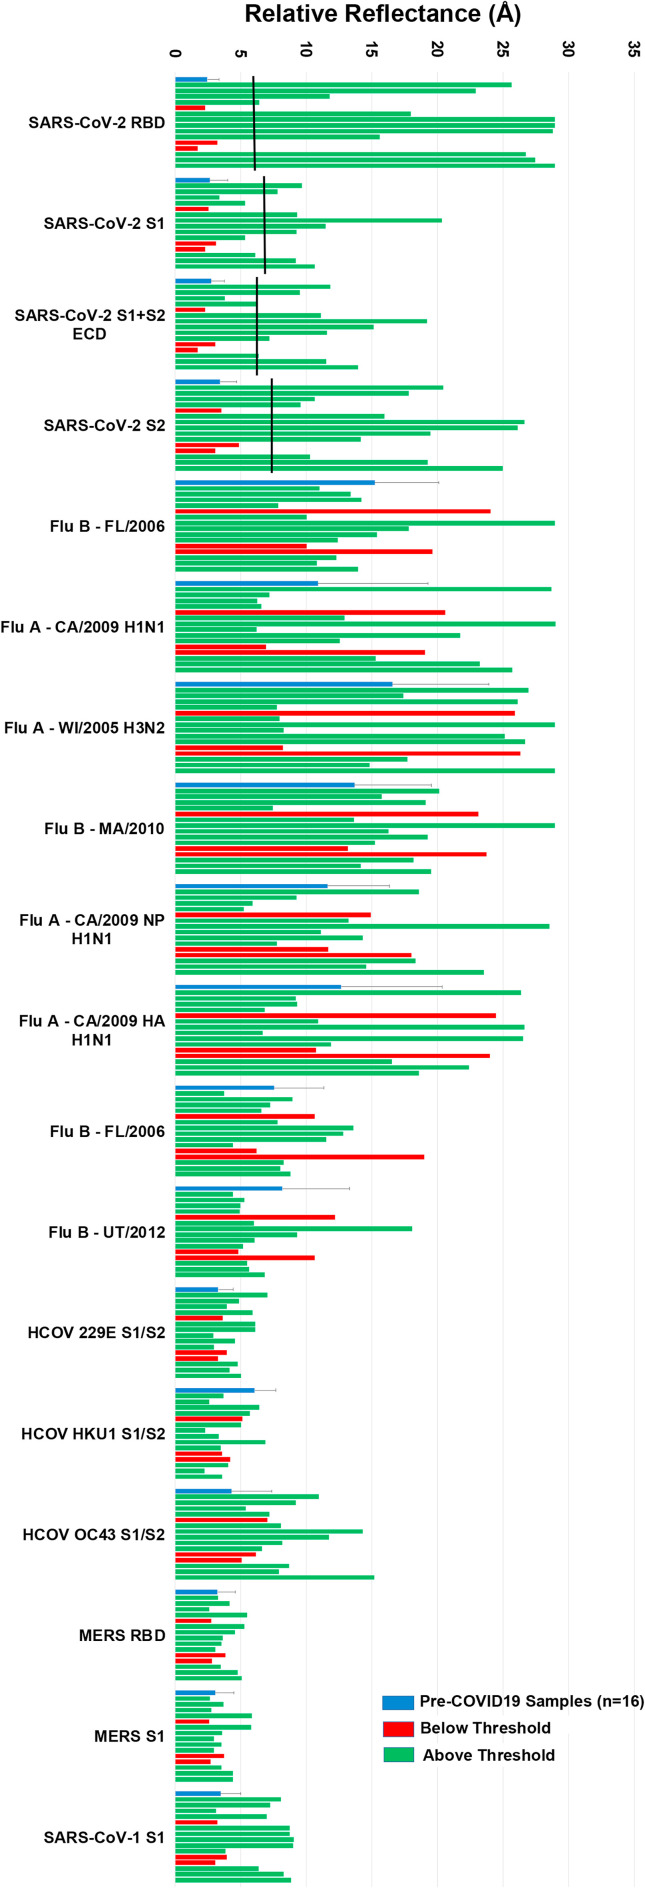
Detection of antibodies to upper respiratory pathogens is critical to surveillance, assessment of the immune status of individuals, vaccine development, and basic biology. The urgent need for antibody detection tools has proven particularly acute in the COVID-19 era. We report a multiplex label-free antigen microarray on the Arrayed Imaging Reflectometry (AIR) platform for detection of antibodies to SARS-CoV-2, SARS-CoV-1, MERS, three circulating coronavirus strains (HKU1, 229E, OC43) and three strains of influenza. We find that the array is readily able to distinguish uninfected from convalescent COVID-19 subjects, and provides quantitative information about total Ig, as well as IgG- and IgM-specific responses.

Keywords: Antigen microarray; Coronavirus; Influenza virus; Label-free biosensor; SARS-CoV-2.


Conflict of interest statement

B.L.M. is a shareholder of and consultant for Adarza BioSystems, Inc., and is a named inventor on several patents owned by the University of Rochester and licensed to Adarza BioSystems, Inc. D. J. T. is a named inventor on a patent owned by the University of Rochester and licensed to Adarza BioSystems, Inc.

Figures

Fig. 1
Fig. 1
AIR assay for antibodies to respiratory viruses. For each antigen, six replicate spots are printed in two different locations on the chip. Each group of six spots is surrounded by negative control reference spots (anti-FITC). Blank (background) areas are included as additional negative controls. Key: 1: human coronavirus (HKU isolate) spike glycoprotein, aa 1–760; 2: MERS-CoV spike glycoprotein, S1 domain; 3: MERS-CoV spike glycoprotein, receptor binding domain (RBD); 4: SARS-CoV spike glycoprotein, S1 domain; 5: SARS-CoV spike glycoprotein, RBD; 6: SARS-CoV-2 spike glycoprotein, S1+S2 ECD; 7: SARS-CoV-2 spike glycoprotein, S2 ECD; 8: SARS-CoV-2 spike glycoprotein, S1 domain; 9: SARS-CoV-2 spike glycoprotein, RBD; 10: human coronavirus (HCoV-229E isolate) spike glycoprotein, S1+S2 ECD; 11: human coronavirus (HCoV-OC43 isolate) spike glycoprotein, S1+S2 ECD; 12: influenza B/Brisbane/2008 hemagglutinin; 13: influenza A/California/2009 (H1N1) hemagglutinin; 14: influenza A/Wisconsin/2005 (H3N2) influenza. F1, F2, and F3 are derived from spotting three different dilutions of anti-FITC. The image at right is a representative array exposed to Pooled Normal Human Serum (PNHS) at a 1:4 dilution.
Fig. 2
Fig. 2
Response of a commercial anti-SARS-CoV-2 rabbit polyclonal antibody (pAb) on the array. (A) Array exposed 20% FBS + 10% PNHS; (B) Array exposed to 1 μg/mL anti-SARS-CoV-2 pAb in 20% FBS + 10% PNHS. Strong responses to SARS-CoV-2 S1+S2 ECD, S1, and RBD are observed, as well as smaller cross-reactive responses to HCoV-229E, HCoV-OC43, and MERS spike proteins; (C) quantitative data for the titration. Concentrations of pAb are provided at the top of each column in ng/mL; response values at each concentration for each antigen are provided in Ångstroms of build. (D) Titration curves for the four SARS-CoV-2 antigens with standard deviation of replicate probe spots at each concentration.
Fig. 3
Fig. 3
Representative AIR array images of (A) 5% FBS; (B) 10% PNHS; (C) a negative single-donor sample, and (D) one convalescent serum sample. Strong responses to SARS-CoV-2 antigens are readily observed in (D), but not in (A), (B), or (C), while responses to circulating coronaviruses HKU, OC43, and 229E are observed in (B), (C), and (D). In each case, samples were diluted 1:20 in Adarza diluent, and incubated with the arrays overnight at 4 °C. See Fig. 1 for key to the array. All arrays in this figure were imaged at an exposure of 100 ms.
Fig. 4
Fig. 4
AIR results from convalescent COVID-19-positive subjects. Empty cells indicate unreadable spots. (A) Each sample was diluted 1:5 in Adarza diluent, and incubated with the array overnight at 4 °C. (B) Selected antigen results for samples run at 1:20 dilution, and incubated with the array overnight at 4 °C. All values reported are in Ångstroms of build relative to an FBS control.
Fig. 5
Fig. 5
IgG-specific ELISA results for convalescent COVID-19 subjects. All values are in μg/mL.
Fig. 6
Fig. 6
Determination of class-specific responses for a subset of COVID-19-negative (S02, S06) and convalescent COVID-19-positive (HD2133, HD2138) subjects. “Control” indicates substrates exposed to 20% FBS alone after exposure to the indicated serum sample. All values reported are in Ångstroms of build relative to an FBS control.
Fig. 7
Fig. 7
Results from the Adarza Ziva system for pre-COVID-19 serum samples and single-donor samples from convalescent COVID-19 (PCR-positive) subjects. Pre-COVID-19 single-donor results were averaged (blue bars). Black bars indicate threshold positive values, calculated as two standard deviations above the average negative (pre-COVID-19) signal. Red bars indicate PCR + individuals yielding signals below the threshold on all SARS-CoV-2 antigens, while green bars indicate signals from single-donor convalescent COVID-19 samples with at least one SARS-CoV-2 antigen response above threshold. (For interpretation of the references to color in this figure legend, the reader is referred to the Web version of this article.)

References

    1. Amanat F., Stadlbauer D., Strohmeier S., Nguyen T.H.O., Chromikova V., McMahon M., Jiang K., Arunkumar G.A., Jurczyszak D., Polanco J., Bermudez-Gonzalez M., Kleiner G., Aydillo T., Miorin L., Fierer D.S., Lugo L.A., Kojic E.M., Stoever J., Liu S.T.H., Cunningham-Rundles C., Feigner P.L., Moran T., Garcia-Sastre A., Caplivski D., Cheng A.C., Kedzierska K., Vapalahti O., Hepojoki J.M., Simon V., Krammer F. A serological assay to detect SARS-CoV-2 seroconversion in humans. Nat. Med. 2020;1–4 - PMC - PubMed
    1. Bucukovski J., Latorre-Margalef N., Stallknecht D.E., Miller B.L. A multiplex label-free approach to avian influenza surveillance and serology. PloS One. 2015;10 - PMC - PubMed
    1. Grifoni A., Weiskopf D., Ramirez S.I., Mateus J., Dan J.M., Moderbacher C.R., Rawlings S.A., Sutherland A., Premkumar L., Jadi R.S., Marrama D., de Silva A.M., Frazier A., Carlin A., Greenbaum J.A., Peters B., Krammer F., Smith D.M., Crotty S., Sette A. Targets of T cell responses to SARS-CoV-2 coronavirus in humans with COVID-19 disease and unexposed individuals. Cell. 2020 doi: 10.1016/j.cell.2020.05.015. (in press) - DOI - PMC - PubMed
    1. Guo L., Ren L., Yang S., Xiao M., Chang D., Yang F., Dela Cruz C.S., Wang Y., Wu C., Xiao Y., Zhang L., Han L., Dang S., Xu Y., Yang Q.-W., Xu S.-Y., Zhu H.-D., Xu Y.-C., Jin Q., Sharma L., Wang L., Wang J. Profiling early humoral response to diagnose novel coronavirus disease (COVID-19) Clin. Infect. Dis. 2020 doi: 10.1093/cid/ciaa310. (in press) - DOI - PMC - PubMed
    1. Holstein C.A., Griffin M., Hong J., Sampson P.D. Statistical method for determining and comparing limits of detection of bioassays. Anal. Chem. 2015;87:9795–9801. - PubMed

Publication types

MeSH terms

Substances