. 2020 Nov 1:216:108321.
doi: 10.1016/j.drugalcdep.2020.108321. Epub 2020 Sep 25.

Opioid-related overdose mortality in the era of fentanyl: Monitoring a shifting epidemic by person, place, and time

Affiliations

Opioid-related overdose mortality in the era of fentanyl: Monitoring a shifting epidemic by person, place, and time

Keri N Althoff et al. Drug Alcohol Depend. .

Abstract

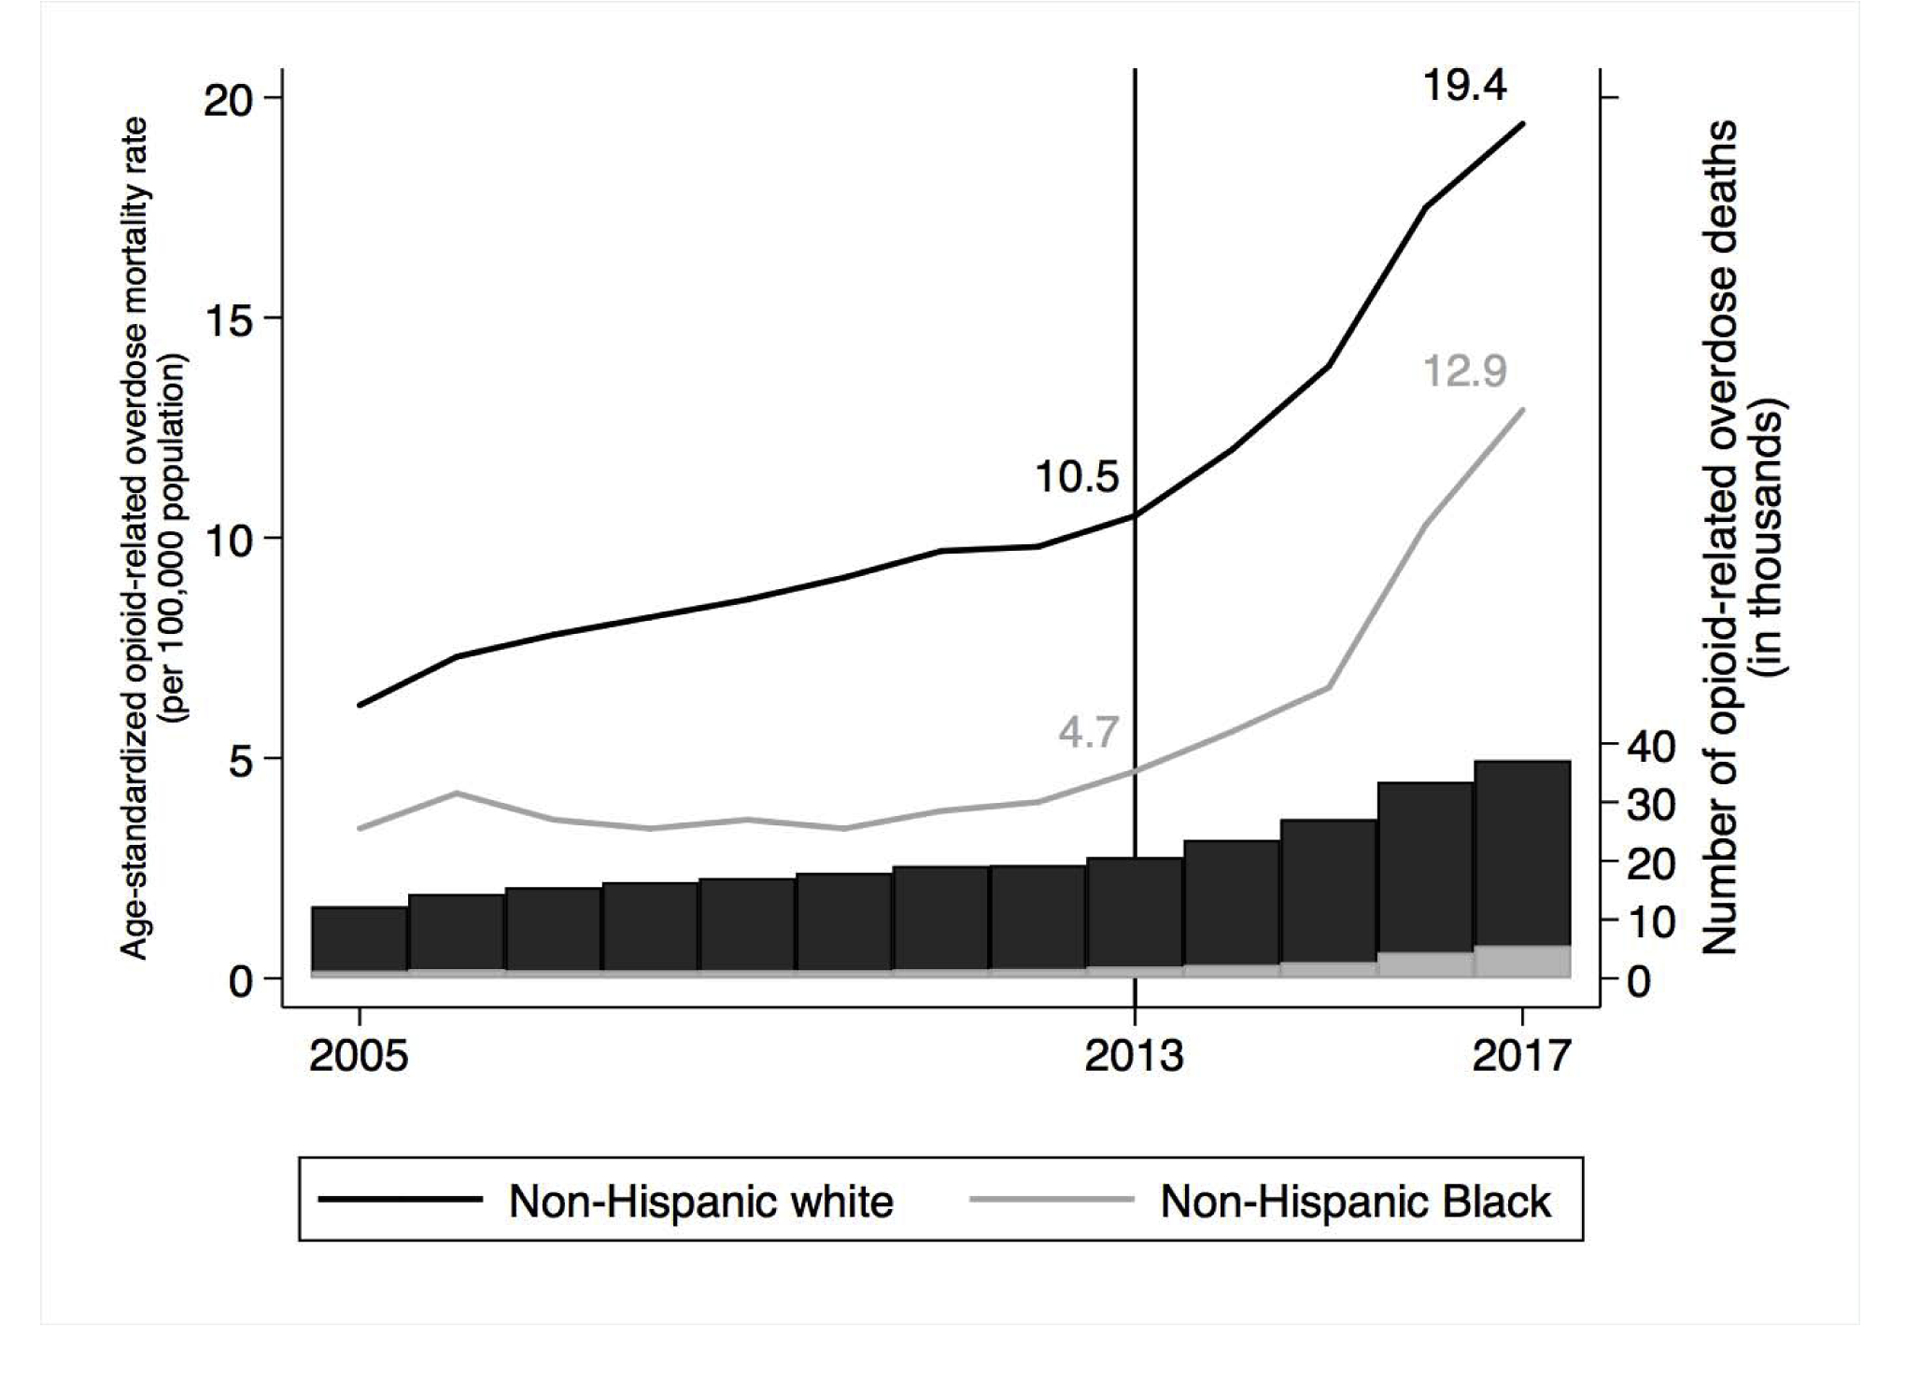
Background: With the emergence of illicit fentanyl, fentanyl-involved overdose rates increased from 2013 to 2017 in the United States (US). We describe US trends in opioid-related overdose mortality rates by race, age, urbanicity, and opioid type before and after the emergence of fentanyl.

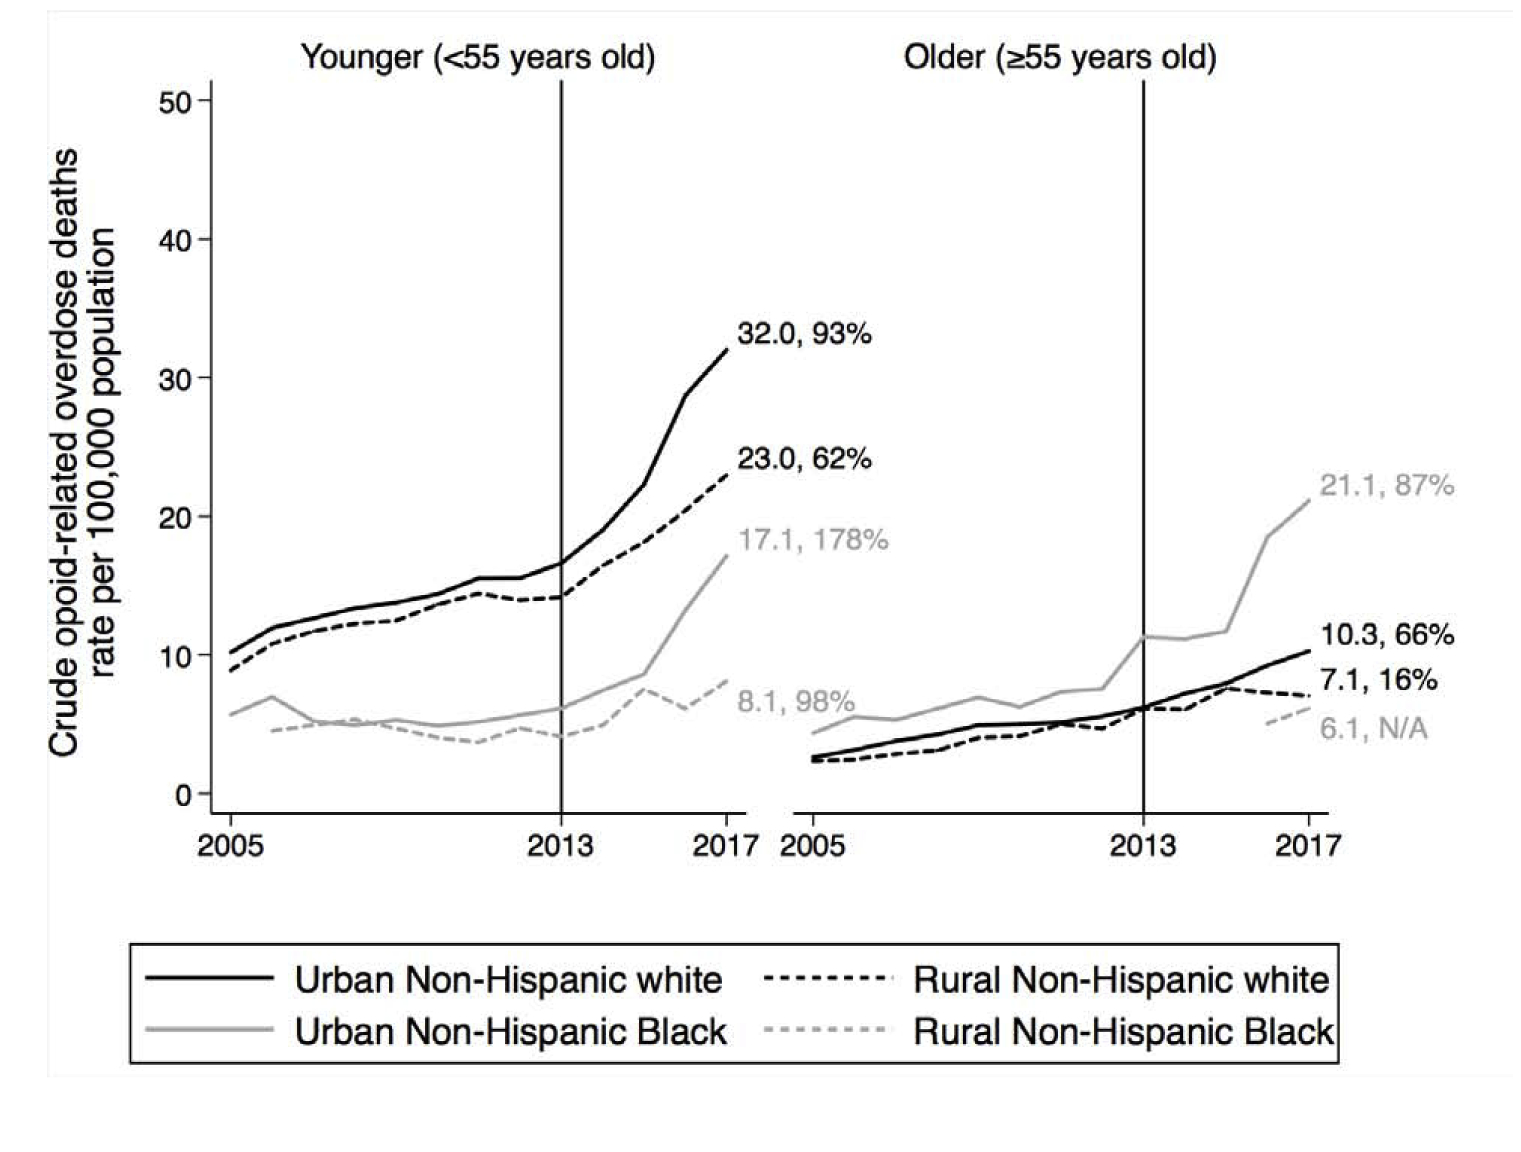
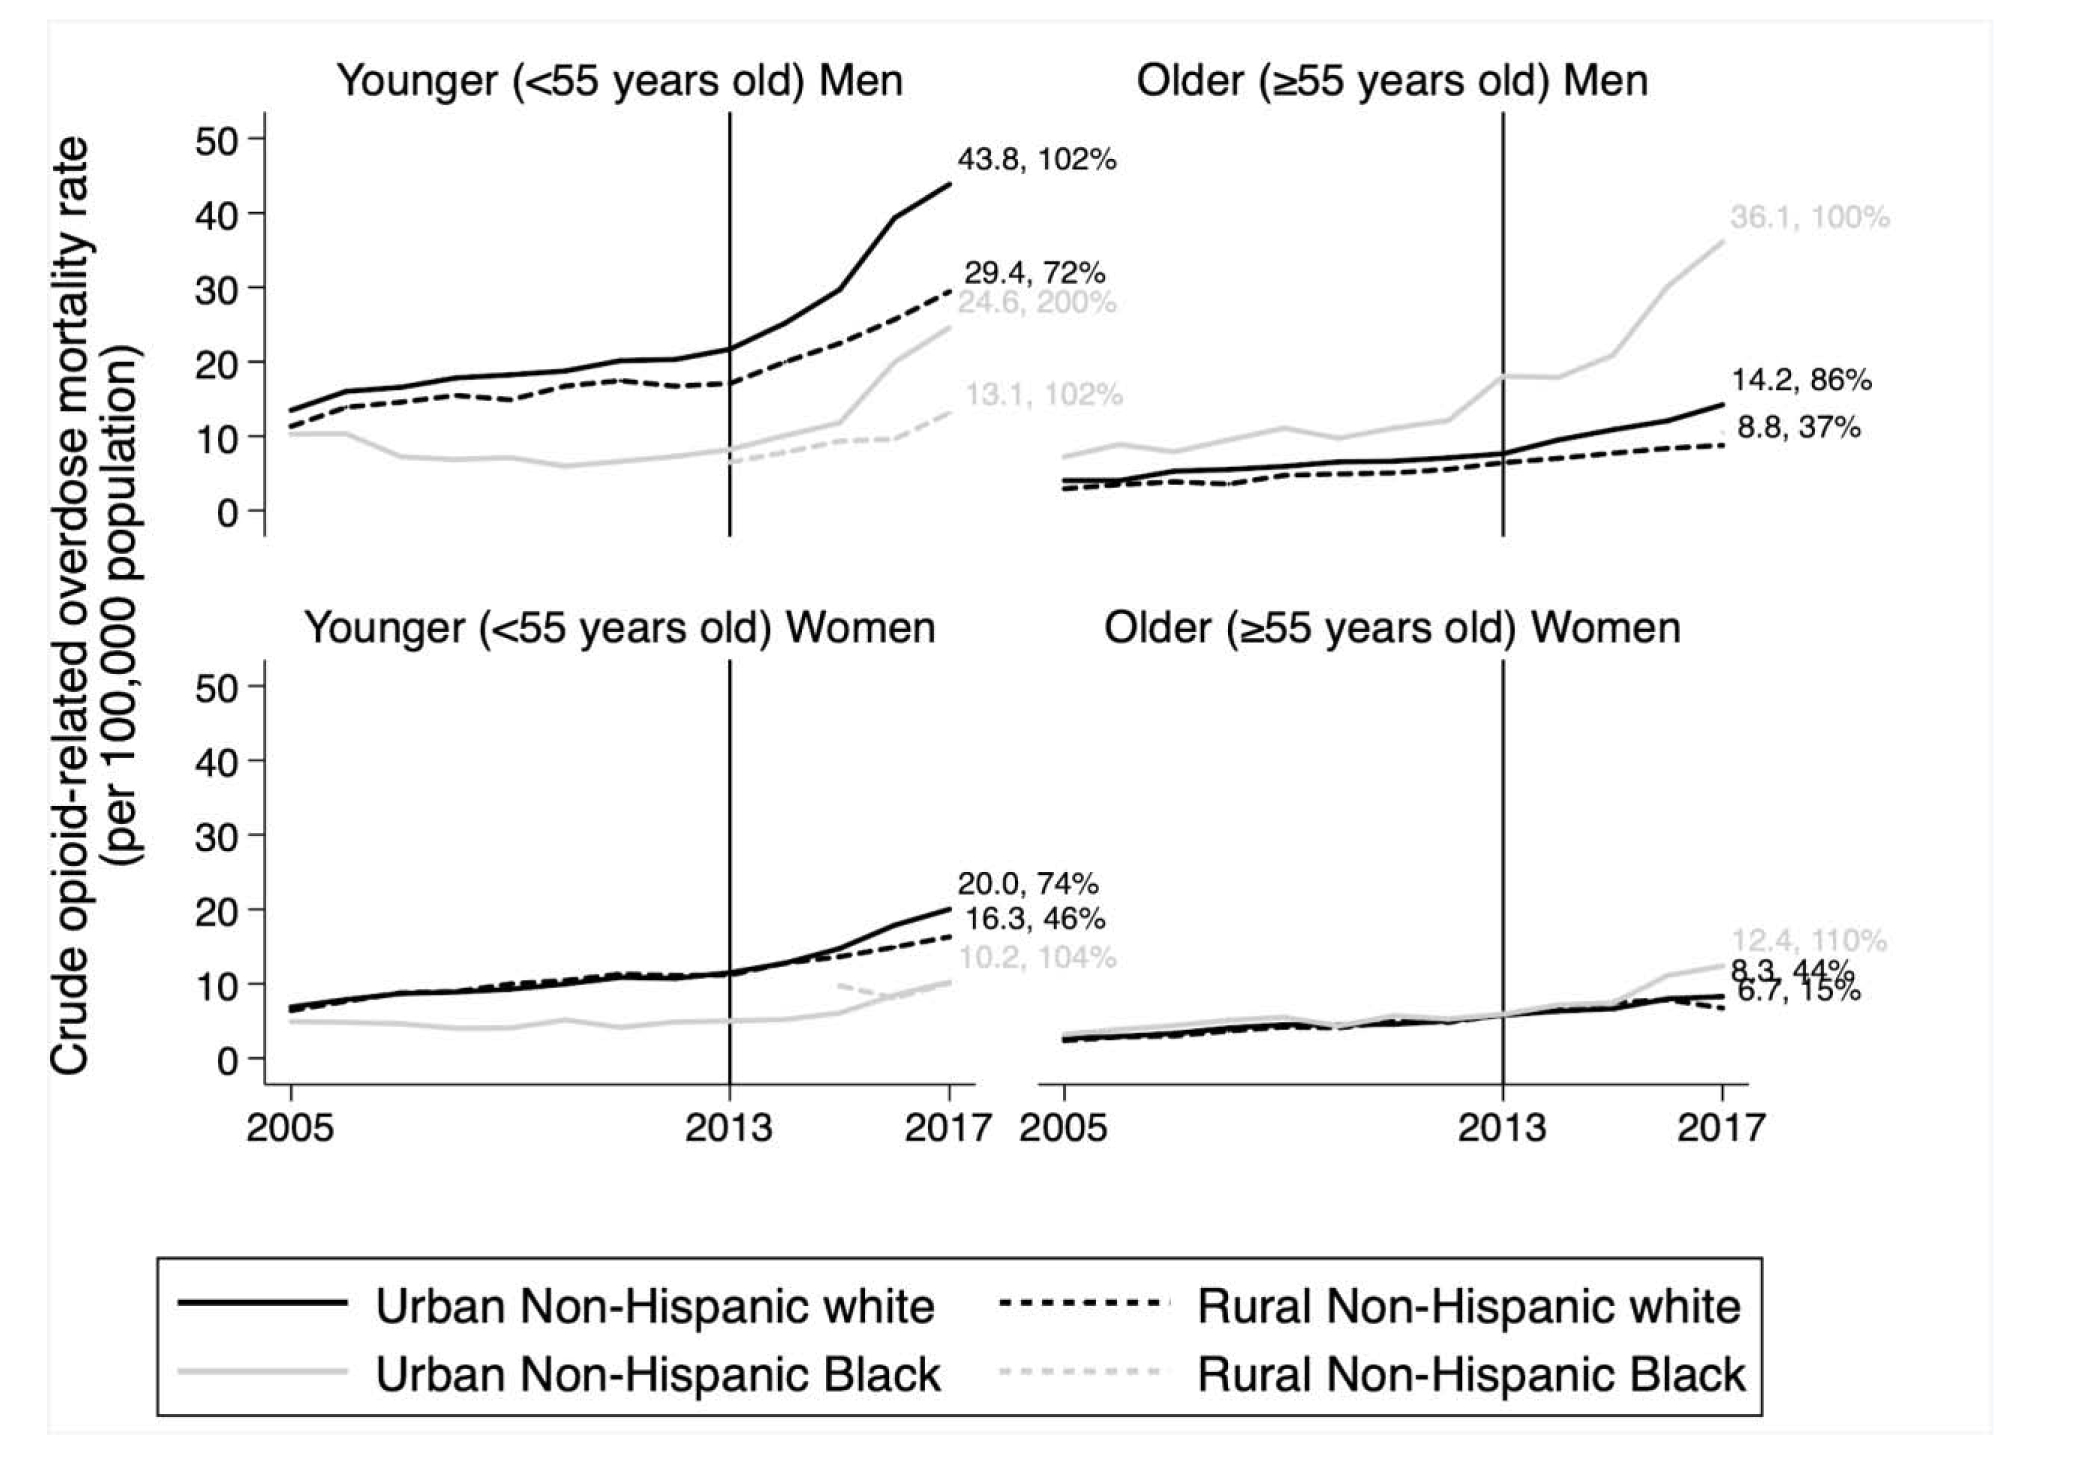
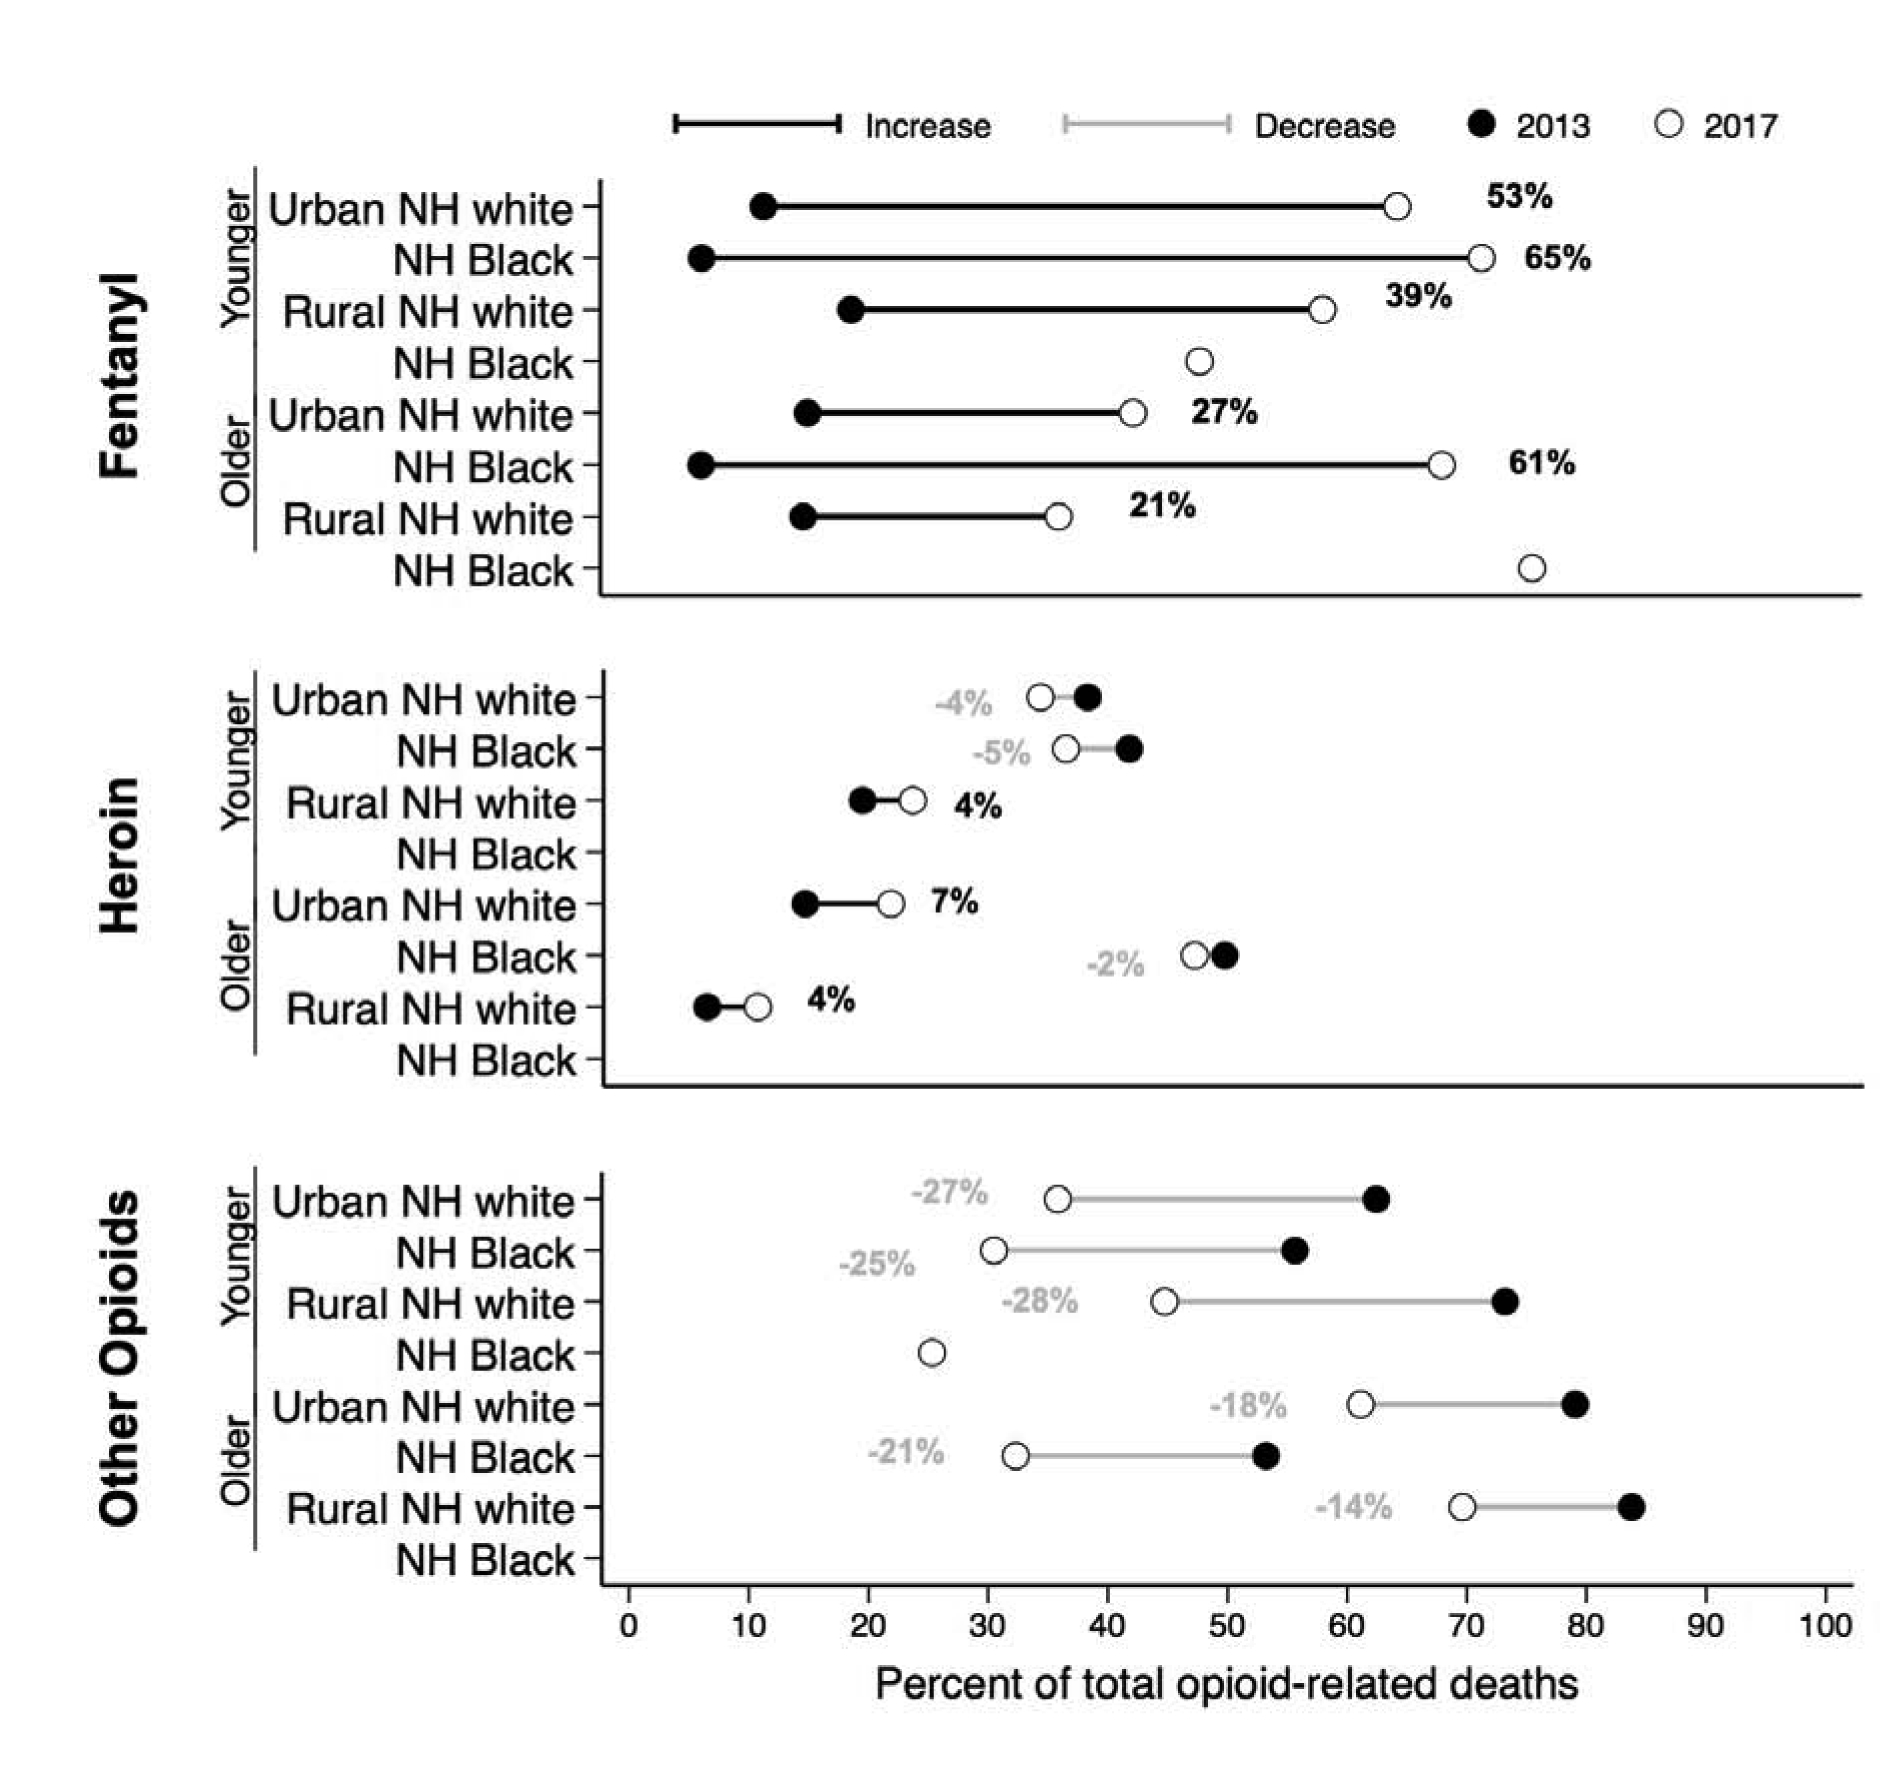
Methods: Using the Centers for Disease Control and Prevention's WONDER database, we estimated crude and age-standardized opioid-related overdose mortality rates at the intersections of race (non-Hispanic [NH] Black and white), age (<55 and ≥55 years), sex (male and female) and urbanicity (urban and rural residence) from 2005 to 2017. We compare relative changes in mortality from 2013 to 17, and describe changes in the contributions of fentanyl, heroin, and other opioids to opioid-related overdose mortality.

Results: From 2013 to 2017, the overall opioid overdose mortality rate was consistently higher in NH white Americans, however, the rate increase was greater among NH Black (174 %) compared to NH white (85 %) Americans. The steepest increases occurred in the overdose rates between 2013 and 2017 among younger (aged <55 years) urban NH Black Americans (178 % increase). Among older (≥55 years) adults, only urban NH Black Americans had an increase in overdose-related mortality rate (87 % increase). Urban NH Black Americans also experienced the greatest increase in the percent of fentanyl-involved deaths (65 % in younger, 61 % in older).

Conclusions: In the era of increased availability of illicitly manufactured fentanyl (2013-2017), there has been a disproportionate increase in opioid-related overdose deaths among urban NH Black Americans. Interventions for urban NH Black Americans are urgently needed to halt the increase in overdose deaths.

Keywords: Black Americans; Fentanyl; Health inequity; Overdose; Urban.


Conflict of interest statement

Declaration of Competing Interest

Althoff: no conflict declared

Leifheit: no conflict declared

Neyong: no conflict declared

Chandran: no conflict declared

Sherman: expert witness in opioid legislation on the side of the plaintiff.

Figures

Figure 1:
Figure 1:
Trends in age-standardized opioid-related overdose mortality rates and number of opioid-related deaths, among non-Hispanic (NH) white and NH Black Americans 2005–2017 The black line and bars represent non-Hispanic white. The gray line and bars represent non-Hispanic Black. Age-standardized opioid-related overdose mortality rate estimates are missing for certain years and subgroups because the number of deaths in the strata within this category was small, thus the data were suppressed in the CDC WONDER data to protect confidentiality. Numbers show the 2013 and 2017 age-standardized opioid-related overdose mortality rate per 100,00 population. The vertical line denoting the year 2013 within the plot is the visual reminder of the year illicitly-manufactured fentanyl emerged in the illicit opioid market.
Figure 2.
Figure 2.
Crude opioid-related overdose mortality rates and the relative increase from 2013 to 2017, stratified by age, and by race and urbanicity The solid black line represents urban non-Hispanic white. The dotted black line represents rural non-Hispanic white. The solid gray line represents urban non-Hispanic Black. The dotted gray line represents rural non-Hispanic Black. Crude opioid-related overdose mortality rate estimates are missing for certain years and subgroups because the number of deaths in the strata within this category was small, thus the data were suppressed in the CDC WONDER data to protect confidentiality. Numbers show the 2013 and 2017 crude opioid-related overdose mortality rate per 100,00 population. The vertical line denoting the year 2013 within the plot is the visual reminder of the year illicitly-manufactured fentanyl emerged in the illicit opioid market.
Figure 3:
Figure 3:
Crude opioid-related overdose mortality rates and the relative increase from 2013 to 2017, stratified by sex and age, and by race, and urbanicity The solid black line represents urban non-Hispanic white. The dotted black line represents rural non-Hispanic white. The solid gray line represents urban non-Hispanic Black. The dotted gray line represents rural non-Hispanic Black. Crude opioid-related overdose mortality rate estimates are missing for certain years and subgroups because the number of deaths in the strata within this category was small, thus the data were suppressed in the CDC WONDER data to protect confidentiality. Numbers show the 2013 and 2017 crude opioid-related overdose mortality rate per 100,00 population. The vertical line denoting the year 2013 within the plot is the visual reminder of the year illicitly-manufactured fentanyl emerged in the illicit opioid market.
Figure 4.
Figure 4.
Changing percent contributions of type-specific opioids to the total opioid-related deaths from 2013 to 2017, by age, race, and urbanicity. The black dot represents 2013. The white dot represents 2017. The red line represents an increase from 2013 to 2017. The blue line represents a decrease from 2013 to 2017. NH=Non Hispanic Younger refers to those <55 years. Older refers to those ≥55 years of age. Fentanyl or synthetic narcotic-involved deaths were indicated with the multiple cause of death T40.4. Heroin-involved deaths included the code T40.1. Other opioids-involved deaths were indicated with the codes T40.0, T40.2, T40.3, and/or T40.6. Percent contributions are missing for certain drugs, years, and subgroups because the number of deaths in the strata within this category was small, thus the data were suppressed in the CDC WONDER data to protect confidentiality

References

    1. Alexander M, 2012. The New Jim Crow: Mass Incarceration in the Age of Color-Blindness, The New Jim Crow: Mass incarceration in the age of colorblindness. The New Press.
    1. Alexander MJ, Kiang MV, Barbieri M, 2018. Trends in Black and White Opioid Mortality in the United States, 1979–2015. Epidemiology 29, 707–715. 10.1097/EDE.0000000000000858 - DOI - PMC - PubMed
    1. Barboza GE, Angulski K, 2020. A descriptive study of racial and ethnic differences of drug overdoses and naloxone administration in Pennsylvania. Int. J. Drug Policy 78 10.1016/j.drugpo.2020.102718 - DOI - PubMed
    1. Beletsky L, Davis CS, 2017. Today’s fentanyl crisis: Prohibition’s Iron Law, revisited. Int. J. Drug Policy 46, 156–159. 10.1016/j.drugpo.2017.05.050 - DOI - PubMed
    1. Buchanich JM, Balmert LC, Williams KE, Burke DS, 2018. The effect of incomplete death certificates on estimates of unintentional opioid-related overdose deaths in the united states, 1999–2015. Public Health Rep. 10.1177/0033354918774330 - DOI - PMC - PubMed

Publication types