Review
. 2020 Sep 30;12(10):1115.
doi: 10.3390/v12101115.

NMR Studies of Retroviral Genome Packaging

Affiliations
Review

NMR Studies of Retroviral Genome Packaging

Patricia S Boyd et al. Viruses. .

Erratum in

Abstract

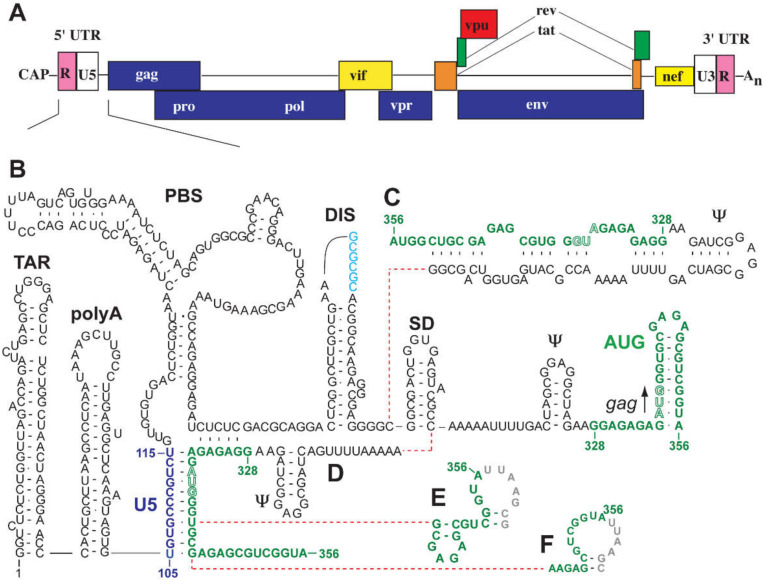
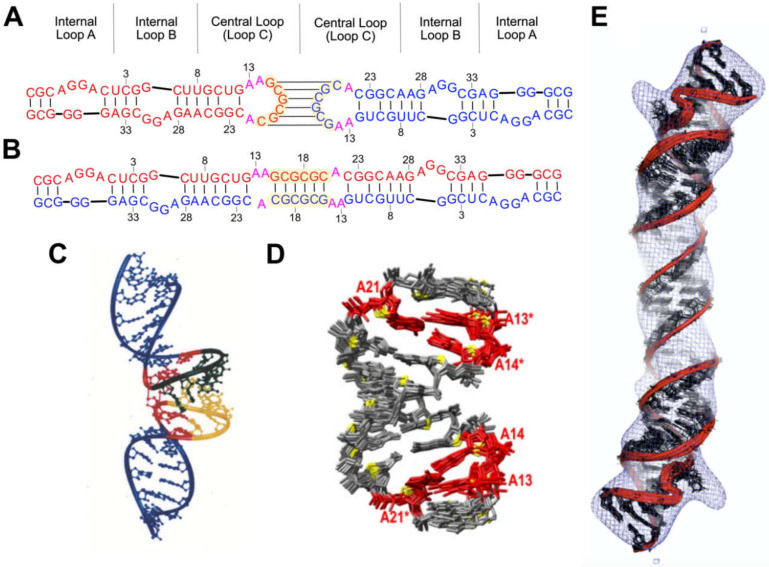
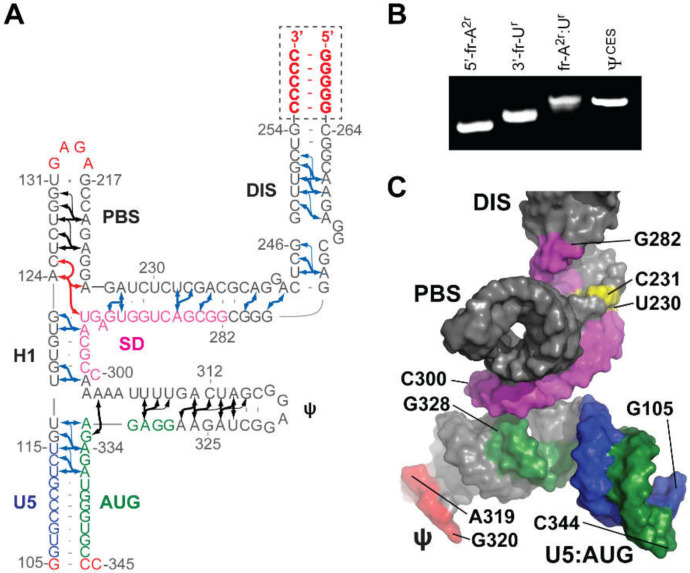
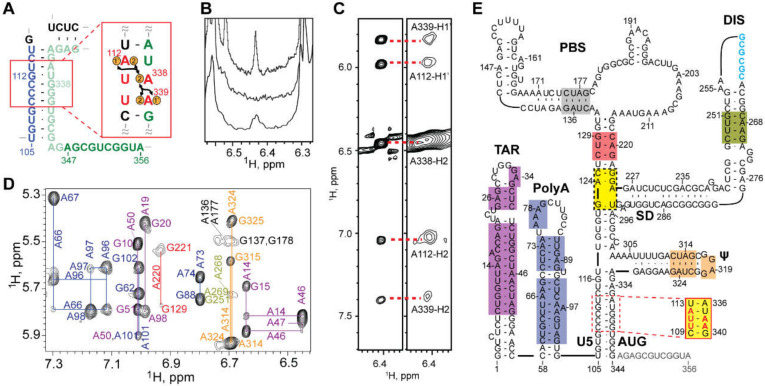
Nearly all retroviruses selectively package two copies of their unspliced RNA genomes from a cellular milieu that contains a substantial excess of non-viral and spliced viral RNAs. Over the past four decades, combinations of genetic experiments, phylogenetic analyses, nucleotide accessibility mapping, in silico RNA structure predictions, and biophysical experiments were employed to understand how retroviral genomes are selected for packaging. Genetic studies provided early clues regarding the protein and RNA elements required for packaging, and nucleotide accessibility mapping experiments provided insights into the secondary structures of functionally important elements in the genome. Three-dimensional structural determinants of packaging were primarily derived by nuclear magnetic resonance (NMR) spectroscopy. A key advantage of NMR, relative to other methods for determining biomolecular structure (such as X-ray crystallography), is that it is well suited for studies of conformationally dynamic and heterogeneous systems-a hallmark of the retrovirus packaging machinery. Here, we review advances in understanding of the structures, dynamics, and interactions of the proteins and RNA elements involved in retroviral genome selection and packaging that are facilitated by NMR.

Keywords: NMR; RNA; SAXS; cyro-EM; genome; packaging; protein; retrovirus; structure.


Conflict of interest statement

The authors declare no conflict of interest.

Figures

Figure 1
Figure 1
Late phase of the HIV-1 replication cycle. Heterogeneous transcriptional start site usage affords 5′-capped transcripts beginning with a single guanosine that function as genomes (gRNA) and are packaged as dimers, as well as 5′-capped transcripts beginning with two (minor species, not shown) or three guanosines that function as mRNAs (5ʹ-leader, coding region, and Rev-binding sites of the viral RNA shown in black, red, and gray, respectively).
Figure 2
Figure 2
HIV-1 NC is a zinc metalloprotein. (A) Amino acid sequence and zinc binding mode of the HIV-1NL4-3 NC protein. (B) NMR structure of HIV-1NL4-3 NC. The independently folded CCHC “zinc knuckle” domains behave like “beads on a string.” (C) Similarities of zinc-edge EXAFS spectra obtained for an isolated HIV-1 CCHC peptide (top) and for intact retroviruses [Mouse Mammary Tumor Virus (center) and Equine Infectious Anemia Virus (bottom)]. Panels (B,C) reproduced from [82], with permission.
Figure 3
Figure 3
NMR studies of HIV-1 MA structure and membrane targeting. (A) 1H-15N HSQC spectra of 15N-labeled MA titrated into bicelles containing increasing mol% native PI(4,5)P2, reveal the binding mode of MA to plasma membrane mimetics. (B) Solution structure of MA determined by NMR. Residues showing large chemical shift perturbations in (A) are highlighted. (C) 1H NMR spectra of MA and myr(-) MA upon addition of liposomes with varying phospholipid compositions. Signal loss indicates binding. MA can bind non-Raft-like membranes due to myristoyl group interactions. Binding to Raft-like membranes is significantly enhanced. Adapted from [122] with permission.
Figure 4
Figure 4
NMR studies of larger Gag constructs. (A) Plot of 13Cα chemical shift indices for SP1 (previously called p2, in braces) and adjacent residues in CACTD-SP1-NC. Consecutive positive values are indicative of α-helical structure. (B) 1H/15N chemical shift perturbation profiles in the presence of DNA [Red—∆P(-)PBS, Blue—d(TG)15]. In the presence of ∆P(-)PBS, chemical shift perturbations are only seen within the NC domain. In the presence of d(TG)15, significant chemical shift perturbations are present within NC but some perturbations are present in regions of MA at higher DNA concentrations (inset). Adapted from [18] (Panel A) and [116] (Panel B), with permission.
Figure 5
Figure 5
(A) Schematic of a representative HIV-1 transcript showing locations of the 5′-UTR and coding regions. (BF) Five of the more than 20 different secondary structures predicted for the HIV-1 5′-leader, on the basis of nucleotide reactivity probing, phylogenetic analysis, and biochemical studies (highlighting variations in AUG residues, colored green). Adapted from [12], with permission.
Figure 6
Figure 6
Kissing and extended duplex forms of dimeric DIS. (A,B) Secondary structures of the HIV-1NL4-3 DIS element in kissing (A) and extended duplex (B) conformations. Individual RNAs denoted in red and blue. The palindrome and flanking purines of the apical loop (Loop C) are colored yellow and pink, respectively. Residue numbers correspond to that of a truncated construct utilized in (D). (C) Solution NMR structure of a DIS kissing dimer. (D) Solution NMR structure of the extended dimer. Flanking purines (red) stack to form a zipper motif. (E) Structure of the extended duplex form of DIS, as determined by a hybrid NMR/cryo-EM approach. Panels (CE) reproduced from [202,203,204], respectively, with permission.
Figure 7
Figure 7
NMR structure of HIV-1NL4-3 ΨCESm. (A) Fragment-annealed sample used to identify long-range adenosine-H2 detected NOEs (denoted by arrows). Non-native residues are shown in red; U5, blue; AUG, green; and SD, pink. (B) Native polyacrylamide gel electrophoresis showing non-covalent annealing of differentially labeled 5′- and 3′- fragments. (C) Representation of the tandem three-way junction NMR structure adopted by ΨCESm (colors match panel A; conformationally dynamic nucleotides, yellow; Ψ tetraloop, orange). Adapted from [41], with permission.
Figure 8
Figure 8
NMR studies of the intact, dimeric HIV-1NL4-3 5′-leader. (A) Illustration depicting mutations in the lr-AID substitution and 1H-1H NOEs. (B) Region of 1D 1H NMR spectra showing (top) the native TAR A46-H2 signal, (middle) A46G substitution, (bottom) A338-H2 signal observed for the lr-AID substitution. (C) 2D 1H-1H NOESY spectra of the same A338-H2 signal observed an isolated U5:AUG hairpin (left) and intact dimer (right) containing the lr-AID substitution. (D) Region of the 2D 1H-1H NOESY spectrum of A2rGrCr-labeled dimeric HIV-1NL4-3 RNA; color-coding matches the elements shown in (E). (E) Secondary structure of the HIV-1NL4-3 in its DIS-exposed, dimer-promoting state. Color-shaded boxes denoted resolved and assigned 2D 1H-1H NOESY signals; yellow denotes sites that were only assignable in mutant constructs using truncated constructs or lrAID substitution. Panels (AC) adapted from [71] and panels (D,E) from [221], with permission.
Figure 9
Figure 9
Discrimination between kissing and extended duplex base pairing in the HIV-1NL4-3 5′-leader by 2H-edited lr-AID NMR. (A,B) Cross-strand NOEs between A268-H2 and G251-H1′ establish the nature of the intermolecular interface in the kissing (A) versus extended duplex (B) interfaces (green dots = Gr labeling; orange dots = A2 labeling). (C) A268-H2 to G251-H1′ NOEs in both A2Gr and A2:GrCrUr support an extended duplex interface. (D) Summary of intermolecular (pink) (U5:AUG and DIS) and intramolecular (blue) (TAR, PolyA, PBS, Ψ) base pairings detected by NMR. Reproduced from [221], with permission.
Figure 10
Figure 10
Heterogeneous transcriptional start site usage modulates HIV-1MAL RNA dimerization and function. (A) Three guanines (red) can serve as alternative transcription start sites. (B) Transcripts are co-transcriptionally capped by 7-methylguanosine. (C) Effect of 5′-guanosines and capping on 5′-leader dimerization. (D) Portions of 2D NOE spectra showing similarities of Cap-CH3 to Cap-H8, G3, and G108 NOEs observed for G8 intact dimer and the Capped TAR-polyA-U5AUG (Cap1G-leaderTPUA). (E) Assigned A-H2 NOEs and deduced secondary structure; discrete functional elements differentiated by color. Dashed lines denote residues of the Cap1G-leaderTPUA construct used for high-resolution structural studies. (F) Structure of the Cap1G-leaderTPUA showing end-to-end stacking of the TAR and polyA helices and sequestration of the Cap. Adapted from [75], with permission.
Figure 11
Figure 11
NMR and structural findings for the monomeric Cap3G and Cap2G forms of the HIV-1MAL leader. (A) Regions of the 2D 1H-1H NOESY spectra for the non-capped 3G- leader371 (AH, black; A2rGr, green; A2rCr, blue; G1HA2r, red) used to make secondary structure assignments shown in D. (B) Overlapped 2D 1H-1H NOESY spectra for A2-Cap2G-leader371 (black) and TAR fragment Cap2G-TARm (dashed outlined residues in panel D with U13 and G47 connected by a GAGA tetraloop) (red), showing that the cap methyl group is in close proximity to A58. (C) Similar results were obtained for Cap3G-leader371 (black) and a Cap3G-TARm RNA (red). (D) NOEs (arrows) and secondary structure of monomeric Cap-3G HIV-1MAL leader. (E) Structure of a Cap3G-TARm showing the unstructured Cap. Adapted from [75], with permission.
Figure 12
Figure 12
Influence of 5′-guanosine number on RNA structure. Capped RNAs containing two or three 5′-guanosines (left) adopt a monomeric structure that exposes the cap and enables RNA processing and metabolism, whereas those with a single capped G (right) adopt a cap-sequestered conformation that promotes dimerization and packaging (Cap = red sphere, guanosines = green spheres). Adapted from [75], with permission.
Figure 13
Figure 13
Dimerization-dependent structure of the MoMuLV minimal packaging signal. (A) Left: Secondary structure of monomeric mΨ and the base pairings observed at equilibrium for DIS-2 and SL-C. Right: Base pairings in the dimeric form of mΨ. The palindromic sequences required for dimer formation are shown in green (DIS-2) and blue (SL-C and SL-D). NC-binding UCUG elements are shown in red. (B) The NMR structure of the 18-nt SL-D kissing duplex. (C) Superposition of the cryo-electron tomography densities and the NMR ensemble structures of [ΨCD]2. Panels (A,C) reproduced from [315], and panel (B) from [316], with permission.
Figure 14
Figure 14
Improved NMR spectral quality afforded by 2H-edited NMR in the studies of MoMuLV minimal packaging signal, with loop residues engineered to prevent dimerization (mΨCES). (A) Representative strips from 3D 1H-13C correlated with the NOESY spectra obtained for 13C-labeled mΨCES. (B) Portion of a 2D NOESY spectrum obtained for an mΨCES sample containing protonated guanosines and with all other predeuterated nucleotides (breakthrough signals from incomplete deuteration of adenosines are also visible). Linewidths are significantly narrower in the 2H-edited spectra. (C) 3D NMR structure of mΨCES. Adapted from [322], with permission.
Figure 15
Figure 15
NMR structure of HIV-1NL4-3 NC bound to the GGAG loop region of the Ψ-hairpin stem-loop [109]. (A) Overall view showing the relative orientation of the RNA (gray) relative to the 310-helix (yellow), N-terminal zinc knuckle (F1, blue), and C-terminal zinc knuckle (F2, green). Guanosines G7 and G9 are shown in red and orange, respectively. (B) Interactions between G9 and NC-F1. Hydrogen bonds are depicted as yellow dash lines and hydrophobic side chains shown as spheres. (C) Interactions between G7 and NC-F2.
Figure 16
Figure 16
Complex structures of MoMuLV and RSV NC bound to the recognition elements in their respective packaging signals (reported in [66] and [112], respectively). (A) MoMuLV NC-UCUG complex structure (PDB ID: 1U6P). SL-B, SL-C, and SL-D are colored in red, blue, and gold, respectively. The UCUG linker and binding site is colored gray with G309 in magenta. The zinc knuckle domain of the MoMuLV NC is shown in green, with the black dashes representing the coordination of Zn. (B) The direct interaction between the MoMuLV NC and G309. Hydrogen bonds are shown as yellow dashes and the gray spheres represent hydrophobic interactions. (C) RSV NC bound to the µΨ packaging signal (PDB ID: 2IHX). The O3-stem, SL-A, AUG-3 linker, SL-B, and SL-C are colored gray, purple, pink, gold, and red, respectively. The N-terminal zinc knuckle, linker residues, and C-terminal zinc knuckle are colored blue, green, and orange, respectively. G218 nucleobase is colored green. A168 and A197 nucleobases are colored cyan. (D) The N-terminal zinc knuckle of the RSV NC interacting with G218. (E) The C-terminal zinc knuckle interacting with A168 and A197. Salt bridge interactions are depicted as cyan-colored dashes.
Figure 17
Figure 17
(A) NC treated with mercaptobenzamide-1 targets the sparsely populated states of the C-terminal zinc knuckle of NC. (B) 1H-15N spectrum of NC alone (green) treated with 20-fold molar excess of mercaptobenzamide-1. Three-hour treatment (red) and 6-h treatment (blue) of merceptaobenzamide-1 (Black circles highlight the C-terminal zinc knuckle cross-peaks). (B,C) 15N-CPMG relaxation dispersion (B) and CEST experiments reveal the sparsely populated states (C) of the C-terminal zinc knuckle of NC. Adapted from [384], with permission.
Figure 18
Figure 18
Small molecule inhibitors of NC-oligonucleotide binding. (A) NC protein and small molecule (Inhibitor-3) used for structural studies. (B) 2D NOESY data for the NC:Inhibitor-3 complex. (C) NMR structure of the NC:Inhibitor-3 complex (carbon atoms in green). Adapted from [385], with permission.
Figure 19
Figure 19
Small molecule inhibitor of HIV-1 genome packaging. (A) Structure of packaging inhibitor NSC. (B) Binding sites of NSC in the Ψ-hairpin of the HIV-1 packaging signal. (C) NSC treatment reduces HIV-1 selective genome packaging. Asterisks represent statistically significant from wild-type (WT) by Student’s t test, p < 0.05. Panel (C) reproduced from [389], with permission.
Figure 20
Figure 20
Open questions regarding the structural biology of HIV-1 genome packaging. Structures of spliced mRNAs that avoid packaging are unknown, and structures of gRNA-Gag complexes that anchor the genome to the plasma membrane and nucleate virus assembly are also unknown.

References

    1. Berkowitz R., Fisher J., Goff S.P. RNA packaging. Curr. Top. Microbiol. Immun. 1996;214:177–218. - PubMed
    1. Rein A. Retroviral RNA packaging: A review. Arch. Virol. 1994;9:513–522. - PubMed
    1. Greatorex J., Lever A. Retroviral RNA dimer linkage. J. Gen. Virol. 1998;79:2877–2882. doi: 10.1099/0022-1317-79-12-2877. - DOI - PubMed
    1. Paillart J.-C., Marquet R., Skripkin E., Ehresmann C., Ehresmann B. Dimerization of retroviral genomic RNAs: Structural and functional implications. Biochimie. 1996;78:639–653. doi: 10.1016/S0300-9084(96)80010-1. - DOI - PubMed
    1. Jewell N.A., Mansky L.M. In the beginning: Genome recognition, RNA encapsidation and the initiation of complex retrovirus assembly. J. Gen. Virol. 2000;81:1889–1899. doi: 10.1099/0022-1317-81-8-1889. - DOI - PubMed

Publication types

LinkOut - more resources