

Integrated analysis identifies a pathway-related competing endogenous RNA network in the progression of pancreatic cancer
- PMID: 33008376
- PMCID: PMC7532576
- DOI: 10.1186/s12885-020-07470-4
Integrated analysis identifies a pathway-related competing endogenous RNA network in the progression of pancreatic cancer
Abstract
Background: It is well acknowledged that cancer-related pathways play pivotal roles in the progression of pancreatic cancer (PC). Employing Integrated analysis, we aim to identify the pathway-related ceRNA network associated with PC progression.
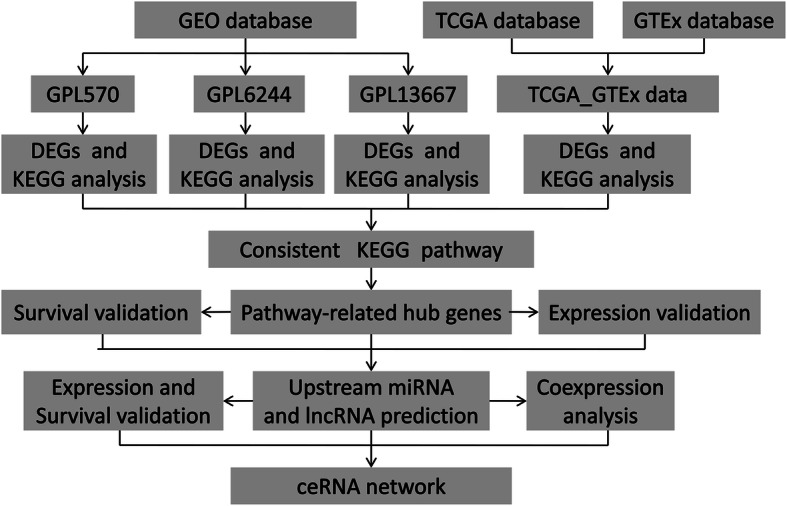
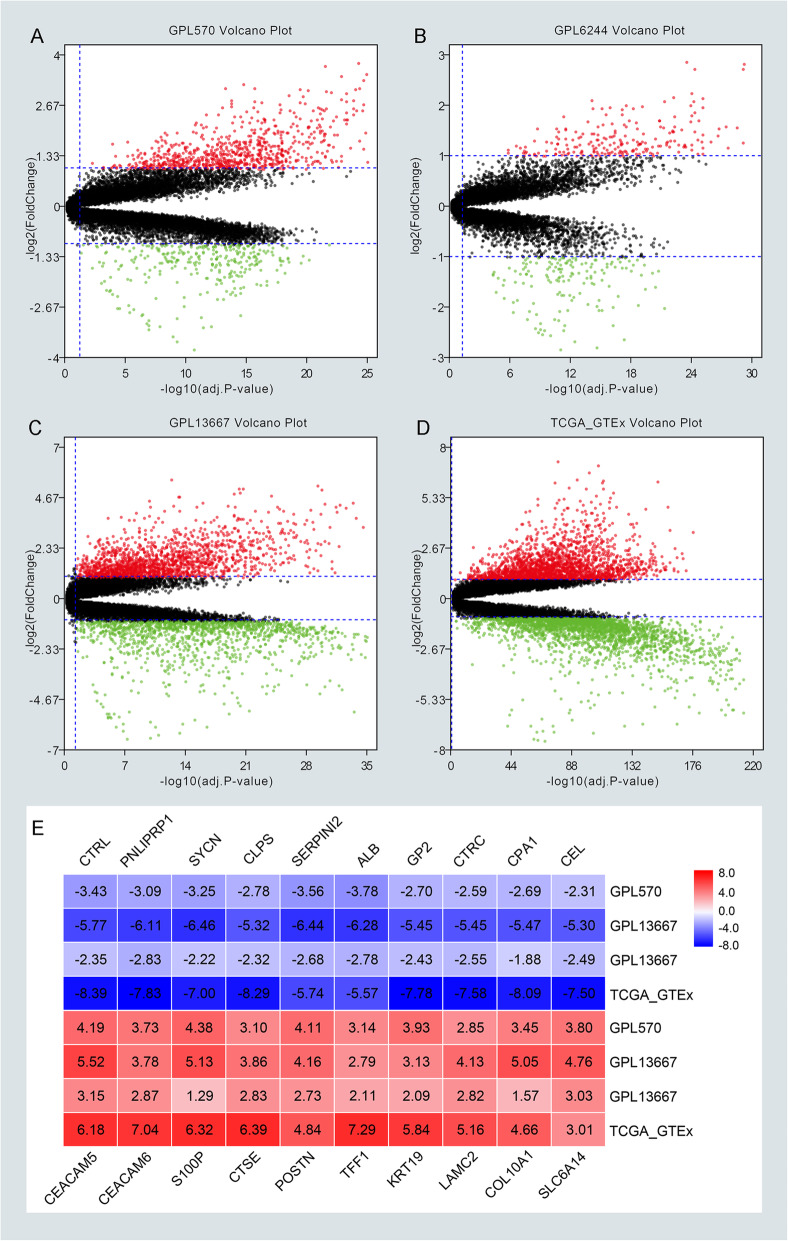
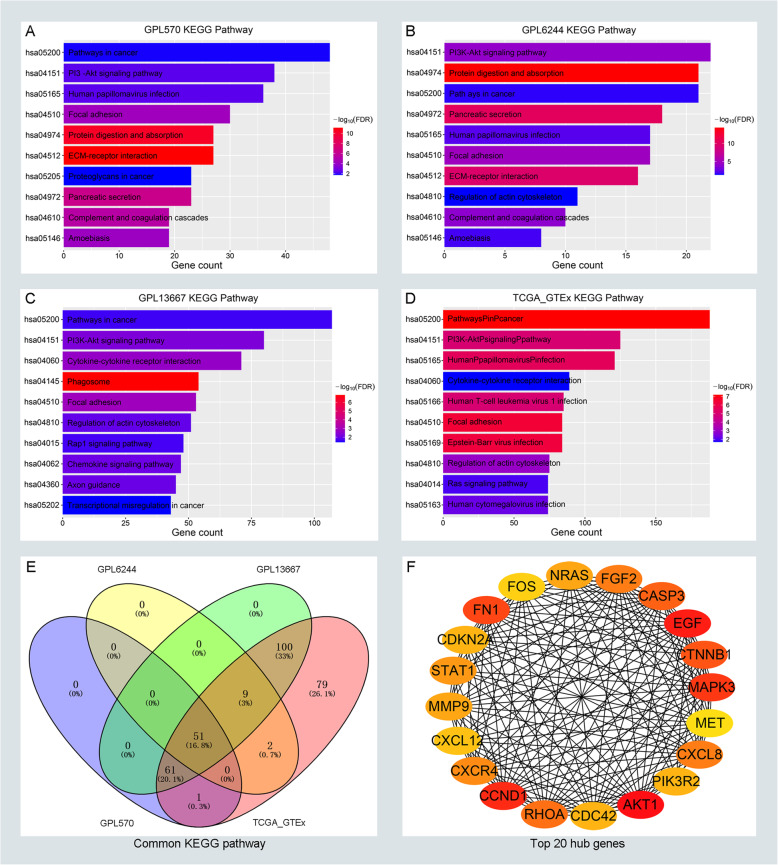
Methods: We divided eight GEO datasets into three groups according to their platform, and combined TCGA and GTEx databases as a group. Additionally, we screened out the differentially expressed genes (DEGs) and performed functional enrichment analysis in each group, and recognized the top hub genes in the most enriched pathway. Furthermore, the upstream of miRNAs and lncRNAs were predicted and validated according to their expression and prognostic roles. Finally, the co-expression analysis was applied to identify a pathway-related ceRNA network in the progression of PC.
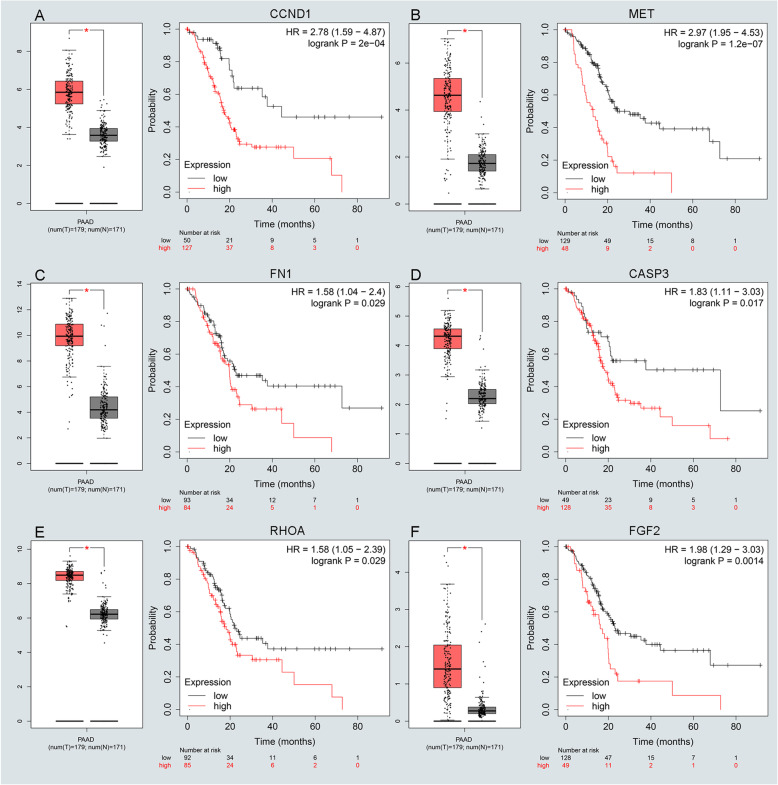
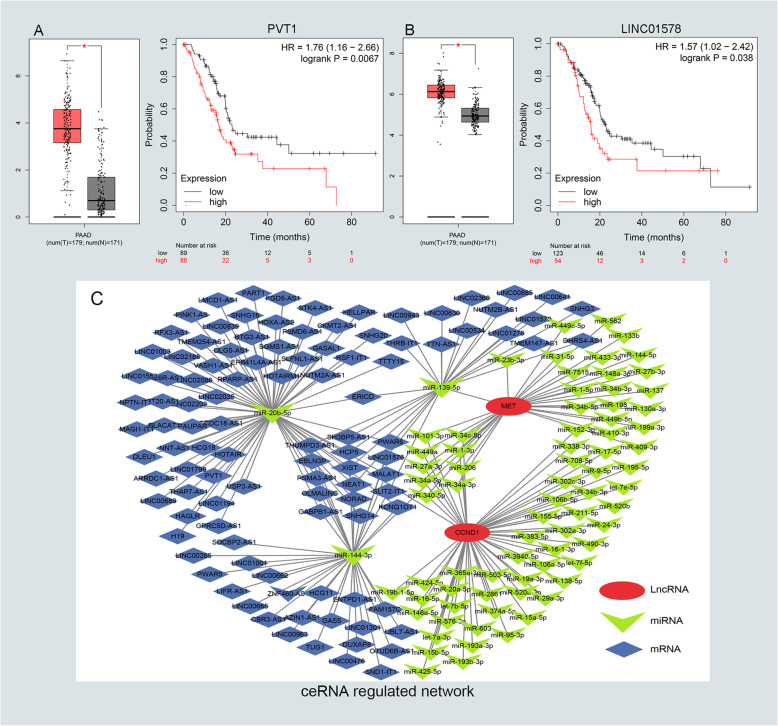
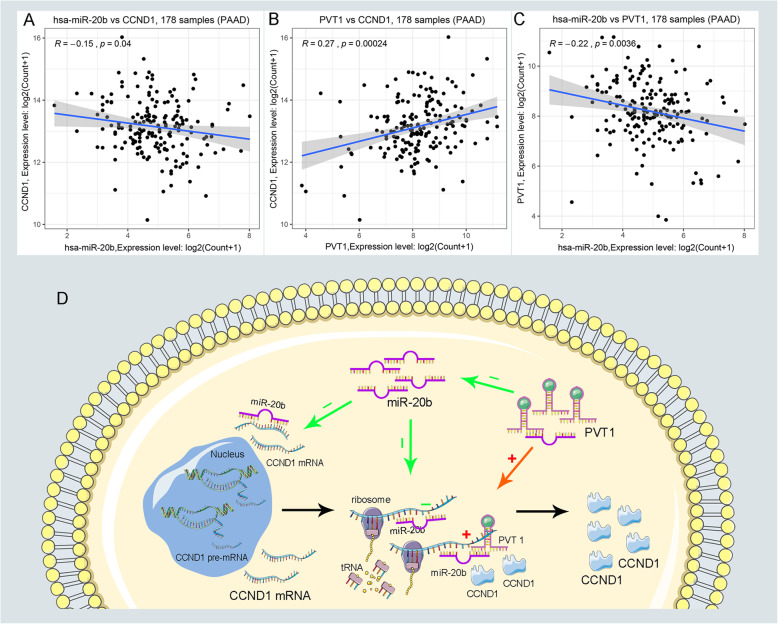
Results: A total of 51 significant pathways that common enriched in all groups were spotted. Enrichment analysis indicated that pathway in cancer was greatly linked with tumor formation and progression. Next, the top 20 hug genes in this pathway were recognized, and stepwise prediction and validation from mRNA to lncRNA, including 11 hub genes, 4 key miRNAs, and 2 key lncRNAs, were applied to identify a meaningful ceRNA network according to ceRNA rules. Ultimately, we identified the PVT1/miR-20b/CCND1 axis as a promising pathway-related ceRNA axis in the progression of PC.
Conclusion: Overall, we elucidate the pathway-related ceRNA regulatory network of PVT1/miR-20b/CCND1 in the progression of PC, which can be considered as therapeutic targets and encouraging prognostic biomarkers for PC.
Keywords: Cancer pathways; Competing endogenous RNA; Integrated analysis; Pancreatic cancer; Progression.
Conflict of interest statement
The authors declare no competing interests.
Figures
Similar articles
-
A novel mRNA-miRNA-lncRNA competing endogenous RNA triple sub-network associated with prognosis of pancreatic cancer.Aging (Albany NY). 2019 May 6;11(9):2610-2627. doi: 10.18632/aging.101933. Aging (Albany NY). 2019. PMID: 31061236 Free PMC article.
-
Identification of a competing endogenous RNA axis related to gastric cancer.Aging (Albany NY). 2020 Oct 20;12(20):20540-20560. doi: 10.18632/aging.103926. Epub 2020 Oct 20. Aging (Albany NY). 2020. PMID: 33080572 Free PMC article.
-
Identification of a Competing Endogenous RNA Network Related to Immune Signature in Lung Adenocarcinoma.Front Genet. 2021 Jun 3;12:665555. doi: 10.3389/fgene.2021.665555. eCollection 2021. Front Genet. 2021. PMID: 34149807 Free PMC article.
-
Comprehensive Analysis of lncRNA-Mediated ceRNA Crosstalk and Identification of Prognostic Biomarkers in Wilms' Tumor.Biomed Res Int. 2020 Feb 21;2020:4951692. doi: 10.1155/2020/4951692. eCollection 2020. Biomed Res Int. 2020. PMID: 32149111 Free PMC article.
-
Reconstruction and Analysis of the Differentially Expressed IncRNA-miRNA-mRNA Network Based on Competitive Endogenous RNA in Hepatocellular Carcinoma.Crit Rev Eukaryot Gene Expr. 2019;29(6):539-549. doi: 10.1615/CritRevEukaryotGeneExpr.2019028740. Crit Rev Eukaryot Gene Expr. 2019. PMID: 32422009 Review.
Cited by
-
Netrin-1 feedforward mechanism promotes pancreatic cancer liver metastasis via hepatic stellate cell activation, retinoid, and ELF3 signaling.Cell Rep. 2023 Nov 28;42(11):113369. doi: 10.1016/j.celrep.2023.113369. Epub 2023 Nov 3. Cell Rep. 2023. PMID: 37922311 Free PMC article.
-
nc-RNA-mediated high expression of CDK6 correlates with poor prognosis and immune infiltration in pancreatic cancer.Cancer Med. 2023 Feb;12(4):5110-5123. doi: 10.1002/cam4.5260. Epub 2022 Dec 1. Cancer Med. 2023. PMID: 36457244 Free PMC article.
-
Clinico-demographic and biochemical correlation of inflammatory gene expression in pediatric nephrotic syndrome.Mol Biol Rep. 2024 Jul 26;51(1):854. doi: 10.1007/s11033-024-09784-z. Mol Biol Rep. 2024. PMID: 39060482
-
Long noncoding RNA DLGAP1-AS1 promotes the progression of glioma by regulating the miR-1297/EZH2 axis.Aging (Albany NY). 2021 Apr 26;13(8):12129-12142. doi: 10.18632/aging.202923. Epub 2021 Apr 26. Aging (Albany NY). 2021. PMID: 33901010 Free PMC article.
-
Increased Levels of miR-15b-5p and miR-20b-5p in Pancreatic Ductal Adenocarcinoma with Hepatic Metastases.Genes (Basel). 2023 Aug 2;14(8):1577. doi: 10.3390/genes14081577. Genes (Basel). 2023. PMID: 37628628 Free PMC article.
References
MeSH terms
Substances
Grants and funding
LinkOut - more resources
Full Text Sources
Other Literature Sources
Medical
Research Materials
