. 2020 Oct 2;20(1):392.
doi: 10.1186/s12886-020-01663-y.

Diabetic macular edema with pachychoroid features

Affiliations

Diabetic macular edema with pachychoroid features

Kyungeun Kang et al. BMC Ophthalmol. .

Abstract

Background: To investigate the clinical features of diabetic macular edema (DME) in eyes with pachychoroid phenotypes using multimodal retinal imaging.

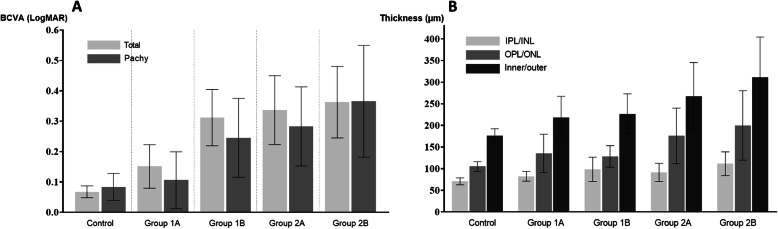
Methods: We retrospectively reviewed 210 eyes from 210 DME patients and analyzed the clinical and imaging parameters, including visual acuity, central macular thickness (CMT), subfoveal choroidal thickness (SFCT) and neural retina layer thickness (NRT). The DME eyes were divided into two groups: group 1 (80 eyes with submacular detachment [SMD]) and group 2 (130 eyes without SMD). The clinical and imaging parameters of 285 eyes from 285 diabetic patients without DME were collected as a control group.

Results: DME eyes with pachychoroid phenotypes were more frequent in group 1 than in group 2 (53 eyes [66.25%] and 53 eyes [40.77%], respectively, P < 0.001). Pachychoroid phenotypes were identified in 108 (37.90%) of the control eyes. CMT and NRT were greater in group 1 than in group 2. In group 1, 37 eyes had SMD combined with focal edema, and 43 eyes had SMD combined with diffuse-type edema. No significant difference in pachychoroid phenotypes was found between the focal and diffuse types (26 [70.27%] and 27 [62.79%], respectively, P = 0.481). In group 2, 70 eyes had focal-type edema, and 60 eyes had diffuse-type edema. No significant difference in the frequency of pachychoroid phenotypes was found (32 [45.71%] and 21 [35.00%], respectively, P = 0.215). Interestingly, among the 70 eyes with focal edema in group 2, 13 (40.6%) and 5 (13.2%) eyes with and without pachychoroid phenotypes showed no definite microaneurysms, respectively.

Conclusion: SMD and focal edema without definite microaneurysms may be clinical manifestations of DME with pachychoroid phenotypes and possibly related to choroidal circulation disturbance in DME.

Keywords: Central macula thickness; Diabetic macular edema; Diabetic retinopathy; Pachychoroid; Subfoveal choroidal thickness.


Conflict of interest statement

The authors declare that they have no competing interests.

Figures

Fig. 1
Fig. 1
Comparison of baseline visual acuity and retinal layer thickness in pachychoroid-type patients in each group a Graphs showing the baseline BCVA in all patients and in pachychoroid-type patients. Among all groups (light gray bar graph), the mean logMAR BCVA at baseline was 0.16 ± 0.28. The mean BCVA for each group is as follows: 0.07 ± 0.17, 0.34 ± 0.34, 0.36 ± 0.38, 0.15 ± 0.30, and 0.31 ± 0.36 in the control group and groups 1A, 1B, 2A and 2B, respectively. In pachychoroid phenotypes (dark gray bar graph), the mean logMAR BCVA at baseline was 0.16 ± 0.31. The mean BCVA for each group is as follows: 0.08 ± 0.23, 0.28 ± 0.32, 0.37 ± 0.46, 0.11 ± 0.26 and 0.25 ± 0.29 in the control group and groups 1A, 1B, 2A and 2B, respectively. b Graphs showing the neural retinal thickness in pachychoroid-type patients. The mean thickness of the IPL/INL (light gray bar graph) was 82.84 ± 21.90 μm. The mean thickness of the IPL/INL for each group is as follows: 70.75 ± 8.05, 91.52 ± 21.05, 111.41 ± 27.51, 82.36 ± 11.43 and 98.31 ± 27.94 μm in the control group and groups 1A, 1B, 2A and 2B, respectively. The mean thickness of the OPL/ONL (medium gray bar graph) was 132.37 ± 53.52 μm. The mean thickness of the OPL/ONL for each group is as follows: 105.02 ± 11.25, 175.78 ± 64.02, 199.83 ± 80.24, 135.09 ± 44.43 and 128.42 ± 24.86 μm in the control group and groups 1A, 1B, 2A and 2B, respectively. The mean thickness of the inner/outer layer (dark gray bar graph) was 215.16 ± 69.11 μm. The mean thickness of the inner/outer layer for each group was 175.67 ± 76.57, 267.30 ± 78.09, 311.24 ± 92.99, 217.44 ± 49.74 and 226.73 ± 46.25 μm in the control group and groups 1A, 1B, 2A and 2B, respectively

References

    1. Klein R, Klein BE, Moss SE, Davis MD, DeMets DL. The Wisconsin epidemiologic study of diabetic retinopathy. IV Diabetic macular edema. Ophthalmology. 1984;91:1464–1474. doi: 10.1016/S0161-6420(84)34102-1. - DOI - PubMed
    1. Otani T, Kishi S, Maruyama Y. Patterns of diabetic macular edema with optical coherence tomography. Am J Ophthalmol. 1999;127:688–693. doi: 10.1016/S0002-9394(99)00033-1. - DOI - PubMed
    1. Kang SW, Park CY, Ham DI. The correlation between fluorescein angiographic and optical coherence tomographic features in clinically significant diabetic macular edema. Am J Ophthalmol. 2004;137:313–322. doi: 10.1016/j.ajo.2003.09.016. - DOI - PubMed
    1. Ozdemir H, Karacorlu M, Karacorlu S. Serous macular detachment in diabetic cystoid macular oedema. Acta Ophthalmol Scand. 2005;83:63–66. doi: 10.1111/j.1600-0420.2005.00387.x. - DOI - PubMed
    1. Bresnick GH. Diabetic maculopathy. A critical review highlighting diffuse macular edema. Ophthalmology. 1983;90:1301–1317. doi: 10.1016/S0161-6420(83)34388-8. - DOI - PubMed