. 2020 Oct 2;4(10):573-584.
doi: 10.4049/immunohorizons.2000051.

Activation-Induced Marker Expression Identifies Mycobacterium tuberculosis-Specific CD4 T Cells in a Cytokine-Independent Manner in HIV-Infected Individuals with Latent Tuberculosis

Affiliations

Activation-Induced Marker Expression Identifies Mycobacterium tuberculosis-Specific CD4 T Cells in a Cytokine-Independent Manner in HIV-Infected Individuals with Latent Tuberculosis

Morgan S Barham et al. Immunohorizons. .

Abstract

HIV infection is a significant risk factor for reactivation of latent Mycobacterium tuberculosis infection (LTBI) and progression to active tuberculosis disease, yet the mechanisms whereby HIV impairs T cell immunity to M. tuberculosis have not been fully defined. Evaluation of M. tuberculosis-specific CD4 T cells is commonly based on IFN-γ production, yet increasing evidence indicates the immune response to M. tuberculosis is heterogeneous and encompasses IFN-γ-independent responses. We hypothesized that upregulation of surface activation-induced markers (AIM) would facilitate detection of human M. tuberculosis-specific CD4 T cells in a cytokine-independent manner in HIV-infected and HIV-uninfected individuals with LTBI. PBMCs from HIV-infected and HIV-uninfected adults in Kenya were stimulated with CFP-10 and ESAT-6 peptides and evaluated by flow cytometry for upregulation of the activation markers CD25, OX40, CD69, and CD40L. Although M. tuberculosis-specific IFN-γ and IL-2 production was dampened in HIV-infected individuals, M. tuberculosis-specific CD25+OX40+ and CD69+CD40L+ CD4 T cells were detectable in the AIM assay in both HIV-uninfected and HIV-infected individuals with LTBI. Importantly, the frequency of M. tuberculosis-specific AIM+ CD4 T cells was not directly impacted by HIV viral load or CD4 count, thus demonstrating the feasibility of AIM assays for analysis of M. tuberculosis-specific CD4 T cells across a spectrum of HIV infection states. These data indicate that AIM assays enable identification of M. tuberculosis-specific CD4 T cells in a cytokine-independent manner in HIV-uninfected and HIV-infected individuals with LTBI in a high-tuberculosis burden setting, thus facilitating studies to define novel T cell correlates of protection to M. tuberculosis and elucidate mechanisms of HIV-associated dysregulation of antimycobacterial immunity.


Conflict of interest statement

DISCLOSURES

The authors have no financial conflicts of interest.

Figures
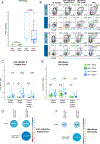
FIGURE 1.
FIGURE 1.. Differential upregulation of activation markers on M. tuberculosis–specific CD4 T cells from IGRA and IGRA+ individuals.
Study participants were evaluated by IGRA to determine M. tuberculosis infection status (n = 75, see Table I). Cryopreserved PBMCs from each participant were used in the AIM assay. (A) Composite data of the TB Ag response in the QFT assay. Data are shown after subtraction of background IFN-γ in the QFT Nil tube. Horizontal lines represent the median. (B) Representative flow cytometry data from the AIM assay indicating Ag-induced expression of CD25+OX40+ and CD69+CD40L+ CD4 T cells from individuals in the HIV IGRA+ and HIV+ IGRA+ groups. Plots are shown gated on live CD3+CD4+ T cells. (C) Composite data of CD4 T cell expression of the indicated activation markers following stimulation with CFP-10/ESAT-6 peptide pool. (D) Correlogram analysis between IGRA responses (TB Ag-Nil) and CFP-10/ESAT-6–induced AIM expression on CD4 T cells from all study participants (n = 75). (E) Composite data of CD4 T cell expression for the indicated markers following stimulation with M. tuberculosis whole cell lysate. (F) Correlogram analysis between IGRA responses (TB Ag-Nil) and M. tuberculosis lysate-induced AIM expression on CD4 T cells from all study participants (n = 75). Data in (C) and (E) are shown after subtraction of background AIM expression on CD4 T cells incubated in media alone. Boxes in (C) and (E) represent the median and interquartile ranges; whiskers represent 1.5 × interquartile range. Differences in the frequencies of AIM+ CD4 T cells between IGRA and IGRA+ groups and between HIV and HIV+ groups were assessed using the Mann–Whitney U test. Correlations in (D) and (F) were evaluated using a nonparametric Spearman rank correlation, with p values indicated in each circle. Positive correlations are displayed in blue and negative correlations in red. Color intensity and the size of the circle are proportional to the correlation coefficients.
FIGURE 2.
FIGURE 2.. Frequencies of CFP-10/ESAT-6–specific AIM+ CD4 T cells do not correlate directly with HIV viral load or CD4 count.
Correlograms were generated to determine the relationship between HIV viral load, CD4 count, and the frequencies of Ag-specific AIM+ CD4 T cells. Data from 37 HIV+ individuals were included in this analysis (n = 20 IGRA; n = 17 IGRA+). Correlations were evaluated using a nonparametric Spearman rank correlation, with p values indicated in each circle. Positive correlations are displayed in blue and negative correlations in red. Color intensity and the size of the circle are proportional to the correlation coefficients.
FIGURE 3.
FIGURE 3.. M. tuberculosis–specific CD4 T cell AIM assay functionality scores in HIV-infected and HIV-uninfected individuals.
Combinations of AIM markers (CD25, OX40, CD69, and CD40L) expressed on CD4 T cells from HIV-uninfected and from HIV-infected IGRA+ individuals were analyzed by flow cytometry as described in Fig. 1. Boolean analysis was used to define subsets of CD4 T cells expressing all possible combinations of the four AIM markers. COMPASS was then used to summarize the Ag-specific AIM marker upregulation profile of each group, generating an AIM assay functionality score for CFP-10/ESAT-6–stimulated CD4 T cells (A) and M. tuberculosis whole cell lysate-stimulated CD4 T cells (B). The functionality score ranges from zero to one and indicates the proportion of Ag-specific AIM subsets expressed for a given individual among all possible subsets expressing one or more activation marker. Principal component analysis plots of the expression profiles of activation markers are shown in the right panel for each Ag. Differences in the functionality scores of CD4 T cells expressing activation markers between HIV-uninfected and HIV-infected individuals were assessed using the Mann-Whitney U test.
FIGURE 4.
FIGURE 4.. HIV coinfection modifies M. tuberculosis–specific cytokine production profiles in individuals with LTBI.
PBMCs from HIV (n = 19) and HIV+ (n = 17) IGRA+ individuals were stimulated with Ags as described in Fig. 1. After 16 h, cell supernatants were harvested, and cytokine levels were quantified by Luminex bead assay. Concentrations of IFN-γ, IL-2, TNF-α, IL-17AF, IL-22, and IL-10 are shown following stimulation of PBMCs with CFP-10/ESAT-6 peptide pool (A), M. tuberculosis whole cell lysate (B), HCMV pp65 peptide pool (C), and SEB (D). Boxes represent the median and interquartile ranges; whiskers represent the minimum and maximum values. Differences in cytokine concentration between HIV and HIV+ individuals were assessed using the Mann-Whitney U test.
FIGURE 5.
FIGURE 5.. Coinfection with HIV skews the relationship between M. tuberculosis–specific AIM+ CD4 T cells and cytokine production profiles.
Correlogram analysis between CFP-10/ESAT-6–specific cytokine production and surface AIM expression by CD4 T cells from HIV IGRA+ individuals (A) and HIV+ IGRA+ individuals (B). Correlations were calculated by Spearman rank-order correlation, with p values indicated in each circle. The size and color intensity of each circle are proportional to the strength and direction (blue: positive; red: negative) of each correlation coefficient. Correlograms are ordered by the angular order of the eigenvectors of HIV individuals; correlogram data from HIV+ individuals are ordered according to the angular order of the eigenvectors of HIV individuals.

References

    1. Houben RMGJ, and Dodd PJ. 2016. The global burden of latent tuberculosis infection: a re-estimation using mathematical modelling. PLoS Med 13: e1002152. - PMC - PubMed
    1. World Health Organization. 2019. Global Tuberculosis Report 2019. World Health Organization, Geneva, Switzerland.
    1. Lawn SD, and Zumla AI. 2011. Tuberculosis. Lancet 378: 57–72. - PubMed
    1. Day CL, Abrahams DA, Harris LD, van Rooyen M, Stone L, de Kock M, and Hanekom WA. 2017. HIV-1 infection is associated with depletion and functional impairment of Mycobacterium tuberculosis-specific CD4 T cells in individuals with latent tuberculosis infection. J. Immunol 199: 2069–2080. - PMC - PubMed
    1. Geldmacher C, Ngwenyama N, Schuetz A, Petrovas C, Reither K, Heeregrave EJ, Casazza JP, Ambrozak DR, Louder M, Ampofo W, et al. 2010. Preferential infection and depletion of Mycobacterium tuberculosis-specific CD4 T cells after HIV-1 infection. J. Exp. Med 207: 2869–2881. - PMC - PubMed

Publication types