. 2020 Oct 30;133(20):jcs254094.
doi: 10.1242/jcs.254094.

Keratin 17 regulates nuclear morphology and chromatin organization

Affiliations

Keratin 17 regulates nuclear morphology and chromatin organization

Justin T Jacob et al. J Cell Sci. .

Abstract

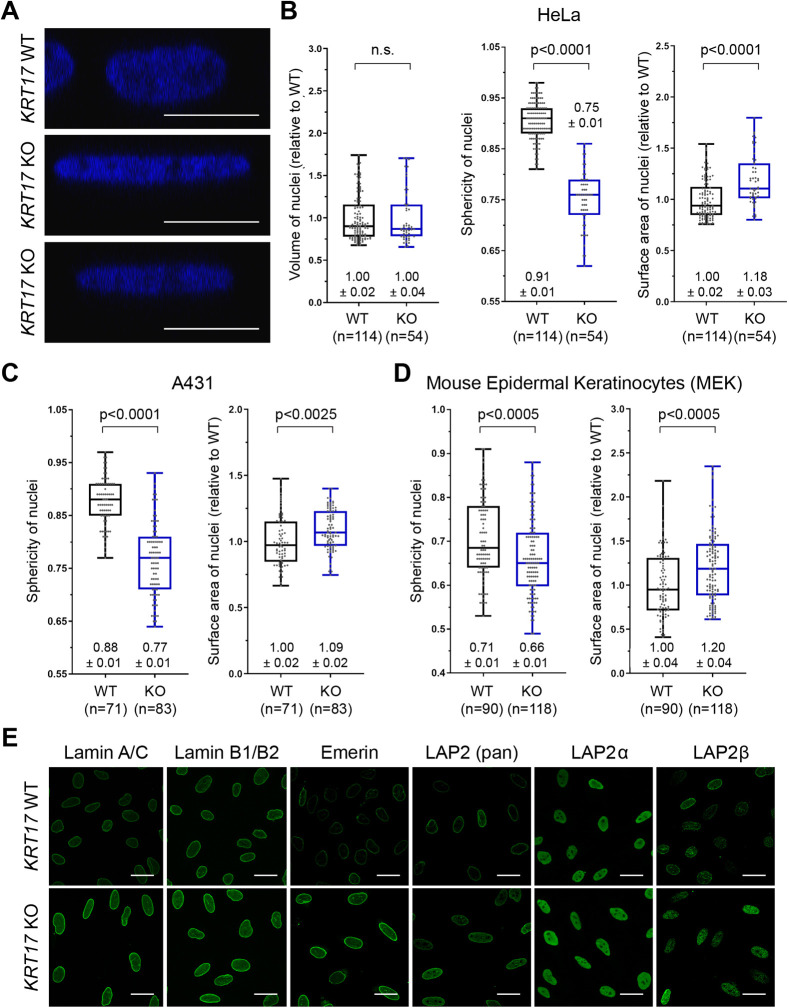
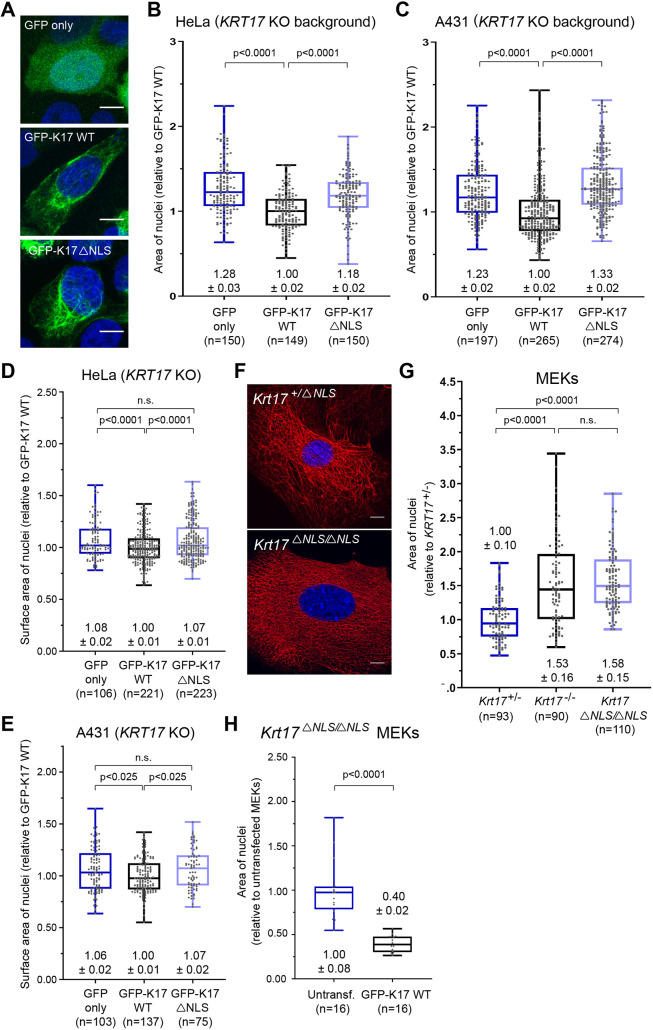
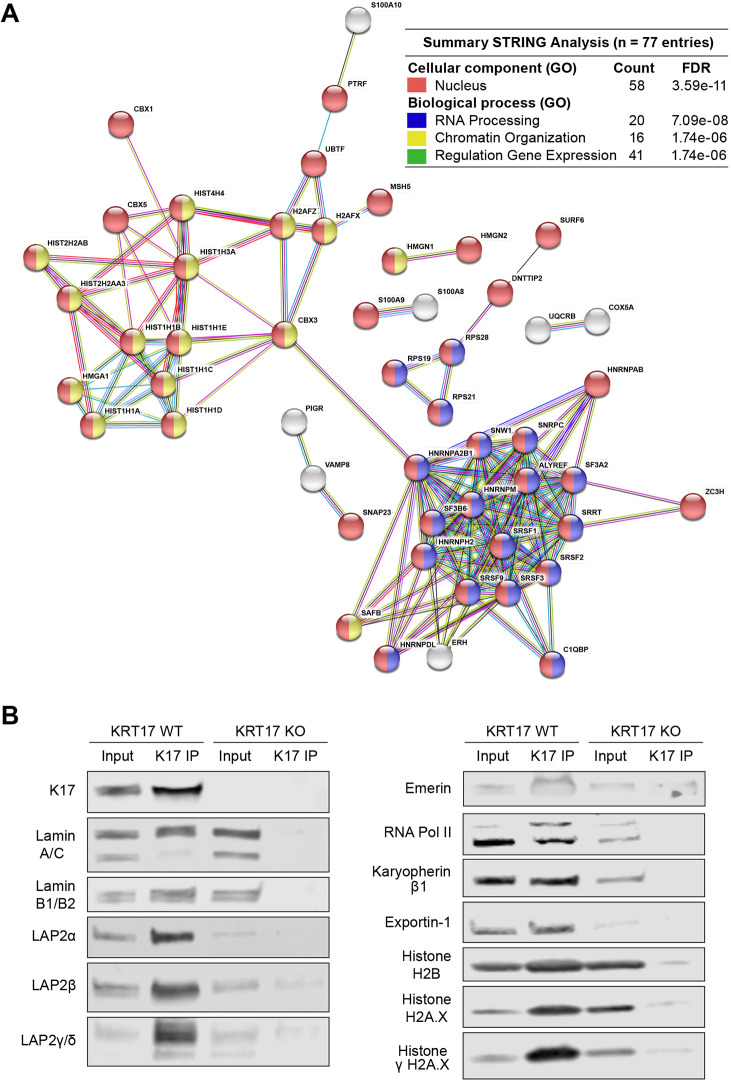
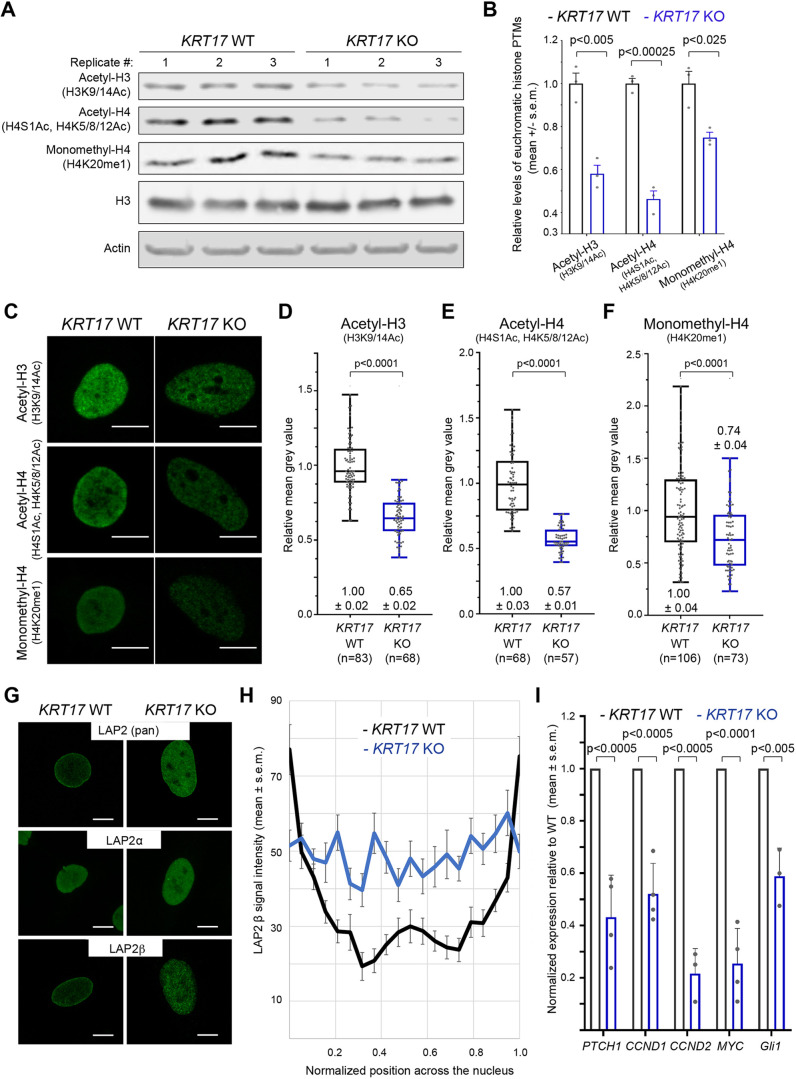
Keratin 17 (KRT17; K17), a non-lamin intermediate filament protein, was recently found to occur in the nucleus. We report here on K17-dependent differences in nuclear morphology, chromatin organization, and cell proliferation. Human tumor keratinocyte cell lines lacking K17 exhibit flatter nuclei relative to normal. Re-expression of wild-type K17, but not a mutant form lacking an intact nuclear localization signal (NLS), rescues nuclear morphology in KRT17-null cells. Analyses of primary cultures of skin keratinocytes from a mouse strain expressing K17 with a mutated NLS corroborated these findings. Proteomics screens identified K17-interacting nuclear proteins with known roles in gene expression, chromatin organization and RNA processing. Key histone modifications and LAP2β (an isoform encoded by TMPO) localization within the nucleus are altered in the absence of K17, correlating with decreased cell proliferation and suppression of GLI1 target genes. Nuclear K17 thus impacts nuclear morphology with an associated impact on chromatin organization, gene expression, and proliferation in epithelial cells.This article has an associated First Person interview with the first author of the paper.

Keywords: Chromatin; Gene expression; Intermediate filament; Keratin; Nucleus; Proliferation.


Conflict of interest statement

Competing interestsThe authors declare no competing or financial interests.

Figures

Fig. 1.
Fig. 1.
Loss of K17 alters nuclear morphology. (A) Orthogonal-view reconstruction of multi-plane confocal micrographs of individual nuclei from HeLa KRT17 WT versus KRT17 knockout (KO) cells. Nuclei are stained with DAPI (blue). Scale bars: 10 μm. (B–D) Quantification of nuclear volume, sphericity and surface area in (B) KRT17 WT versus KO cells HeLa and (C) A431 cells, and in (D) primary MEK cells. Numbers above or below each box-and-whisker plot designate the mean±s.e.m. In the box-and-whisker plots, the box represents the 25–75th percentiles, and the median is indicated. The whiskers show the minimum and maximum values. P-values shown were calculated with a Student's t-test with two-tailed distribution, and two-sample equal variance (homoscedastic); n=cells counted. n.s., not significant. (E) Confocal micrograph maximum intensity projections (MIPs) of nuclei from KRT17 WT and KRT17 KO HeLa cells, immunostained with antibodies against nuclear lamina-associated proteins (green). Scale bars: 10 μm.
Fig. 2.
Fig. 2.
Impact of K17 on nuclear morphology requires an intact NLS. (A) Confocal micrograph MIPs of HeLa KRT17 KO cells transiently transfected (48 h) with GFP, GFP–K17 WT or GFP–K17ΔNLS (green). Nuclei are stained with DAPI (blue). Scale bars: 10 μm. (B,C) Quantified area (2-dimensional; 2D) of nuclei from (B) HeLa KRT17 KO and (C) A431 KRT17 KO cells expressing GFP, GFP–K17 WT or GFP–K17ΔNLS. (D,E) Quantified surface area (3-dimensional; 3D) of nuclei from (D) HeLa KRT17 KO and (E) A431 KRT17 KO cells expressing GFP, GFP–K17 WT or GFP–K17ΔNLS. (F) Confocal MIPs for K17 (red) in MEKs from Krt17+/ΔNLS and Krt17ΔNLS/ΔNLS mice. Nuclei are stained with DAPI (blue). Scale bars: 10 μm. (G) Quantified area of nuclei from primary MEKs from Krt17+/−, Krt17−/− and Krt17ΔNLS/ΔNLS mice. (H) Quantified area of nuclei from Krt17ΔNLS/ΔNLS MEKs untransfected or transfected with GFP-K17 WT. For B–E, G, H, numbers above or below each box-and-whisker plot represent the mean±s.e.m. In the box-and-whisker plots, the box represents the 25–75th percentiles, and the median is indicated. The whiskers show the minimum and maximum values. P-values shown were calculated with a Student's t-test with two-tailed distribution, and two-sample equal variance (homoscedastic). n.s., not significant.
Fig. 3.
Fig. 3.
Screen for K17-interaction proteins in the nucleus. (A) STRING-db online analysis (v10.5; http://string-db.org/) of the 77 most-enriched MS-identified co-immunoprecipitated proteins in A431 nuclear extracts; 58 (75%) have at least one known function in the nucleus according to UniProt Gene Ontology (GO) Biological Process terms. Each circle or node represents one of the 77 candidate interactors, labeled with gene names. Lines connecting nodes indicate a known functional protein–protein interaction; line thickness reflects strength of the data available [only proteins with at least one connection are shown (n=52), explaining why K17 is not part of this network]. Red color reflects known nuclear localization; blue reflects a role in RNA processing; yellow reflects a role in chromatin organization; and green reflects a role in regulation of gene expression (multi-coloring reflects >1 role). Inset table (upper right) highlights key findings. Count, number of entries for a particular GO term (out of 77); FDR, false discovery rate. (B) Western blots of proteins (e.g. nuclear lamina-associated proteins, RNA polymerase II, nuclear import/export machinery, and histones) that co-immunoprecipitate with K17 in subcellular fractions enriched for nuclear proteins. Blots are representative of at least two, typically three, independent experiments.
Fig. 4.
Fig. 4.
Loss of K17 alters histone modifications and LAP2β localization. (A) Western blots of whole-cell lysates from KRT17 WT and KRT17 KO cells (n=3 biological replicates each). Primary antibody used shown at left. (B) Quantification (mean±s.e.m.) of band intensities in (A) normalized to β-actin loading control. P-values shown were calculated with a Student's t-test with two-tailed distribution, and two-sample equal variance (homoscedastic). (C) Confocal maximum intensity projections (MIPs) of KRT17 WT and KRT17 KO cells immunostained for acetylated histone H3 (H3K9/K14Ac), acetylated histone H4 (H4S1Ac, H4K5/K8/K12Ac) or monomethylated Histone H4 (H4K20me1) (green). Scale bars: 10 μm. (D–F) Quantification of mean signal intensity for (D) acetylated histone H3 (H3K9/K14Ac), (E) acetylated histone H4 (H4S1Ac, H4K5/K8/K12Ac), and (F) monomethylated histone H4 (H4K20me1) in KRT17 WT versus KRT17 KO cells. Numbers above or below each box-and-whisker plot are mean±s.e.m. relative to KRT17 WT. In the box-and-whisker plots, the box represents the 25–75th percentiles, and the median is indicated. The whiskers show the minimum and maximum values. P-values shown were calculated with a Student's t-test with two-tailed distribution, and two-sample equal variance (homoscedastic). (G) Confocal MIPs of KRT17 WT and KRT17 KO HeLa cells immunostained for LAP2 (pan-isoform), LAP2α, and LAP2β (green). Scale bars: 10 μm. (H) Quantification of signal intensity across line scans through individual nuclei from KRT17 WT and KRT17 KO HeLa cells (mean±s.e.m.; n=20 nuclei per genotype). Signal at the peripheries of the x-axis (i.e. normalized positions 0.00–0.05 and 0.95–1.00) reflect LAP2β signal at the nuclear envelope. Signal in the interior of the x-axis (i.e. normalized positions 0.05–0.95) reflect LAP2β signal in nucleoplasm. (I) Normalized expression of select GLI1-target genes in KRT17 KO relative to KRT17 WT HeLa cells (mean±s.e.m.; n=3–4 biological replicates per mRNA). P-values shown were calculated with a Student's t-test with two-tailed distribution, and two-sample equal variance (homoscedastic).

References

    1. Akoumianaki T., Kardassis D., Polioudaki H., Georgatos S. D. and Theodoropoulos P. A. (2009). Nucleocytoplasmic shuttling of soluble tubulin in mammalian cells. J. Cell Sci. 122, 1111-1118. 10.1242/jcs.043034 - DOI - PubMed
    1. Bettinger B. T., Gilbert D. M. and Amberg D. C. (2004). Actin up in the nucleus. Nat. Rev. Mol. Cell Biol. 5, 410-415. 10.1038/nrm1370 - DOI - PubMed
    1. Bianchi N., Depianto D., McGowan K., Gu C. and Coulombe P. A. (2005). Exploiting the keratin 17 gene promoter to visualize live cells in epithelial appendages of mice. Mol. Cell Biol.25, 7249-7259. 10.1128/MCB.25.16.7249-7259.2005 - DOI - PMC - PubMed
    1. Blake D. A., Sahiner N., John V. T., Clinton A. D., Galler K. E., Walsh M., Arosemena A., Johnson P. Y. and Ayyala R. S. (2006). Inhibition of cell proliferation by mitomycin C incorporated into P(HEMA) hydrogels. J. Glaucoma 15, 291-298. 10.1097/01.ijg.0000212236.96039.9c - DOI - PubMed
    1. Bouameur J.-E. and Magin T. M. (2017). Lessons from animal models of cytoplasmic intermediate filament proteins. Subcell. Biochem. 82, 171-230. 10.1007/978-3-319-49674-0_7 - DOI - PubMed

Publication types