. 2020 Oct 2;6(40):eabc5802.
doi: 10.1126/sciadv.abc5802. Print 2020 Oct.

Integrative glycoproteomics reveals protein N-glycosylation aberrations and glycoproteomic network alterations in Alzheimer's disease

Affiliations

Integrative glycoproteomics reveals protein N-glycosylation aberrations and glycoproteomic network alterations in Alzheimer's disease

Qi Zhang et al. Sci Adv. .

Abstract

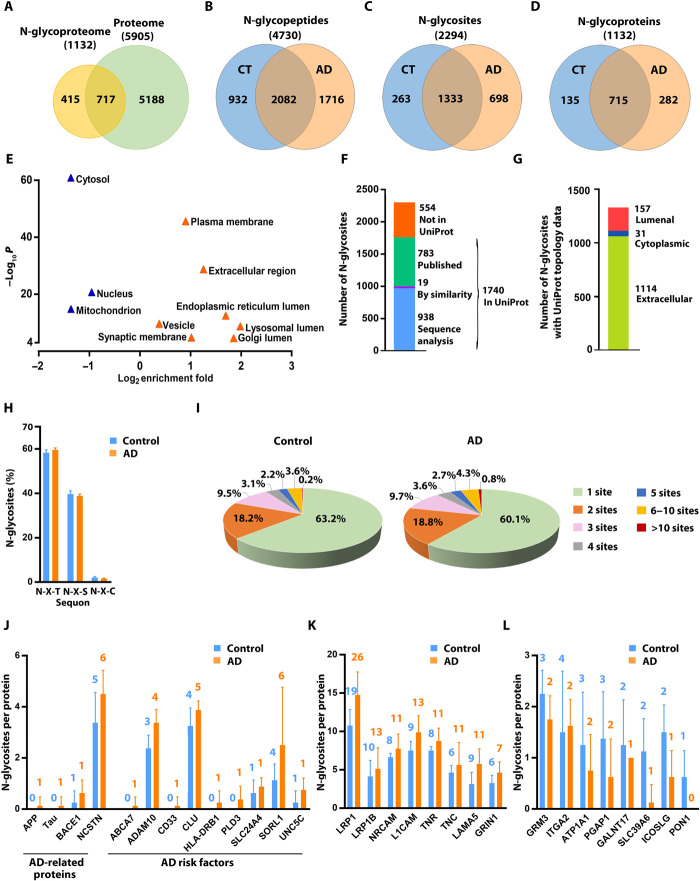
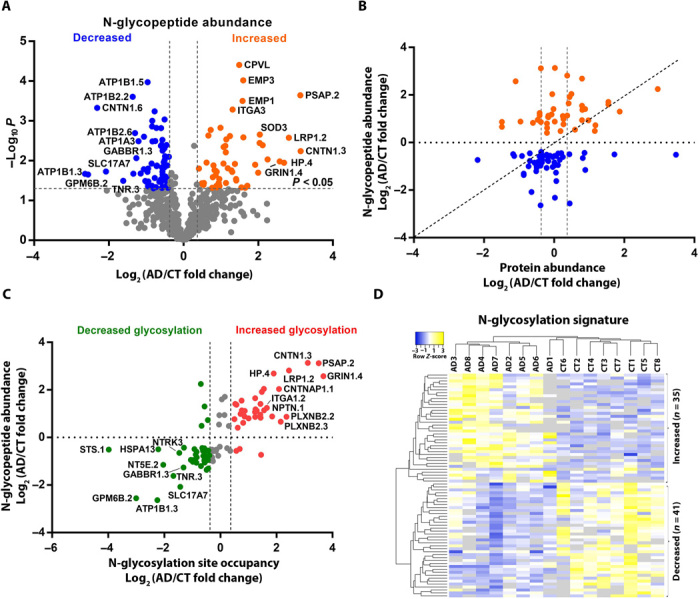
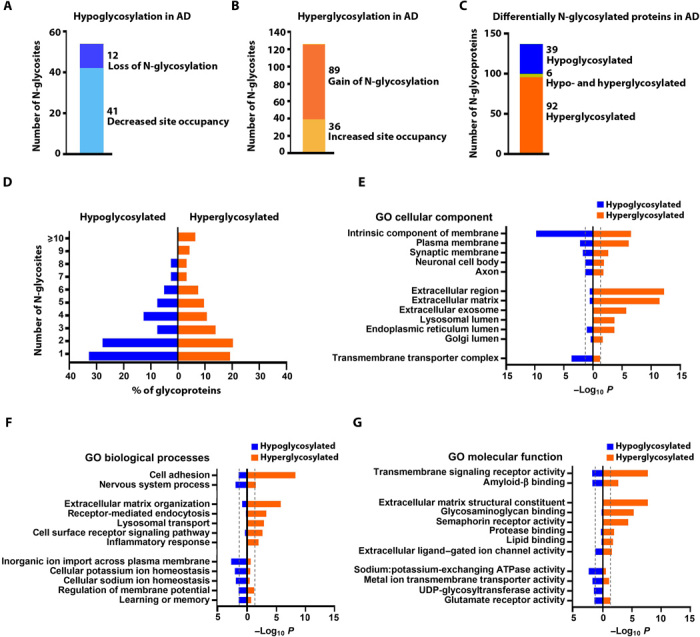
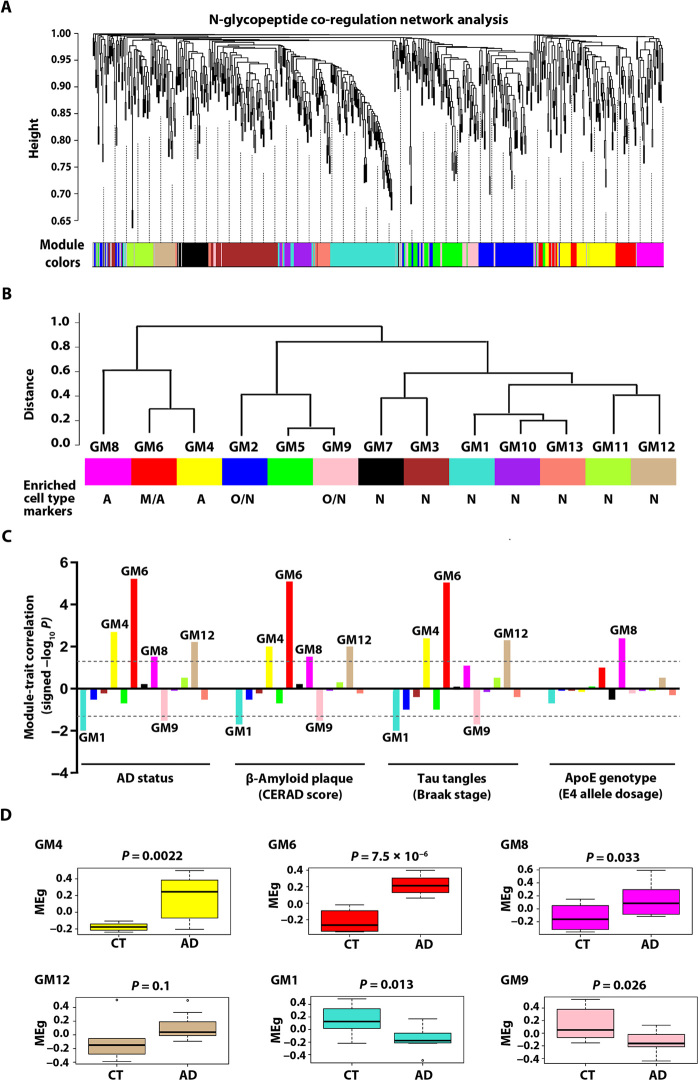
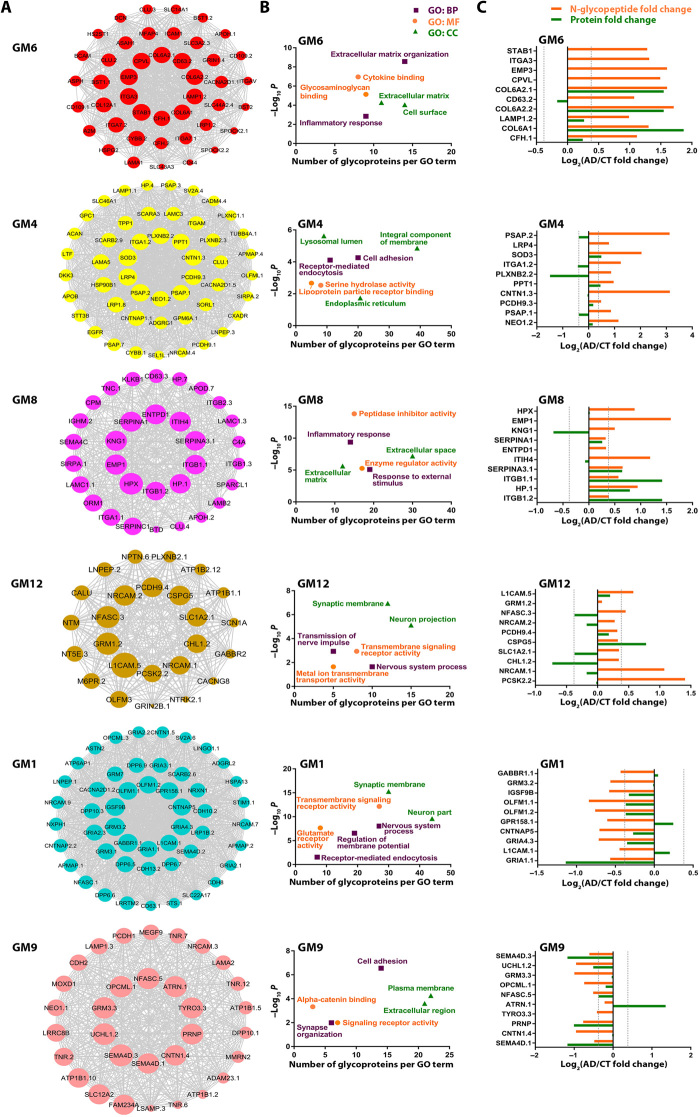
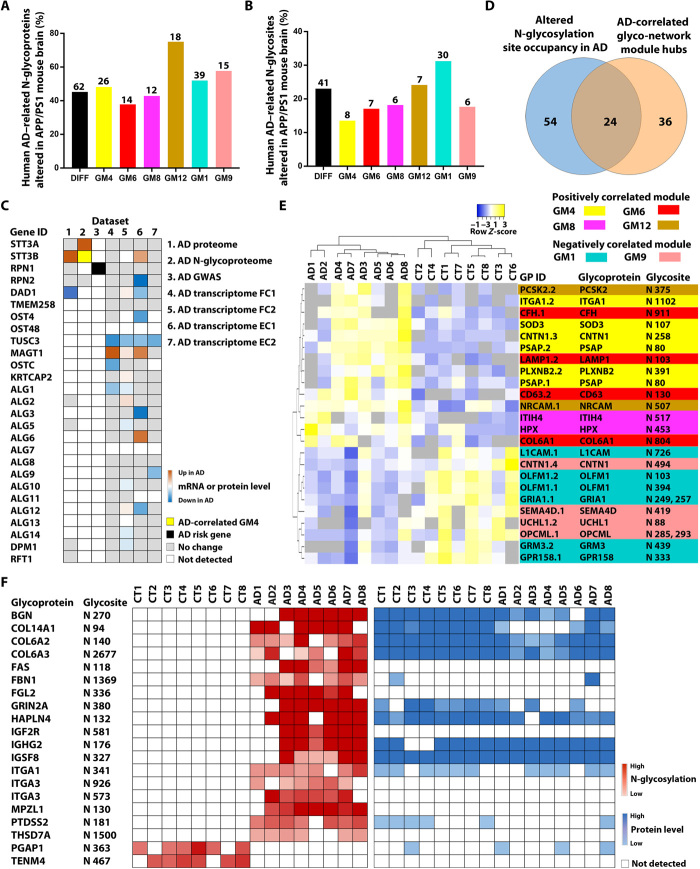
Protein N-glycosylation plays critical roles in controlling brain function, but little is known about human brain N-glycoproteome and its alterations in Alzheimer's disease (AD). Here, we report the first, large-scale, site-specific N-glycoproteome profiling study of human AD and control brains using mass spectrometry-based quantitative N-glycoproteomics. The study provided a system-level view of human brain N-glycoproteins and in vivo N-glycosylation sites and identified disease signatures of altered N-glycopeptides, N-glycoproteins, and N-glycosylation site occupancy in AD. Glycoproteomics-driven network analysis showed 13 modules of co-regulated N-glycopeptides/glycoproteins, 6 of which are associated with AD phenotypes. Our analyses revealed multiple dysregulated N-glycosylation-affected processes and pathways in AD brain, including extracellular matrix dysfunction, neuroinflammation, synaptic dysfunction, cell adhesion alteration, lysosomal dysfunction, endocytic trafficking dysregulation, endoplasmic reticulum dysfunction, and cell signaling dysregulation. Our findings highlight the involvement of N-glycosylation aberrations in AD pathogenesis and provide new molecular and system-level insights for understanding and treating AD.


Figures

Fig. 1
Fig. 1. Quantitative N-glycoproteomics analysis of AD and control brains.
(A) Venn diagram comparison of identified proteins in human brain N-glycoproteome versus proteome. (B to D) Comparisons of identified N-glycopeptides (B), N-glycosites (C), and N-glycoproteins (D) in AD versus control (CT) brains. (E) GO localization categories enriched or underrepresented in the N-glycoproteome compared to the proteome with Benjamini-Hochberg false discovery rate (FDR)–corrected P < 0.0001. (F) Match of the identified N-glycosites to UniProt database of annotated N-glycosites. (G) Mapping of the identified N-glycosites to proteins with UniProt-annotated topology. (H) Distribution of the identified N-glycosites with the indicated tripeptide sequon is shown as means ± SD (n = 8 cases per AD or control group). (I) Pie charts showing the proportions of singly and multiply N-glycosylated proteins with the indicated number of in vivo N-glycosites per protein in AD and controls. (J to L) Bar graphs showing the number of N-glycosites identified on AD-related proteins and risk factors (J) and examples of identified glycoproteins with increased (K) or reduced (L) number of in vivo N-glycosites in AD compared to controls. Data are shown as means ± SD (n = 8 cases per group), and the total number of identified N-glycosites per protein is indicated above each bar.
Fig. 2
Fig. 2. Disease-associated changes in N-glycopeptide abundance and N-glycosylation site occupancy in AD.
(A) Volcano plot of individual N-glycopeptide abundance fold changes in AD versus control (log2 scale) and corresponding P values (−log10 scale) showing identification of 118 significantly altered (>1.3-fold change, P < 0.05) glycopeptides in AD with top 20 glycopeptides labeled. (B) Scatter plot showing that glycopeptide abundance changes of many AD-associated N-glycopeptides are not due to altered protein abundance. (C) Scatter plot showing at least ±1.3-fold changes in N-glycosylation site occupancy for most of the identified AD-associated N-glycopeptides with top 20 glycopeptides labeled. (D) Unsupervised hierarchical clustering of 16 individual cases based on the identified 76 N-glycopeptides representing 77 glycosites with altered N-glycosylation site occupancy. The N-glycopeptide sequences and corresponding N-glycosite data are provided in table S3.
Fig. 3
Fig. 3. Analysis and annotation of differentially N-glycosylated proteins in AD brain.
(A) Hypoglycosylation includes in vivo N-glycosites with decreased N-glycosylation site occupancy or a complete loss of N-glycosylation in AD. (B) Hyperglycosylation includes N-glycosites with increased N-glycosylation site occupancy or a gain of N-glycosylation in AD. (C) Differentially N-glycosylated proteins in AD include the identified hypoglycosylated or hyperglycosylated proteins and aberrantly glycosylated proteins with both hyperglycosylated and hypoglycosylated N-glycosites. (D) Distribution of AD-associated hypoglycosylated or hyperglycosylated proteins carrying the indicated number of in vivo N-glycosites per protein. (E to G) GO cellular component, biological process, and molecular function categories enriched in hypoglycosylated or hyperglycosylated proteins in AD. Significant enrichment is shown by Benjamini-Hochberg FDR-corrected P < 0.05 (outside the dashed line). UDP, uridine diphosphate.
Fig. 4
Fig. 4. N-glycopeptide co-regulation network analysis and identification of AD-related glyco-network modules.
(A) N-glycopeptide WGCNA cluster dendrogram using dynamic tree cutting reveals 13 glyco-network modules (color-coded) of co-regulated N-glycopeptides. (B) Glyco-network intermodular relationships of the identified 13 N-glycopeptide co-regulation modules. Modules with significant enrichment for markers of astrocyte (A), microglia (M), oligodendrocyte (O), and/or neuron (N) are indicated, and the FDR-corrected P values for enrichment are provided in fig. S2. (C) Module-trait correlation between each of the 13 glyco-network modules and each AD-relevant phenotypic or genotypic trait is shown by signed −log10 P to indicate the significance and direction of the correlation. Modules with significant correlation (P < 0.05) are labeled. (D) Box plots of module eigenglycopeptide (MEg) values in AD and control cases for each AD-related module, with differences in module eigenglycopeptide between AD and control shown by Kruskal-Wallis test P values.
Fig. 5
Fig. 5. Network depiction and analyses of AD-associated glyco-network modules.
(A) N-glycopeptide co-regulation network plots of AD-associated modules with top 10 hub glycopeptides/glycoproteins shown in the center of each plot. The size of nodes corresponds to kME-based intramodular connectivity, and a maximum of top 50 glycopeptides are shown for each module. The full list of N-glycopeptide sequences and corresponding N-glycoproteins and N-glycosites in each module and their kME values are provided in table S6A. (B) Top GO biological process (BP), molecular function (MF), and cellular component (CC) categories enriched in each AD-associated module are shown by Benjamini-Hochberg FDR-corrected P values (−log10 scale) and plotted against the number of glycoproteins per GO term. (C) N-glycopeptide abundance fold changes in AD versus control for top 10 hub glycopeptides in each AD-associated module are shown with their corresponding protein abundance changes measured by proteomics.
Fig. 6
Fig. 6. Integrative analyses to identify potential causes of altered N-glycosylation in AD and N-glycopeptide biomarkers.
(A and B) Comparison of N-glycoproteome data between human AD and APP/PS1 mouse brains shows the percentages (bars) and the numbers (indicated above each bar) of the identified human AD–related N-glycoproteins (A) and N-glycosites (B) that were altered in the APP/PS1 mouse brain for the differential N-glycosylation datasets (DIFF) and each of human AD–correlated glyco-network modules. (C) Integration of seven datasets reveals disease-associated changes in N-glycosylation–related genes/proteins in human AD cases. AD transcriptome FC1 and FC2 are datasets from the frontal cortex, and EC1 and EC2 are from the entorhinal cortex. (D) Venn diagram showing the overlap between glycopeptides with altered N-glycosylation site occupancy in AD and top hub glycopeptides of AD-associated glyco-network modules. (E) Unsupervised hierarchical clustering based on the glycopeptide abundance profiles of the identified 24 hub glycopeptides with altered N-glycosylation site occupancy, showing clear separation of AD from control cases and of positively correlated glyco-network module hubs from negatively correlated module hubs. (F) Heatmaps showing the abundances of 20 glycopeptides containing N-glycosite with a gain or loss of N-glycosylation in AD and their corresponding protein abundances measured from proteomics analysis.

Similar articles

Cited by

References

    1. Scheltens P., Blennow K., Breteler M. M., de Strooper B., Frisoni G. B., Salloway S., Van der Flier W. M., Alzheimer's disease. Lancet 388, 505–517 (2016). - PubMed
    1. Soejitno A., Tjan A., Purwata T. E., Alzheimer's disease: Lessons learned from amyloidocentric clinical trials. CNS Drugs 29, 487–502 (2015). - PubMed
    1. Narayanan M., Huynh J. L., Wang K., Yang X., Yoo S., McElwee J., Zhang B., Zhang C., Lamb J. R., Xie T., Suver C., Molony C., Melquist S., Johnson A. D., Fan G., Stone D. J., Schadt E. E., Casaccia P., Emilsson V., Zhu J., Common dysregulation network in the human prefrontal cortex underlies two neurodegenerative diseases. Mol. Syst. Biol. 10, 743 (2014). - PMC - PubMed
    1. Zhang Q., Ma C., Gearing M., Wang P. G., Chin L. S., Li L., Integrated proteomics and network analysis identifies protein hubs and network alterations in Alzheimer's disease. Acta Neuropathol. Commun. 6, 19 (2018). - PMC - PubMed
    1. Sancesario G. M., Bernardini S., Alzheimer's disease in the omics era. Clin. Biochem. 59, 9–16 (2018). - PubMed

Publication types