. 2020 Oct 2;5(52):eaba0759.
doi: 10.1126/sciimmunol.aba0759.

Regulatory T cell control of systemic immunity and immunotherapy response in liver metastasis

Affiliations

Regulatory T cell control of systemic immunity and immunotherapy response in liver metastasis

James C Lee et al. Sci Immunol. .

Abstract

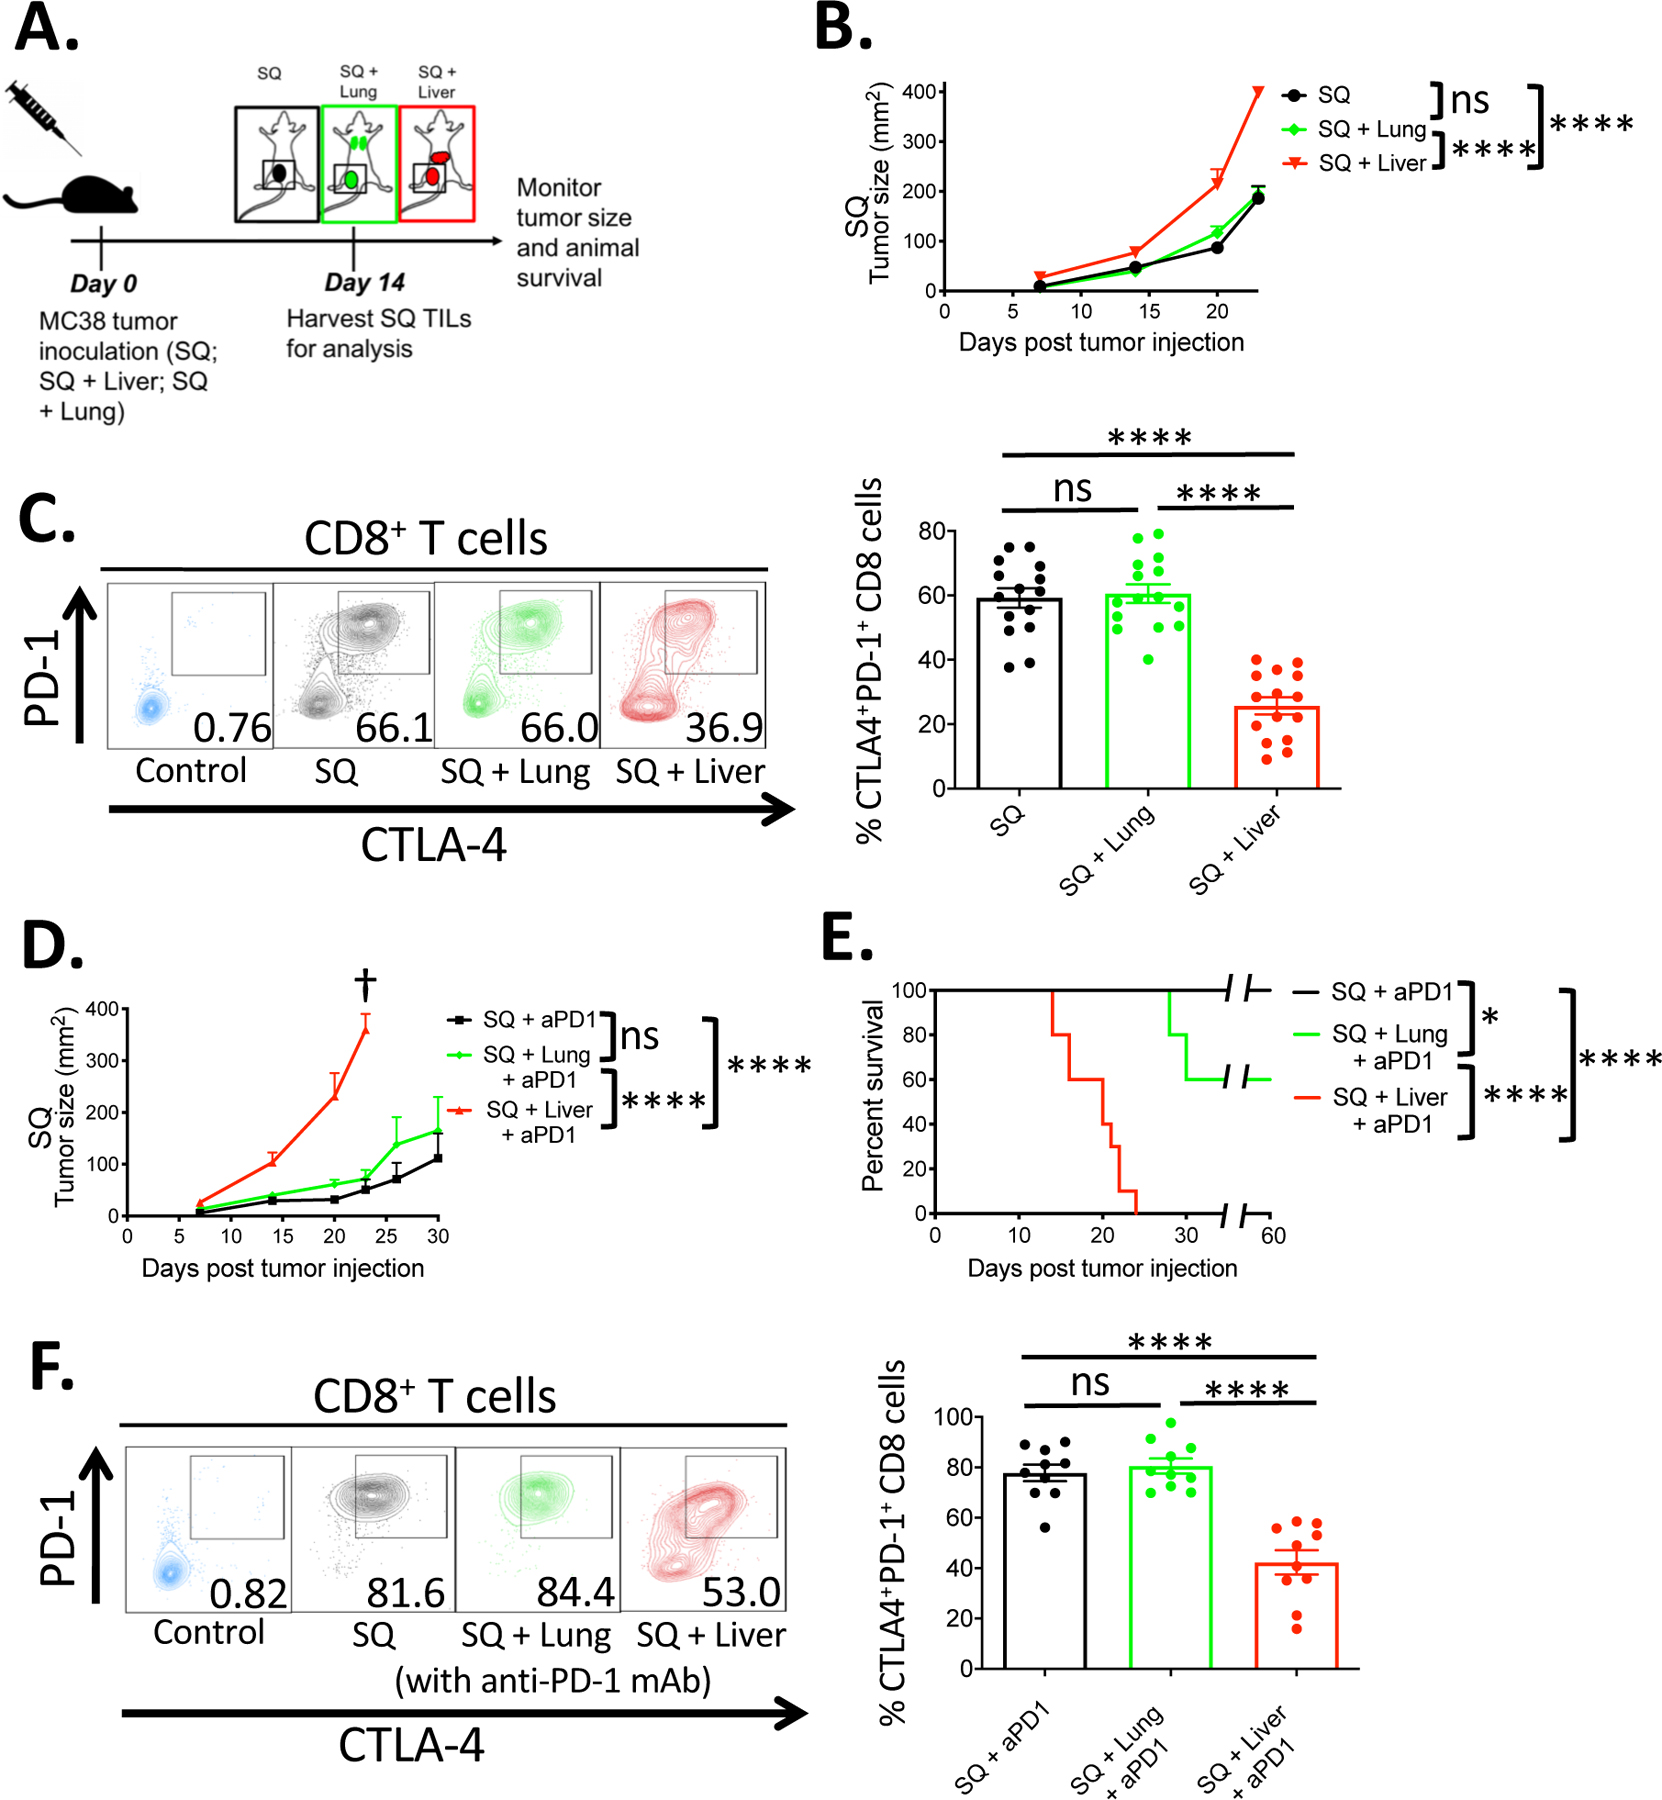
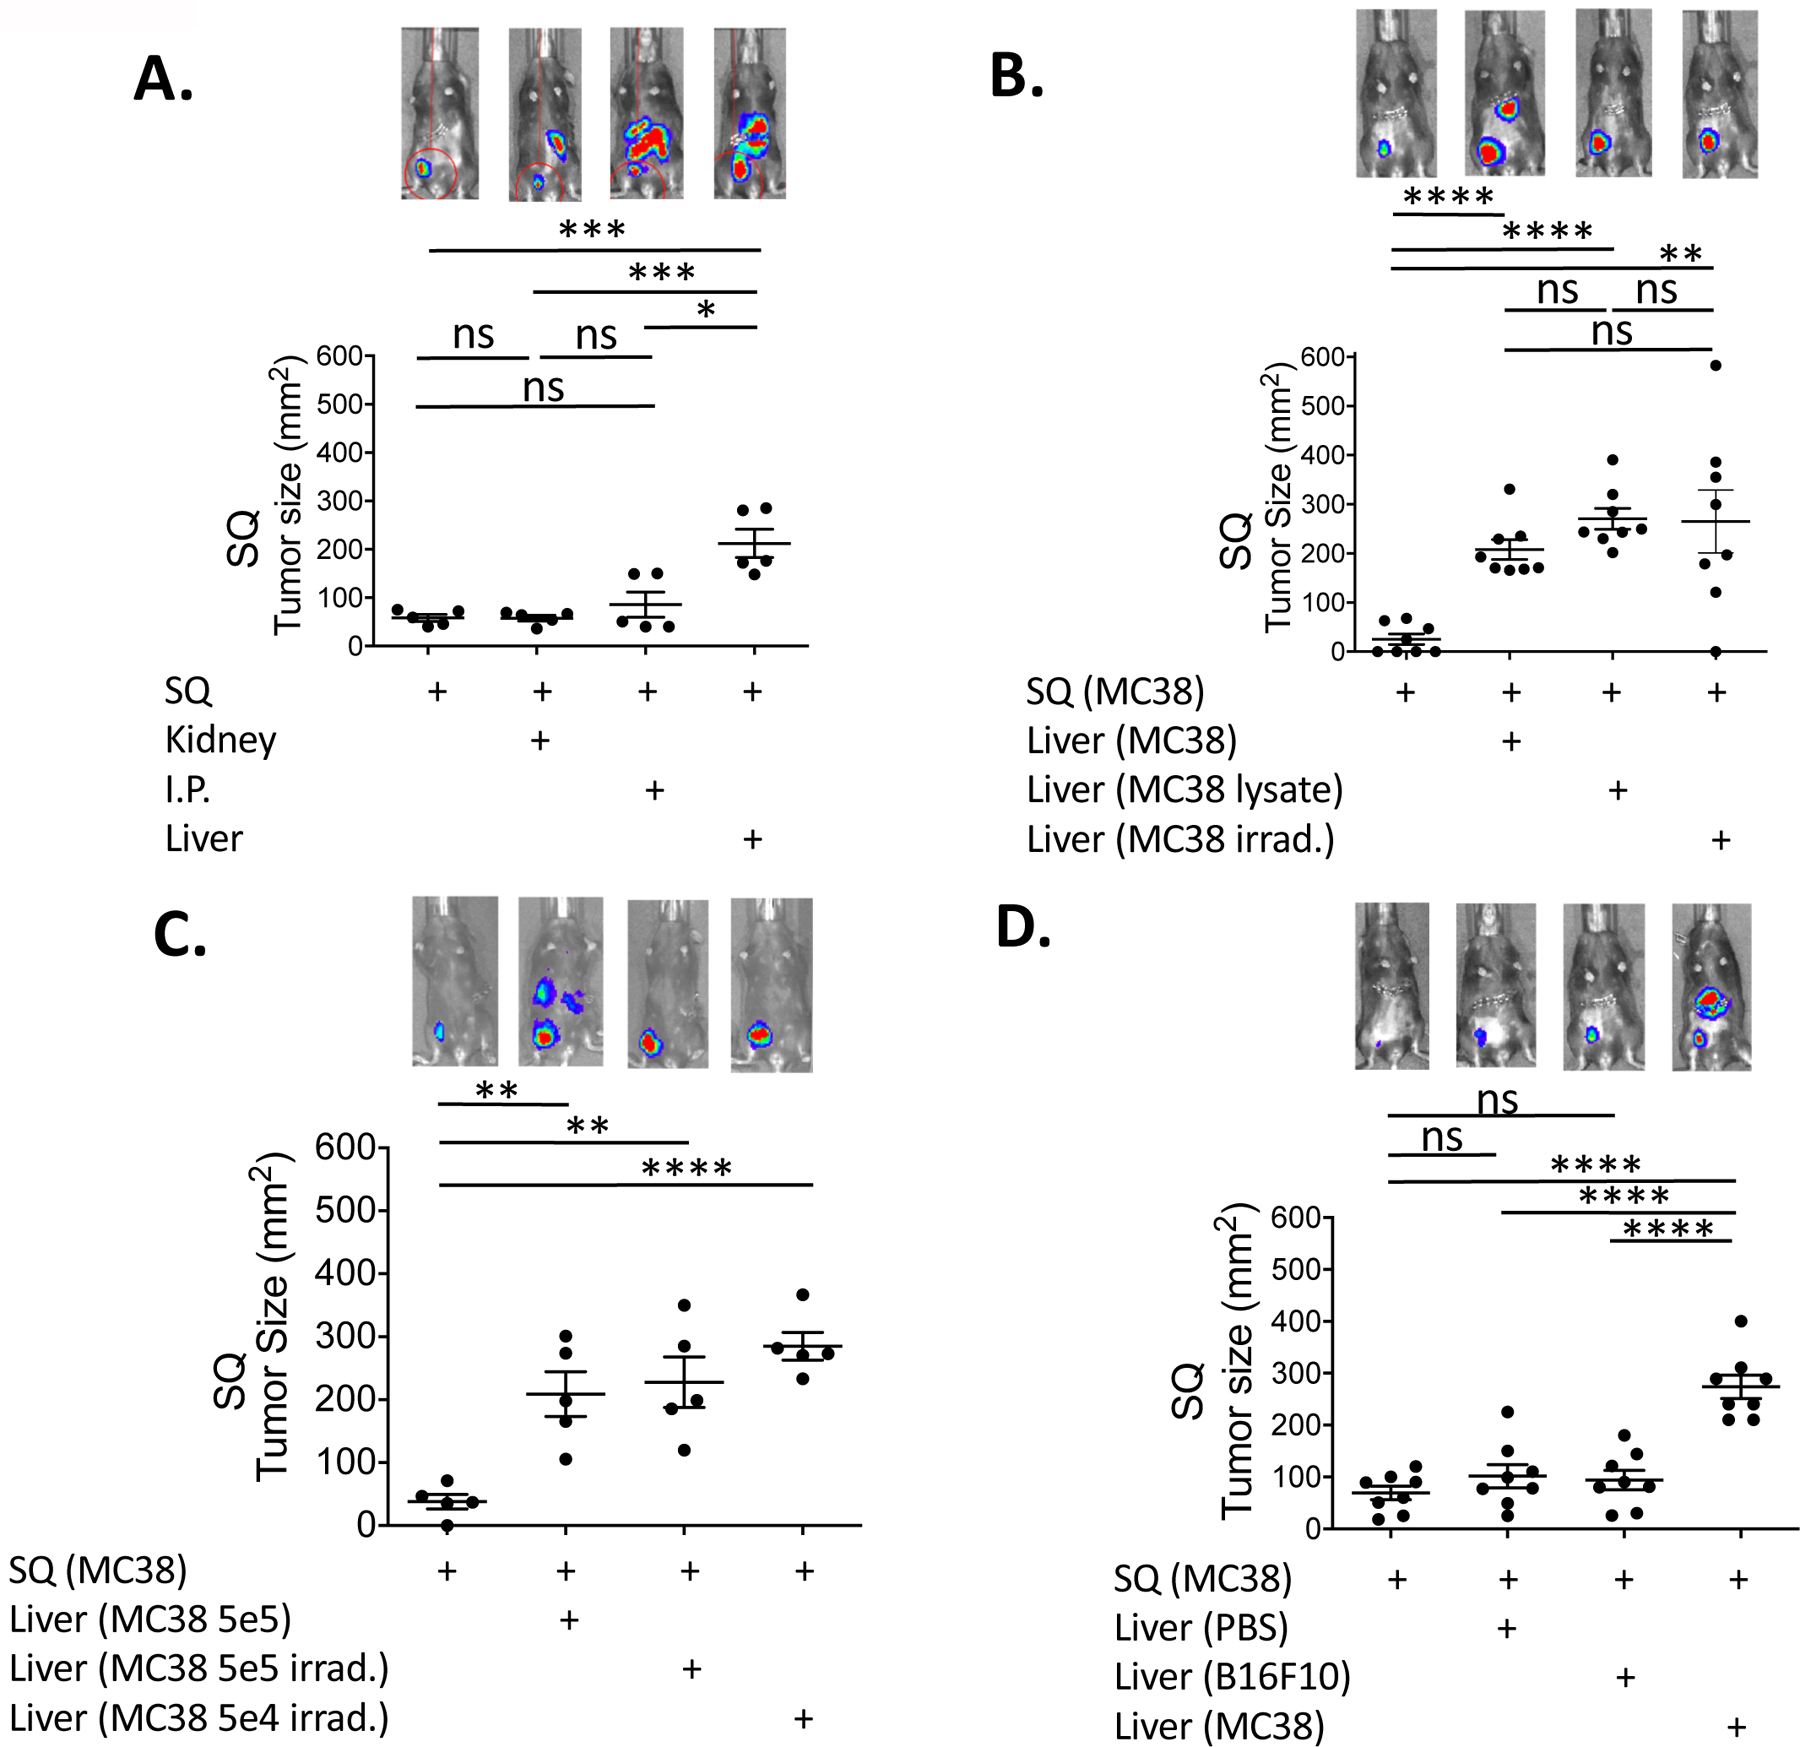
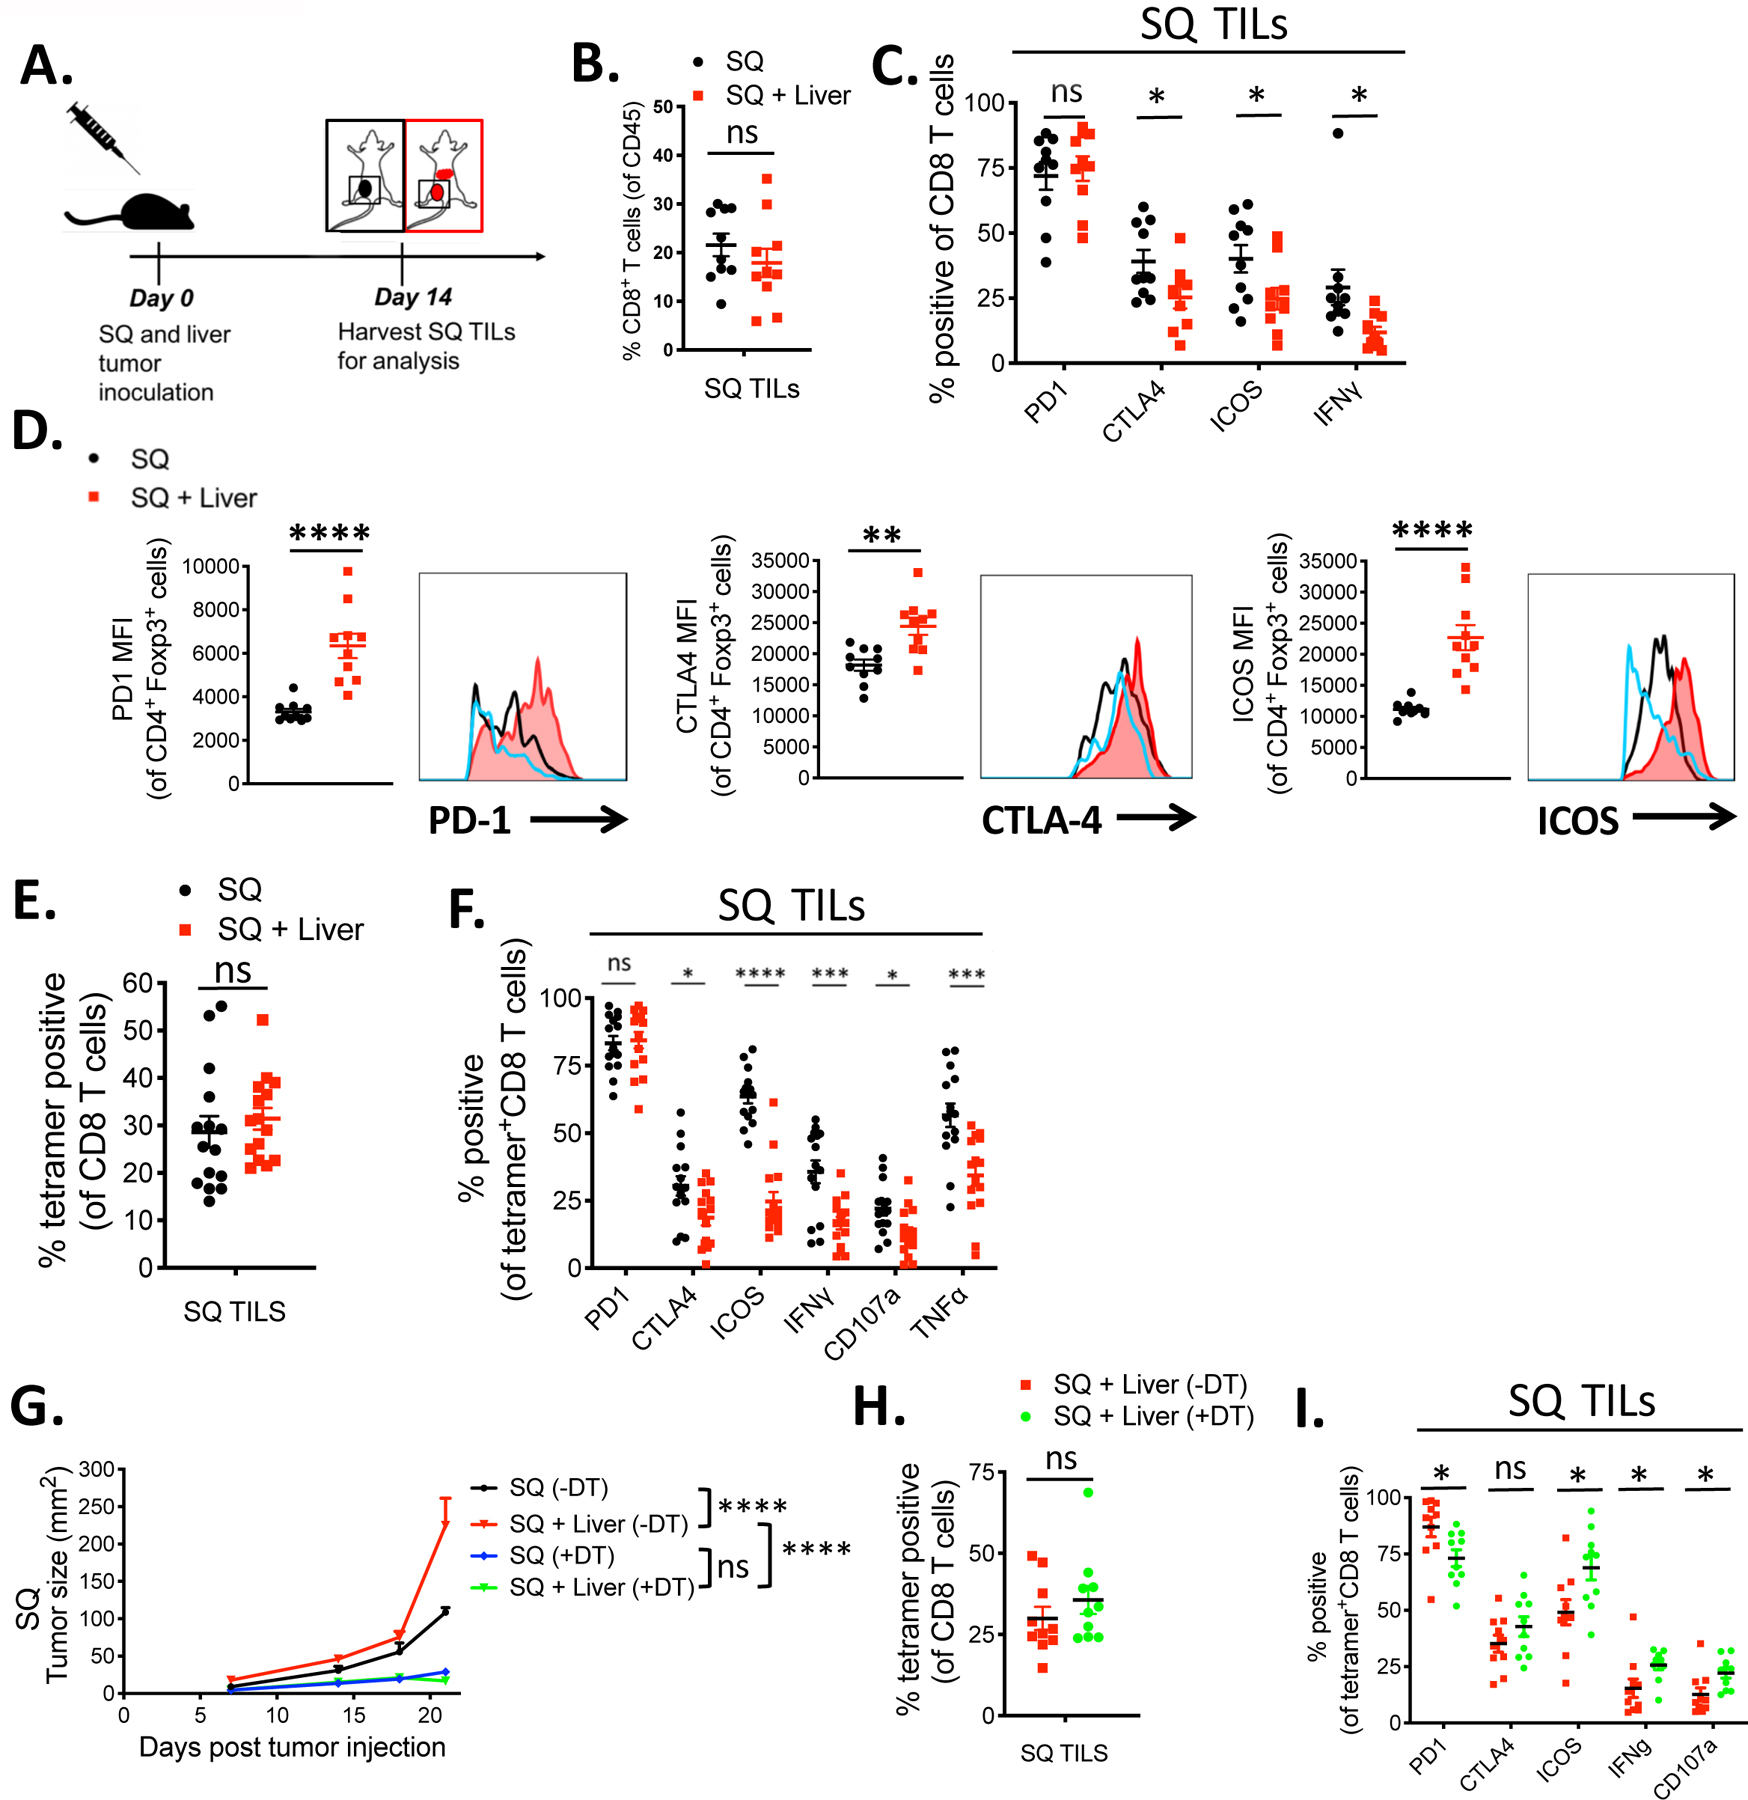
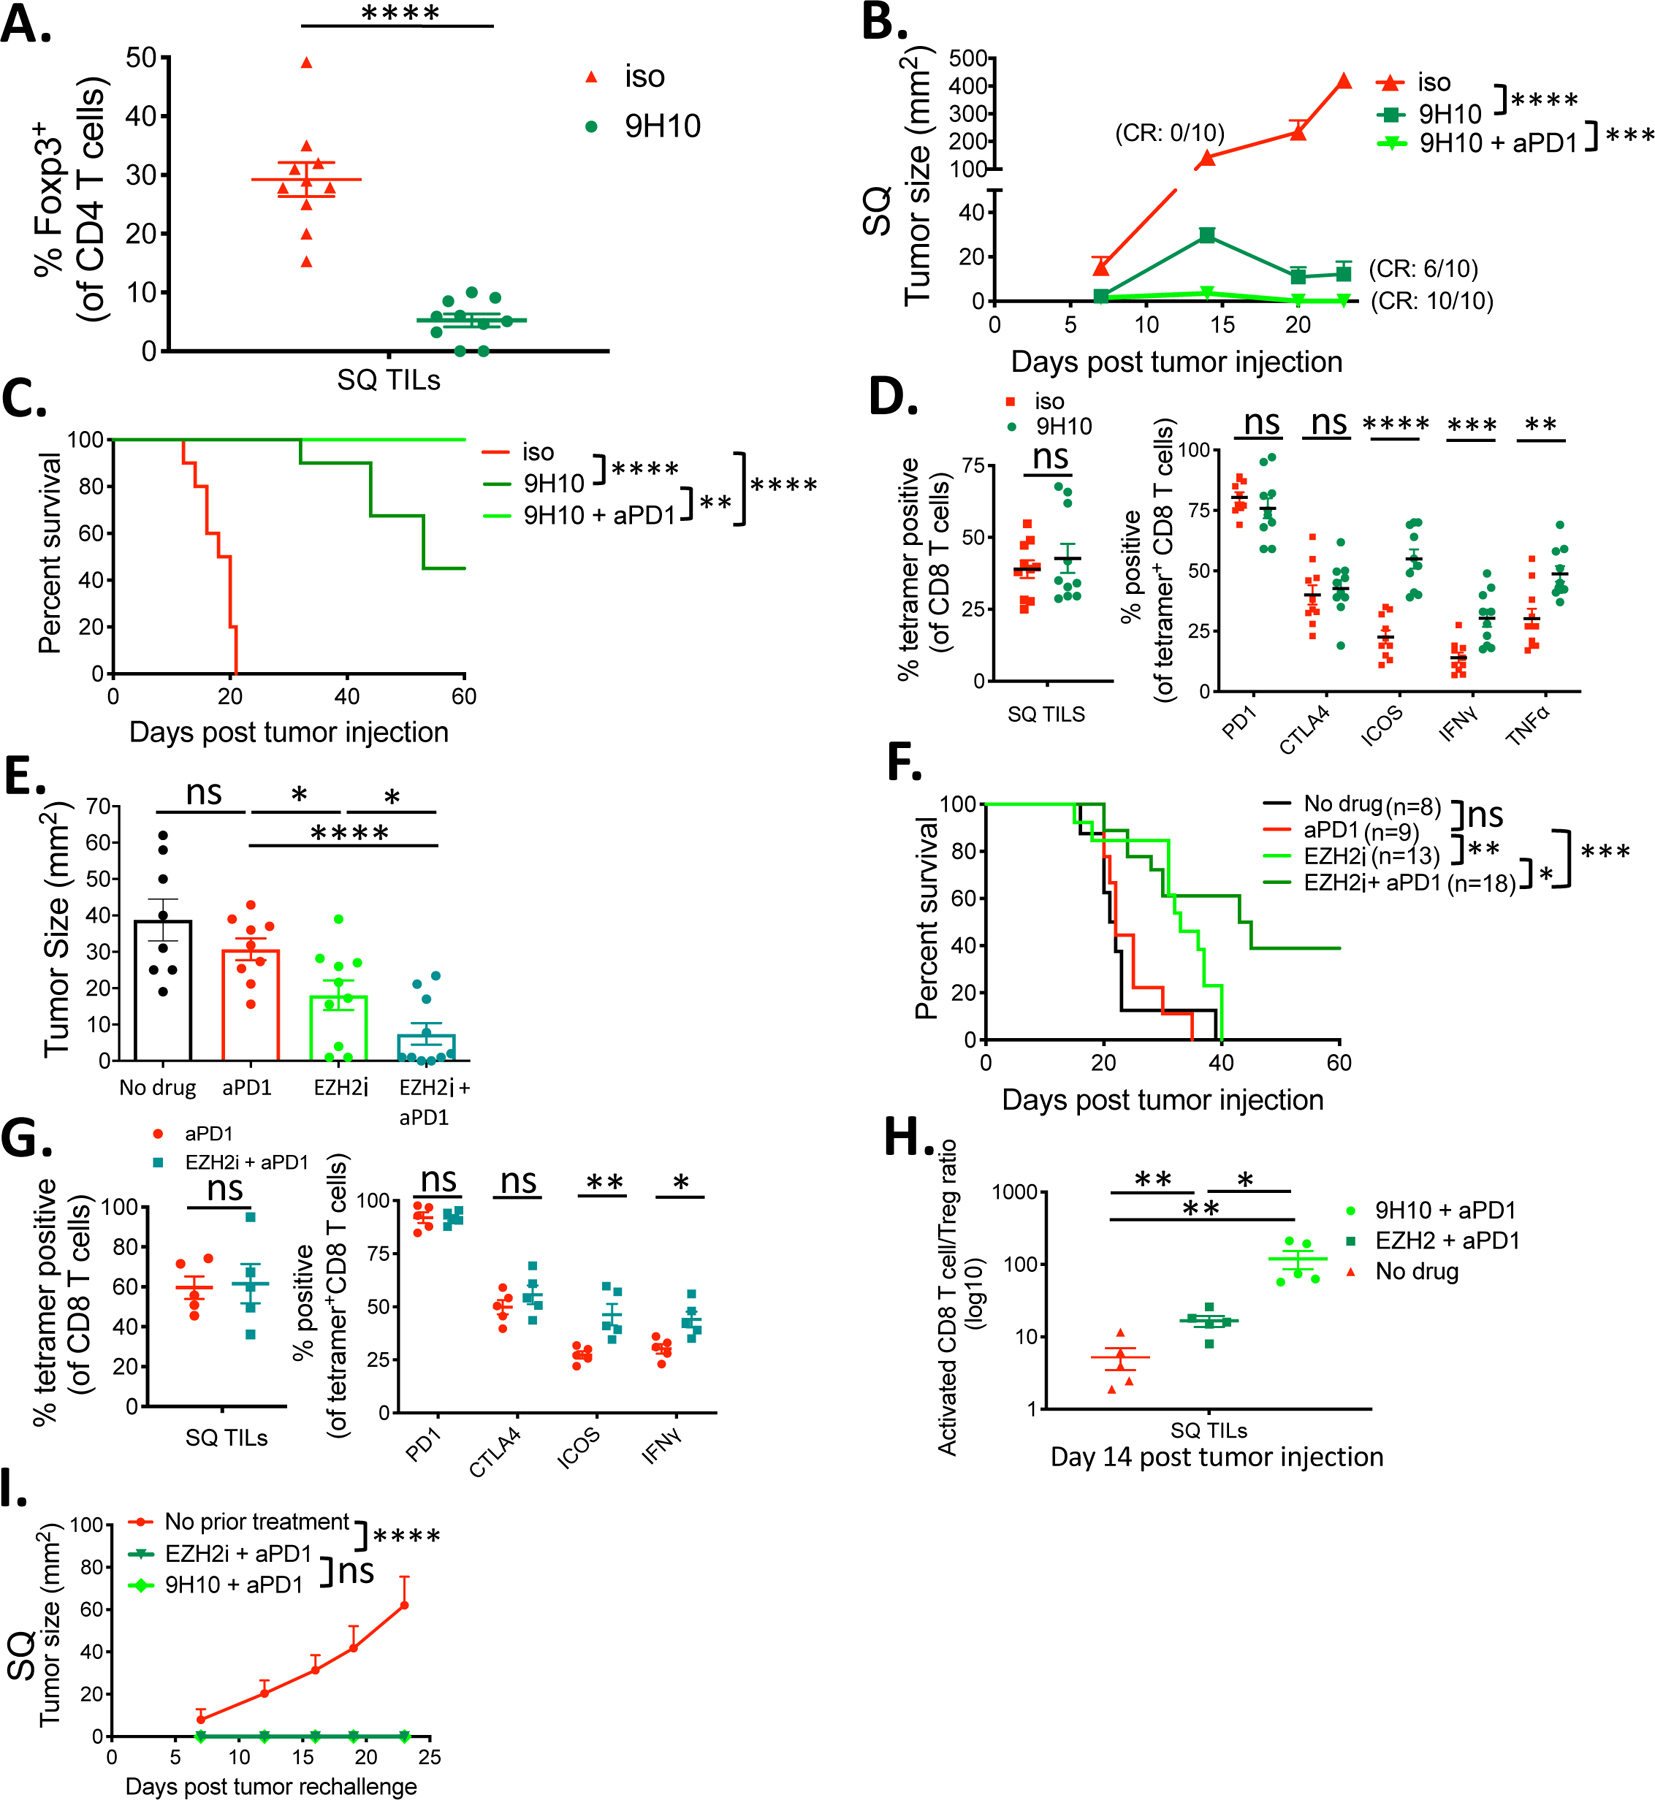
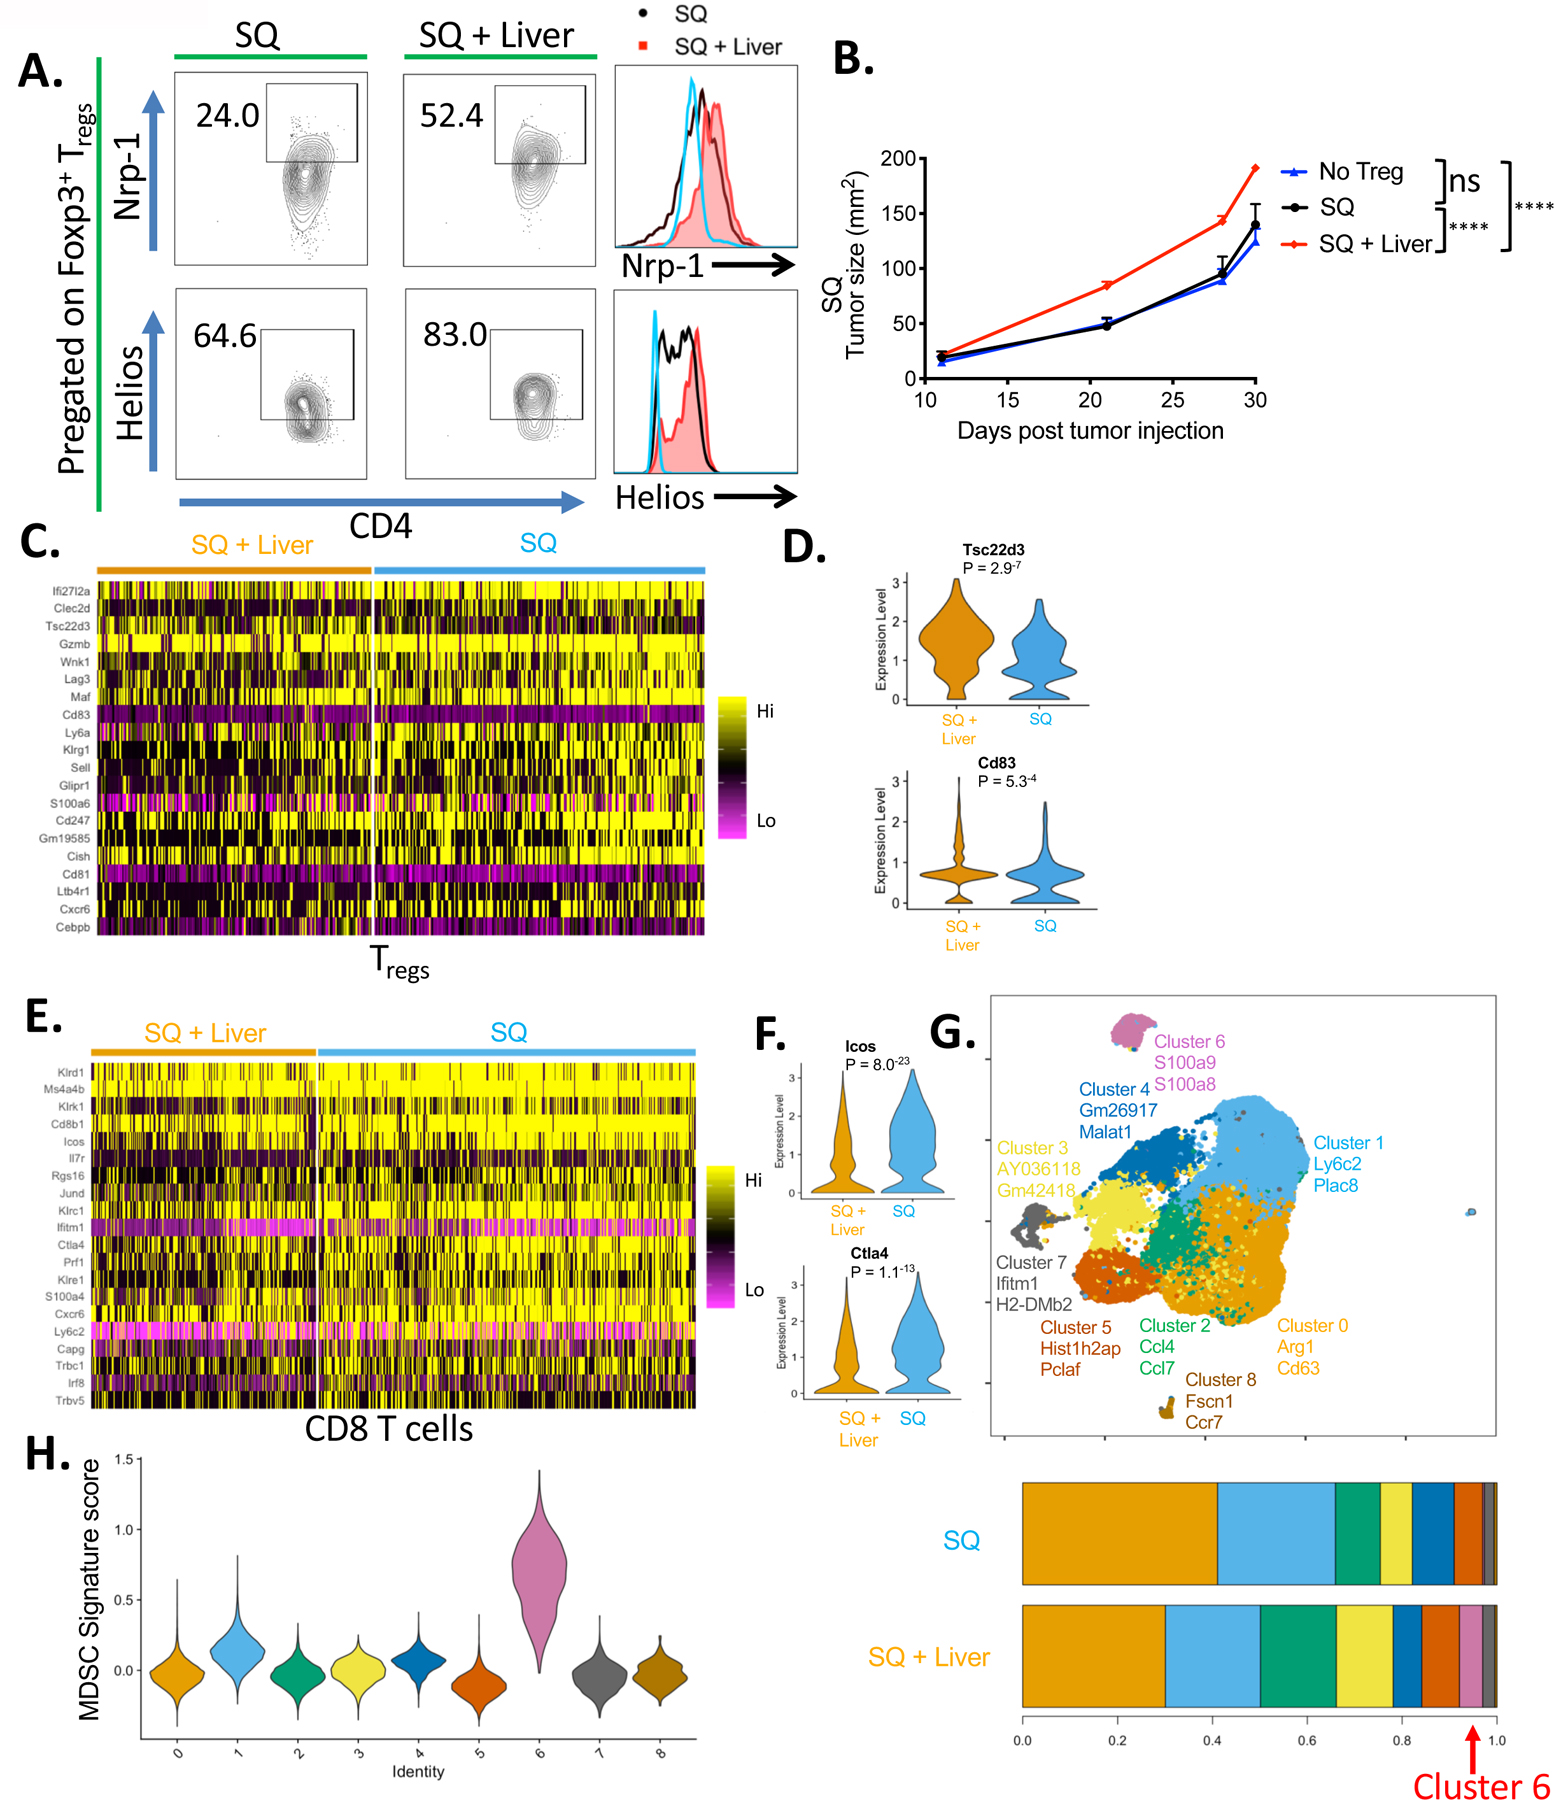
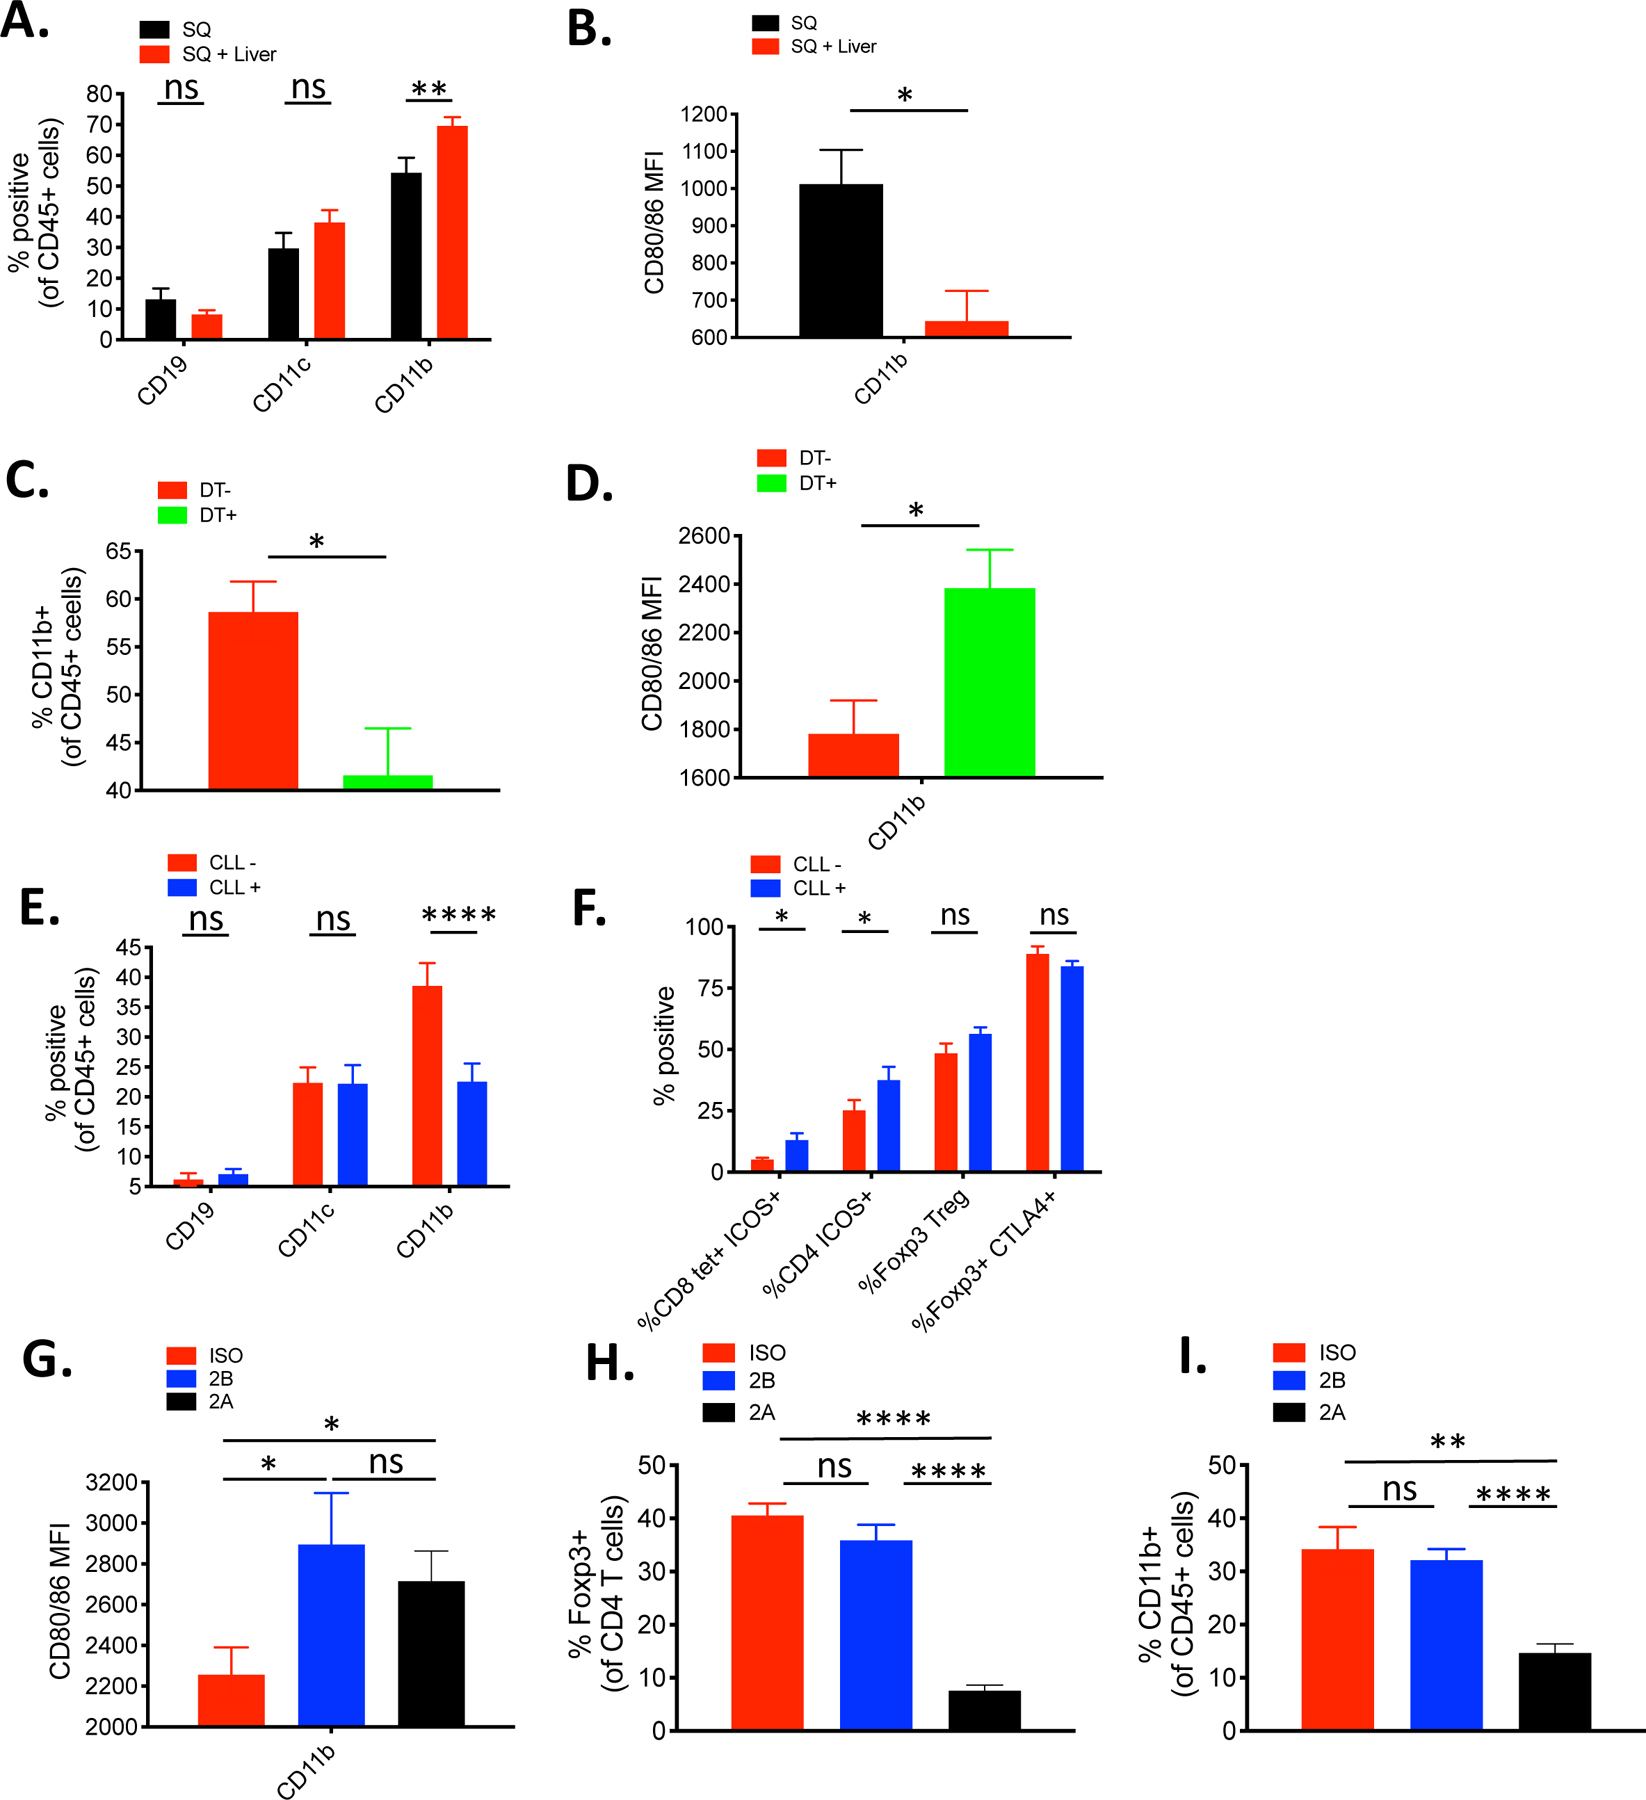
Patients with cancer with liver metastasis demonstrate significantly worse outcomes than those without liver metastasis when treated with anti-PD-1 immunotherapy. The mechanism of liver metastases-induced reduction in systemic antitumor immunity is unclear. Using a dual-tumor immunocompetent mouse model, we found that the immune response to tumor antigen presence within the liver led to the systemic suppression of antitumor immunity. The immune suppression was antigen specific and associated with the coordinated activation of regulatory T cells (Tregs) and modulation of intratumoral CD11b+ monocytes. The dysfunctional immune state could not be reversed by anti-PD-1 monotherapy unless Treg cells were depleted (anti-CTLA-4) or destabilized (EZH2 inhibitor). Thus, this study provides a mechanistic understanding and rationale for adding Treg and CD11b+ monocyte targeting agents in combination with anti-PD-1 to treat patients with cancer with liver metastasis.


Conflict of interest statement

Competing interests: J.A.B. is the founder of Sonoma BioTherapeutics (a Treg therapy company) and Celsius Therapeutics; a member of the board of directors of Rheos Medicines, Provention Bio, Sonoma BioTherapeutics, and the Parker Institute for Cancer Immunotherapy; and is a member of the scientific advisory board of Arcus Biosciences, Solid Biosciences, and Vir Biotechnology. A.D. discloses research funding from the Amoroso and Cook Fund, the Parker Institute for Cancer Immunotherapy, Novartis, Merck, Bristol Myers Squibb, Incyte, AbbVie, OncoSec, Xencor, Pfizer, Roche/Genentech, and Exelixis; participation in Advisory Boards with Amgen, Array BioPharma, and Roche/Genentech; and stock ownership in Trex Bio and Pionyr Immunotherapeutics. J.C.L. is on the Scientific Advisory Board of Chimera Bioengineering and has provide consulting services to OncoSec Medical Incorporated. The remaining authors declare they have no competing interests.

Figures

Fig. 1.
Fig. 1.. Experimental liver metastasis reduces distant antitumor immunity and systemic response to anti-PD-1 immunotherapy.
(A) Two-site tumor model schema. C57BL/6 mice were implanted with MC38 tumor cells (5 × 10⁵) subcutaneously (black), subcutaneously and at the lungs (green), or subcutaneously and at the liver (red) and monitored for tumor growth and survival. SQ = Subcutaneous. (B) SQ Tumor growth curves of the three experimental groups (n = 15 mice per group). (C) Representative flow cytometric plots and percentage of surface PD-1 and intracellular CTLA-4 co-expression on CD8+ T cells sampled from the subcutaneous tumor of the indicated groups on day 14 post tumor implantation (n=15). (D) SQ Tumor growth curves of the indicated experimental groups treated with anti-PD1 antibody treatment (n = 10 mice per group). (E) Survival curves of the indicated experimental groups (n = 10 mice per group). (F) Representative flow cytometric plots and percentage of PD-1 and CTLA-4 co-expression on CD8+ T cells from the indicated anti-PD-1 antibody treated groups (n=10). (C, F) Representative staining controls (blue) of PD-1 and CTLA-4 on CD8+ T cells from splenocytes of naïve mice. (B, E) Asterisks indicating significance determined by Log-rank tests between groups are * p<0.05, **p<0.01, ***p<0.001, and ****p<0.0001, data pooled from two or more experiments. (B, D) Data are shown as mean +/− s.e.m pooled from two or more experiments. Asterisks indicating significance until day 23 post tumor injection determined by two-way ANOVA with Sidak’s multiple comparisons test are * p<0.05, **p<0.01, ***p<0.001, and ****p<0.0001. † indicate that all mice reached experimental endpoint and were euthanized per institutional guidelines.
Fig. 2.
Fig. 2.. Liver-mediated suppression of antitumor immunity is tumor-antigen specific and independent of tumor burden.
(A) Day 20 subcutaneous (SQ) tumor size from B6 mice that were implanted with MC38 tumor cells (5 × 10⁵) subcutaneously alone as a control, subcutaneously and at the left kidney, subcutaneously and intra-peritoneum (I.P.), and subcutaneously and at the liver. (B) SQ tumor sizes in mice implanted with MC38 tumor cells subcutaneously, subcutaneously and at the liver, subcutaneously with irradiated (50 Gy) MC38 tumor cells (5 × 10⁵) at the liver, and subcutaneously with MC38 tumor cell lysates (from 5 × 10⁵ cells) at the liver. (C) SQ tumor sizes in mice implanted with MC38 tumor cells subcutaneously, subcutaneously and at the liver, subcutaneously with 5 × 10⁵ irradiated MC38 tumors cells at the liver, and subcutaneously with 5 × 10⁴ irradiated MC38 tumor cells at the liver. (D) SQ tumor sizes in mice implanted with MC38 tumor cells subcutaneously, subcutaneously with saline (PBS) at the liver, subcutaneously with heterologous B16F10 tumor cells (5 × 10⁵) at the liver, and subcutaneously with homologous MC38 tumor cells at the liver. Representative whole mouse bioluminescent image of implanted MC38 tumors from each experimental group for day 20 are shown (A-D, upper row). Data are shown as mean +/− s.e.m. Asterisks indicating significance determined by unpaired t tests between groups are * p<0.05, **p<0.01, ***p<0.001, and ****p<0.0001. Representative data from one out of at least two independent experiments are shown.
Fig 3.
Fig 3.. Liver tumor-associated distant CD8+ T cell dysfunction is antigen-specific and dependent on Tregs.
(A) Tumor model schema. C57BL/6 mice were implanted with MC38 tumor cells (5 × 10⁵) subcutaneously alone (black) or subcutaneously plus in the liver (red) and TILs were harvested on day 14 post tumor implantation. (B) Percentage of CD8+ T cells of viable CD45+ immune cells and (C) percentage of CD8+ T cells that express PD-1, CTLA-4, ICOS, and IFNγ in the subcutaneous (SQ) tumor of mice with (red) or without (black) concurrent liver tumor by flow cytometry. (D) PD-1, CTLA-4, and ICOS MFIs from Foxp3+ CD4+ Tregs in the SQ tumor from mice with (red) and without (black) concurrent liver tumor and naïve CD4 T cells (blue). (E) Percentage of tetramer+ (KSPWFTTL) cells of total CD8 T cells in the SQ tumor of mice with or without concurrent liver tumor. (F) Percentage of tetramer+ CD8+ T cells positive for PD-1, CTLA-4, ICOS, IFNγ, CD107a, and TNFα. (Unpaired t tests, * p<0.05, **p<0.01, ***p<0.001, and ****p<0.0001) (G) SQ tumor growth curves of mice with SQ tumor without DT (black ), SQ and liver tumor without DT (red ), SQ tumor with DT (blue), and SQ and liver tumor with DT (green). (H) Percentage of tetramer+ CD8+ T cells and (I) percentage of tetramer+ CD8+ T cells that are positive for PD-1, CTLA-4, ICOS, IFNγ, and CD107a in mice bearing liver tumor with (green) or without (red) DT administration. Data shown as mean +/− s.e.m., (n=15 for E, n=10 for all others). For tumor growth curves, asterisks indicating significance up till day 23 post tumor injection were determined by two-way ANOVA with Sidak’s multiple comparisons test are * p<0.05, **p<0.01, ***p<0.001, and ****p<0.0001. Data were pooled from 2 or more experiments.
Fig 4.
Fig 4.. Treg targeting immunotherapy enhances efficacy and reverses immune dysfunction in liver metastasis.
(A) Percentage of Foxp3+ CD4 Tregs within the indicated Subcutaneous (SQ) tumors. (B) SQ tumor growth curves of liver-tumor mice treated with anti-CTLA-4 antibody clone 9H10, 9H10 plus anti-PD-1 antibody, or isotype control. CR= complete rejection with no measurable SQ tumor at endpoint. (C) Survival curves of indicated groups. (D) Percentage of KSP tetramer+ CD8+ TILs and percentage that are positive for PD-1, CTLA-4, ICOS, IFNγ, and TNFα in mice treated with 9H10 versus control. (E) Day 14 SQ tumor sizes from liver-tumor bearing mice treated with EZH2 inhibitor CPI-1205(n=10), anti-PD-1 antibody (n=9), or a combination of both (n=10) compared to control (n=8). (F) Survival curves of indicated groups. (G) Percentage of KSP tetramer+ CD8+ TILs and percentage that are positive for PD-1, CTLA-4, ICOS, and IFNγ in mice treated with anti-PD-1 plus CPI-1205 versus anti-PD-1 alone. (H) Activated CD8+ T cell to Treg ratio within the SQ tumor sample of the indicated treatment groups. (I) SQ tumor growth curves from the MC38 tumor rechallenge experiment of the indicated groups. All data are shown as mean +/− s.e.m. All experiments besides E and F were n=5 or 10 and were representative of three or more independent experiments. Survival curves were analyzed by Log-rank tests, tumor growth curves were analyzed by two-way ANOVA with Sidak’s multiple comparisons, all others were analyzed by unpaired t tests. Asterisks indicating significance determined between groups are * p<0.05, **p<0.01, ***p<0.001, and ****p<0.0001.
Fig 5.
Fig 5.. Presence of liver tumor changes phenotype and transcriptome of SQ tumor-infiltrating adaptive and innate immune cells.
(A) Percentage of Foxp3+ Treg cells that express Neuropilin-1 and Helios in the subcutaneous (SQ) tumor of mice with and without concurrent liver tumor by flow cytometry, and their relative MFIs between the indicated groups. Naïve splenic Foxp3- CD4+ T cells (blue) were stained as control. (B) SQ tumor growth curves from mice that received adoptive transfer of Tregs isolated from mice with (red, n=6) or without liver tumor (black, n=5) versus no Treg control (blue, n=5). Data representative of two independent experiments. (C) Heatmap displaying the top 20 differentially expressed genes by SQ Tregs between the two groups via scRNAseq. (D) Violin plots showing the top 2 differentially upregulated genes by SQ Tregs from mice with liver tumor. (E) Heatmap displaying the top 20 differentially upregulated genes by SQ CD8+ T cells between the two groups. (F) Violin plots showing differential expression of ICOS and CTLA-4 by SQ CD8+ T cells between the two groups. (G) Unbiased reclustering (UMAP) and stacked bar graph of relative frequencies of monocyte/myeloid cells showing 9 distinct scRNAseq subclusters. (H) Violin plots showing relative MDSC score ordered by monocyte/myeloid cell subclusters. Tumor growth curves were analyzed by two-way ANOVA with Sidak’s multiple comparisons. Asterisks indicating significance determined between groups are * p<0.05, **p<0.01, ***p<0.001, and ****p<0.0001.
Fig 6.
Fig 6.. Treg control of distant tumor-antigen specific immunity is mediated by tolerogenic MDSCs.
(A) Percentage of CD19, CD11b, and CD11c positive cells in the subcutaneous (SQ) tumor of mice with (red, n=10) or without (black, n=7) concurrent liver tumor by flow cytometry (B) MFI of CD80/86 from CD11b+ cells in the SQ tumor from mice with and without concurrent liver tumor by flow cytometry (each n=7). (C) Percentage of CD11b+ cells in the SQ tumor of Foxp3-DTR mice bearing liver tumor with (green) or without (red) DT administration (each n=8). (D) MFI of CD80/86 from CD11b+ cells in the SQ tumor of Foxp3-DTR mice bearing liver tumor with (green) or without (red) DT administration (each n=8). (E) Percentage of CD19, CD11b, and CD11c positive cells in the SQ tumor of liver-tumor bearing mice treated with liposomal clodronate (CLL) (blue, n=10) or vehicle control (red, n=8). (F) Comparative percentage of tetramer+ ICOS+ CD8+ T cells, ICOS+ CD4+ T cells, Tregs, and CTLA-4+ Tregs in the SQ tumor of mice bearing liver tumor treated with CLL (n=10) or vehicle control (n=8). (G) MFI of CD80/86 from CD45+ CD11b+ cells in the SQ tumor of mice bearing liver tumor treated with isotype control (red), 9D9 IgG2a (blue), or 9D9 IgG2b (black). (H) Percentage of Foxp3+ CD4 Tregs within the SQ tumor of the indicated groups. (I) Percentage of CD45+ CD11b+ cells within SQ tumor of the indicated groups. (G-I) N=6 for all groups. Data representative from at least 2 independent experiments. Data analyzed by unpaired t tests, and shown as mean +/− s.e.m. Asterisks indicating significance determined between groups are * p<0.05, **p<0.01, ***p<0.001, and ****p<0.0001.

References

    1. Tumeh PC, Hellmann MD, Hamid O, Tsai KK, Loo KL, Gubens MA, Rosenblum M, Harview CL, Taube JM, Handley N, Khurana N, Nosrati A, Krummel MF, Tucker A, Sosa EV, Sanchez PJ, Banayan N, Osorio JC, Nguyen-Kim DL, Chang J, Shintaku IP, Boasberg PD, Taylor EJ, Munster PN, Algazi AP, Chmielowski B, Dummer R, Grogan TR, Elashoff D, Hwang J, Goldinger SM, Garon EB, Pierce RH, Daud A, Liver Metastasis and Treatment Outcome with Anti-PD-1 Monoclonal Antibody in Patients with Melanoma and NSCLC, Cancer Immunol. Res 5, 417–424 (2017). - PMC - PubMed
    1. Pires da Silva I, Lo S, Quek C, Gonzalez M, Carlino MS, Long GV, Menzies AM, Site-specific response patterns, pseudoprogression, and acquired resistance in patients with melanoma treated with ipilimumab combined with anti-PD-1 therapy, Cancer (2020), 10.1002/cncr.32522. - DOI - PubMed
    1. Schmid S, Diem S, Li Q, Krapf M, Flatz L, Leschka S, Desbiolles L, Klingbiel D, Jochum W, Früh M, Organ-specific response to nivolumab in patients with non-small cell lung cancer (NSCLC), Cancer Immunol. Immunother 67, 1825–1832 (2018). - PMC - PubMed
    1. Bilen MA, Shabto JM, Martini DJ, Liu Y, Lewis C, Collins HH, Akce M, Kissick H, Carthon BC, Shaib WL, Alese OB, Steuer CE, Wu C, Lawson DH, Kudchadkar R, Master V, El-Rayes B, Ramalingam SS, Owonikoko TK, Harvey RD, Sites of metastasis and association with clinical outcome (CO) in advanced stage cancer patients (pts) treated with immunotherapy (IO), BMC Cancer 19 (2019), 10.1093/annonc/mdy288.092. - DOI - PMC - PubMed
    1. Sasaki A, Nakamura Y, Mishima S, Kawazoe A, Kuboki Y, Bando H, Kojima T, Doi T, Ohtsu A, Yoshino T, Kuwata T, Akimoto T, Shitara K, Predictive factors for hyperprogressive disease during nivolumab as anti-PD1 treatment in patients with advanced gastric cancer, Gastric Cancer (2019), 10.1007/s10120-018-00922-8. - DOI - PubMed

Publication types

MeSH terms