

Temporal airway microbiome changes related to ventilator-associated pneumonia in children
- PMID: 33008935
- PMCID: PMC7979474
- DOI: 10.1183/13993003.01829-2020
Temporal airway microbiome changes related to ventilator-associated pneumonia in children
Abstract
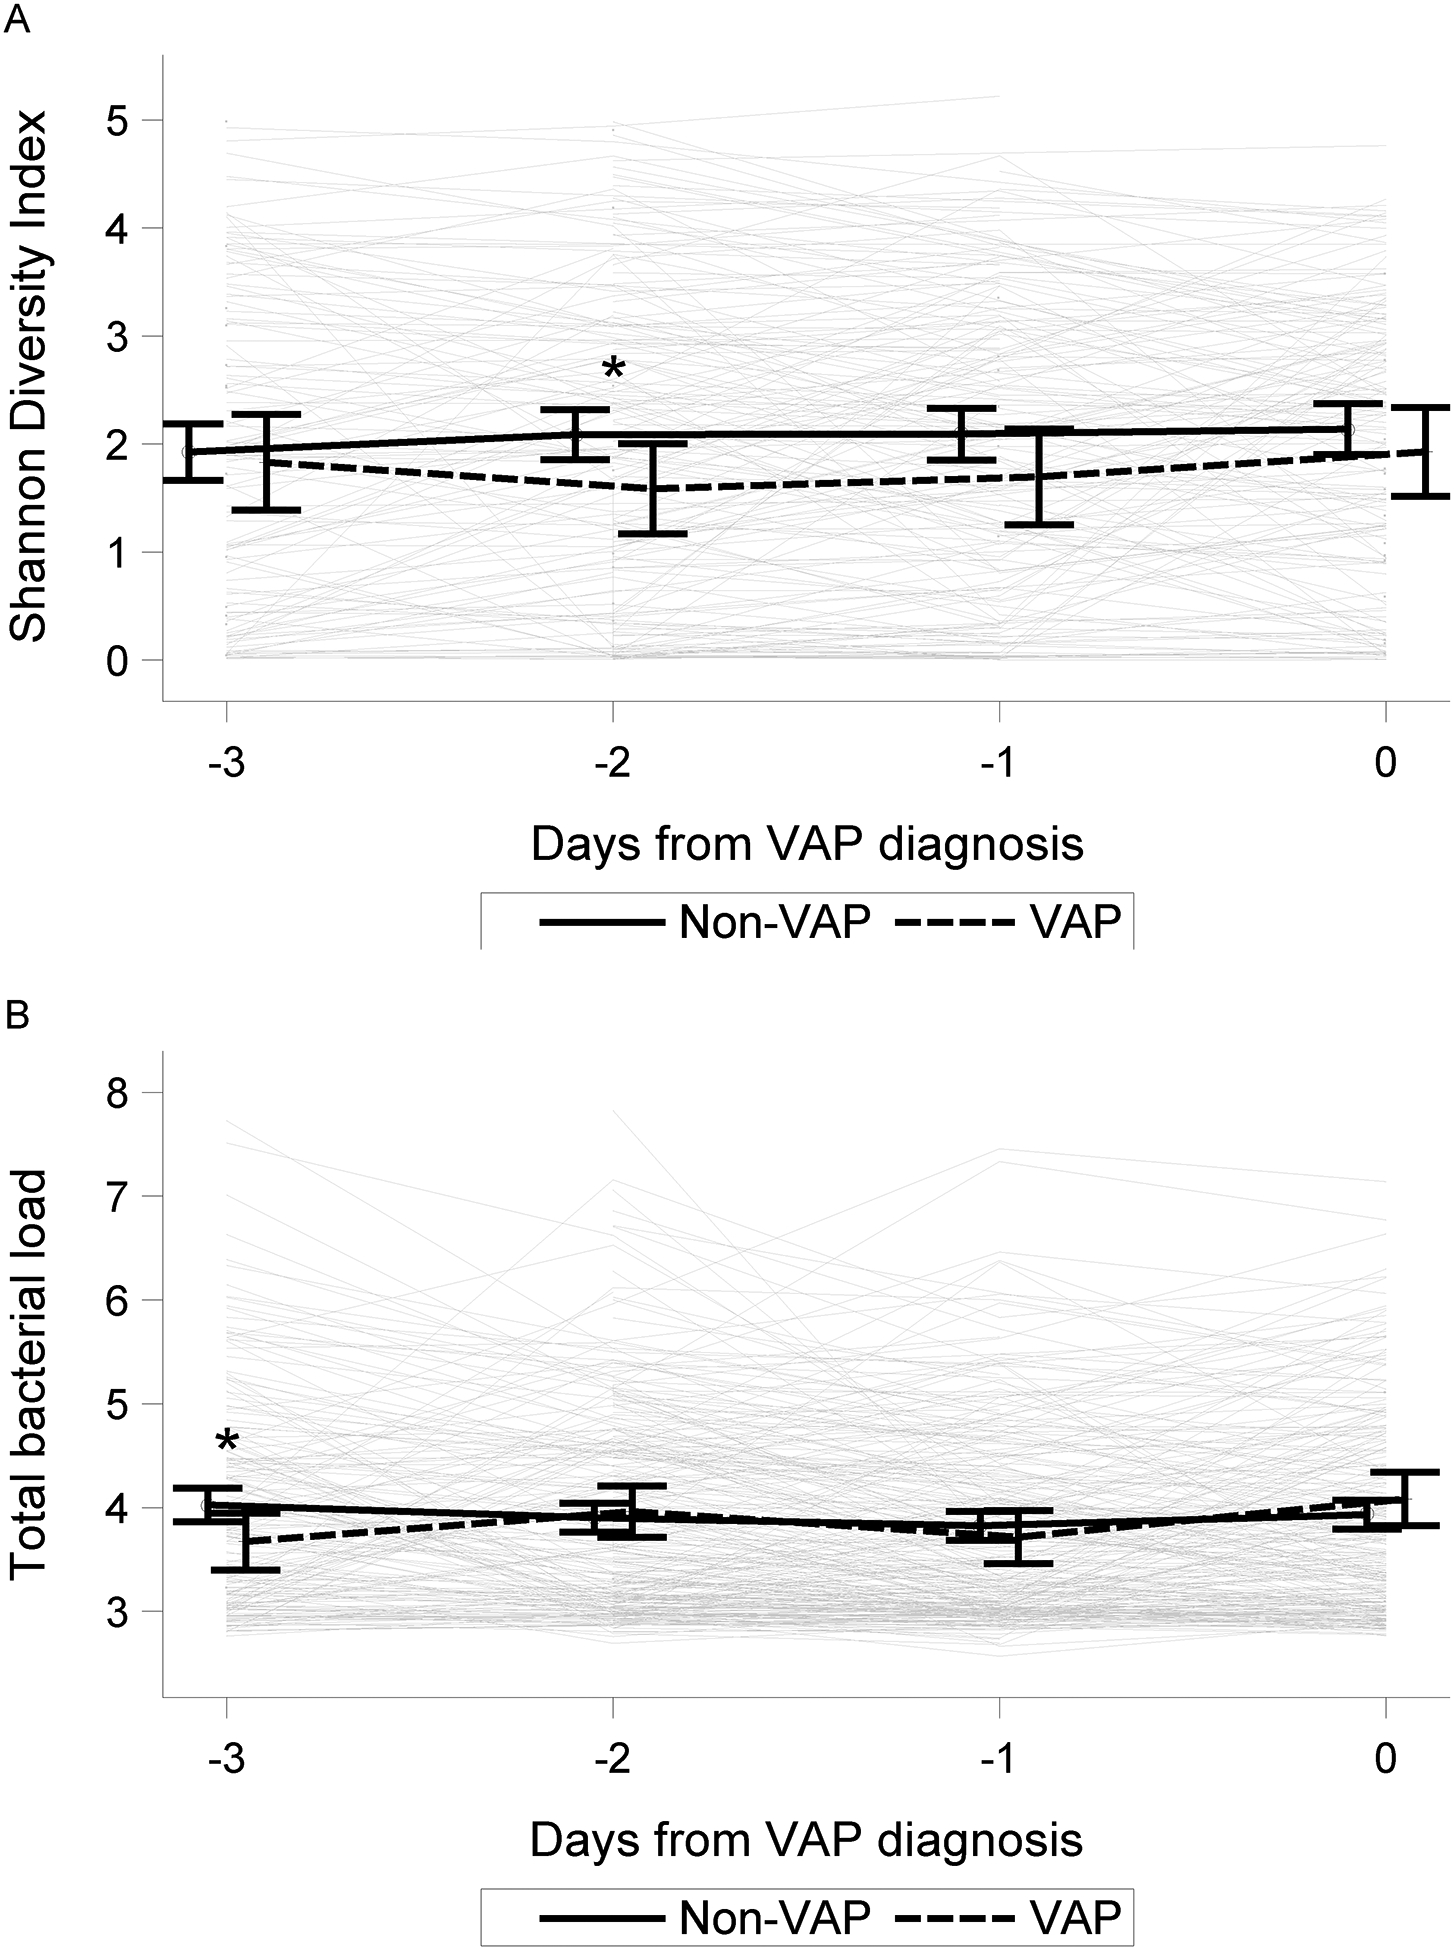
We sought to determine whether temporal changes in the lower airway microbiome are associated with ventilator-associated pneumonia (VAP) in children.Using a multicentre prospective study of children aged 31 days to 18 years requiring mechanical ventilation support for >72 h, daily tracheal aspirates were collected and analysed by sequencing of the 16S rRNA gene. VAP was assessed using 2008 Centers for Disease Control and Prevention paediatric criteria. The association between microbial factors and VAP was evaluated using joint longitudinal time-to-event modelling, matched case-control comparisons and unsupervised clustering.Out of 366 eligible subjects, 66 (15%) developed VAP at a median of 5 (interquartile range 3-5) days post intubation. At intubation, there was no difference in total bacterial load (TBL), but Shannon diversity and the relative abundance of Streptococcus, Lactobacillales and Prevotella were lower for VAP subjects versus non-VAP subjects. However, higher TBL on each sequential day was associated with a lower hazard (hazard ratio 0.39, 95% CI 0.23-0.64) for developing VAP, but sequential values of diversity were not associated with VAP. Similar findings were observed from the matched analysis and unsupervised clustering. The most common dominant VAP pathogens included Prevotella species (19%), Pseudomonas aeruginosa (14%) and Streptococcus mitis/pneumoniae (10%). Mycoplasma and Ureaplasma were also identified as dominant organisms in several subjects.In mechanically ventilated children, changes over time in microbial factors were marginally associated with VAP risk, although these changes were not suitable for predicting VAP in individual patients. These findings suggest that focusing exclusively on pathogen burden may not adequately inform VAP diagnosis.
Copyright ©ERS 2021.
Conflict of interest statement
Conflict of interest: P.M. Mourani reports grants from NIH NHLBI and NIH NICHD, during the conduct of the study. Conflict of interest: M.K. Sontag reports grants from NIH NHLBI, during the conduct of the study. Conflict of interest: K.M. Williamson has nothing to disclose. Conflict of interest: J.K. Harris has nothing to disclose. Conflict of interest: R. Reeder has nothing to disclose. Conflict of interest: C. Locandro has nothing to disclose. Conflict of interest: T.C. Carpenter reports grants from NIH NHLBI and NIH NICHD, during the conduct of the study. Conflict of interest: A.B. Maddux reports a grant from Parker B. Francis Foundation (Fellowship Award) and NIH/NICHD K23HD096018, outside the submitted work. Conflict of interest: K. Ziegler reports grants from NIH NHLBI during the conduct of the study. Conflict of interest: E.A.F. Simões reports grants from NIH NHLBI, during the conduct of the study. Conflict of interest: C.M. Osborne has nothing to disclose. Conflict of interest: L. Ambroggio has nothing to disclose. Conflict of interest: M.K. Leroue has nothing to disclose. Conflict of interest: C.E. Robertson has nothing to disclose. Conflict of interest: C. Langelier has nothing to disclose. Conflict of interest: J.L. DeRisi reports grants from NIH NHLBI, during the conduct of the study. Conflict of interest: J. Kamm has nothing to disclose. Conflict of interest: M.W. Hall reports grants from NIH NICHD, during the conduct of the study. Conflict of interest: A.F. Zuppa has nothing to disclose. Conflict of interest: J. Carcillo has nothing to disclose. Conflict of interest: K. Meert reports grants from NIH, during the conduct of the study. Conflict of interest: A. Sapru reports grants from NIH NICHD, during the conduct of the study. Conflict of interest: M.M. Pollack reports grants from NIH, during the conduct of the study. Conflict of interest: P. McQuillen reports grants from NIH NICHD, during the conduct of the study. Conflict of interest: D.A. Notterman has nothing to disclose. Conflict of interest: J.M. Dean reports grants from NIH, during the conduct of the study. Conflict of interest: B.D. Wagner reports grants from NIH NHLBI, during the conduct of the study.
Figures


References
-
- Raymond J, Aujard Y. Nosocomial infections in pediatric patients: a European, multicenter prospective study. European Study Group. Infect Control Hosp Epidemiol 2000; 21: 260–263. - PubMed
-
- Foglia EE, Fraser VJ, Elward AM. Effect of nosocomial infections due to antibiotic-resistant organisms on length of stay and mortality in the pediatric intensive care unit. Infect Control Hosp Epidemiol 2007; 28: 299–306. - PubMed
-
- Fischer JE, Ramser M, Fanconi S. Use of antibiotics in pediatric intensive care and potential savings. Intensive Care Medicine 2000; 26: 959–966. - PubMed
Publication types
MeSH terms
Substances
Grants and funding
- UG1 HD049983/HD/NICHD NIH HHS/United States
- U10 HD049983/HD/NICHD NIH HHS/United States
- UG1 HD063108/HD/NICHD NIH HHS/United States
- K23 HL138461/HL/NHLBI NIH HHS/United States
- U01 HD049934/HD/NICHD NIH HHS/United States
- UG1 HD049981/HD/NICHD NIH HHS/United States
- K23 HD096018/HD/NICHD NIH HHS/United States
- UG1 HD050096/HD/NICHD NIH HHS/United States
- UG1 HD083170/HD/NICHD NIH HHS/United States
- UG1 HD083166/HD/NICHD NIH HHS/United States
- RL1 HD107773/HD/NICHD NIH HHS/United States
- R01 HL155418/HL/NHLBI NIH HHS/United States
- R01 HL124103/HL/NHLBI NIH HHS/United States
- UG1 HD083171/HD/NICHD NIH HHS/United States
LinkOut - more resources
Full Text Sources
Molecular Biology Databases