Comparative Study
. 2021 Apr 1;53(4):825-837.
doi: 10.1249/MSS.0000000000002523.

Greater Hamstrings Muscle Hypertrophy but Similar Damage Protection after Training at Long versus Short Muscle Lengths

Affiliations
Comparative Study

Greater Hamstrings Muscle Hypertrophy but Similar Damage Protection after Training at Long versus Short Muscle Lengths

Sumiaki Maeo et al. Med Sci Sports Exerc. .

Abstract

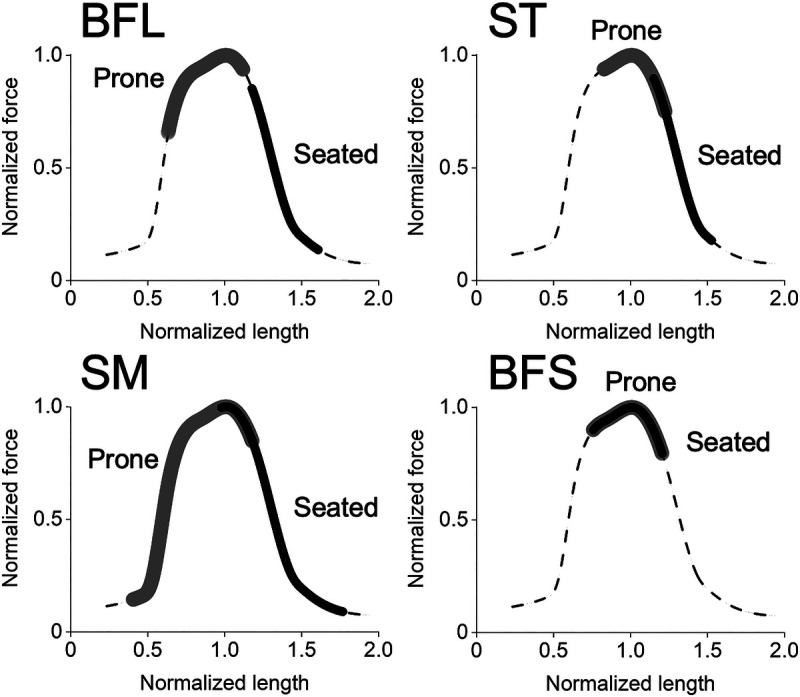
Purpose: We investigated the effects of seated versus prone leg curl training on hamstrings muscle hypertrophy and susceptibility to eccentric exercise-induced muscle damage.

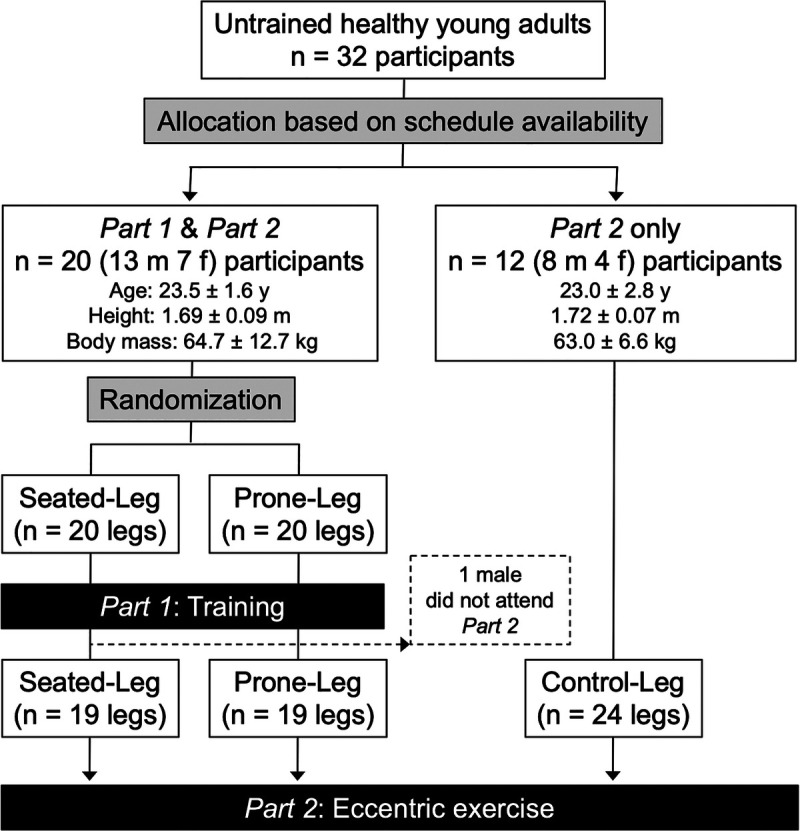
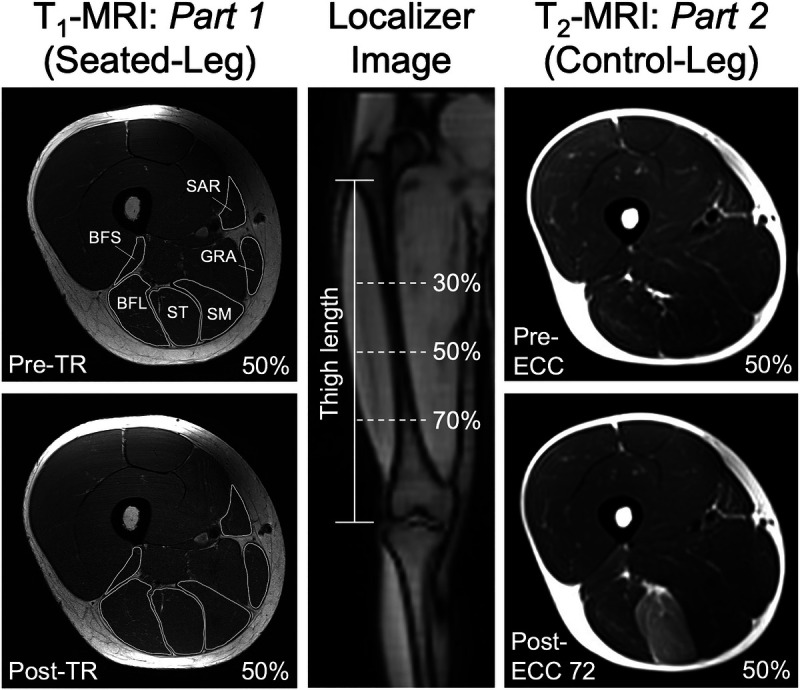
Methods: Part 1: Twenty healthy adults conducted seated leg curl training with one leg (Seated-Leg) and prone with the other (Prone-Leg), at 70% one-repetition maximum (1RM), 10 repetitions per set, 5 sets per session, 2 sessions per week for 12 wk. Magnetic resonance imaging (MRI)-measured muscle volume of the individual and whole hamstrings was assessed pre- and posttraining. Part 2: Nineteen participants from part 1 and another 12 untrained controls (Control-Leg) performed eccentric phase-only leg curl exercise at 90% 1RM, 10 repetitions per set, 3 sets for each of the seated/prone conditions with each leg. MRI-measured transverse relaxation time (T2) and 1RM of seated/prone leg curl were assessed before, 24, 48, and 72 h after exercise.

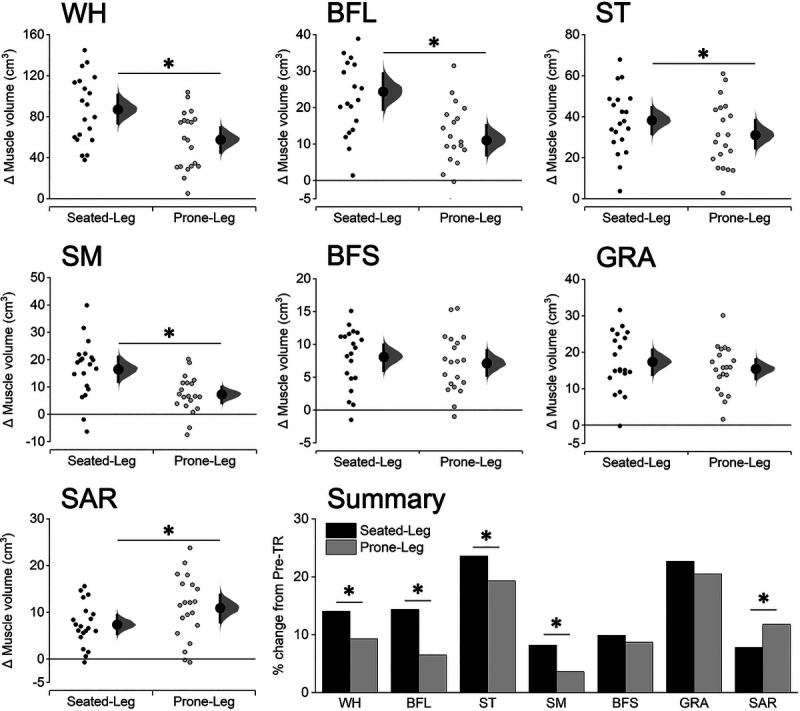
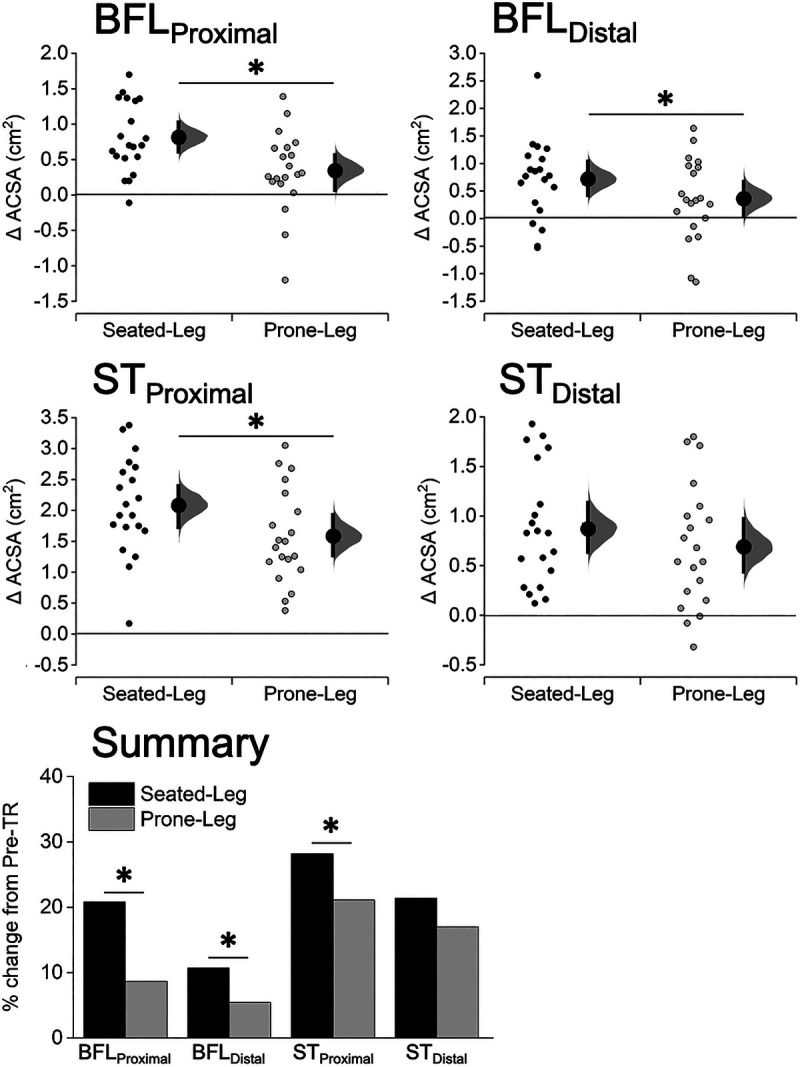
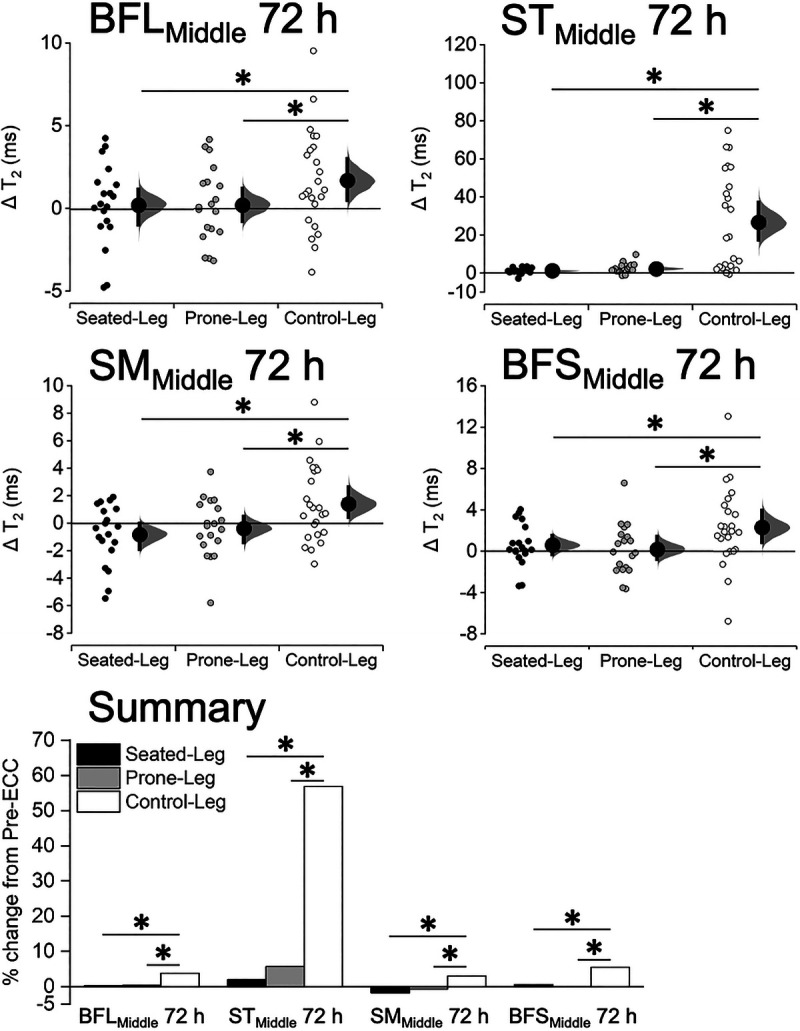
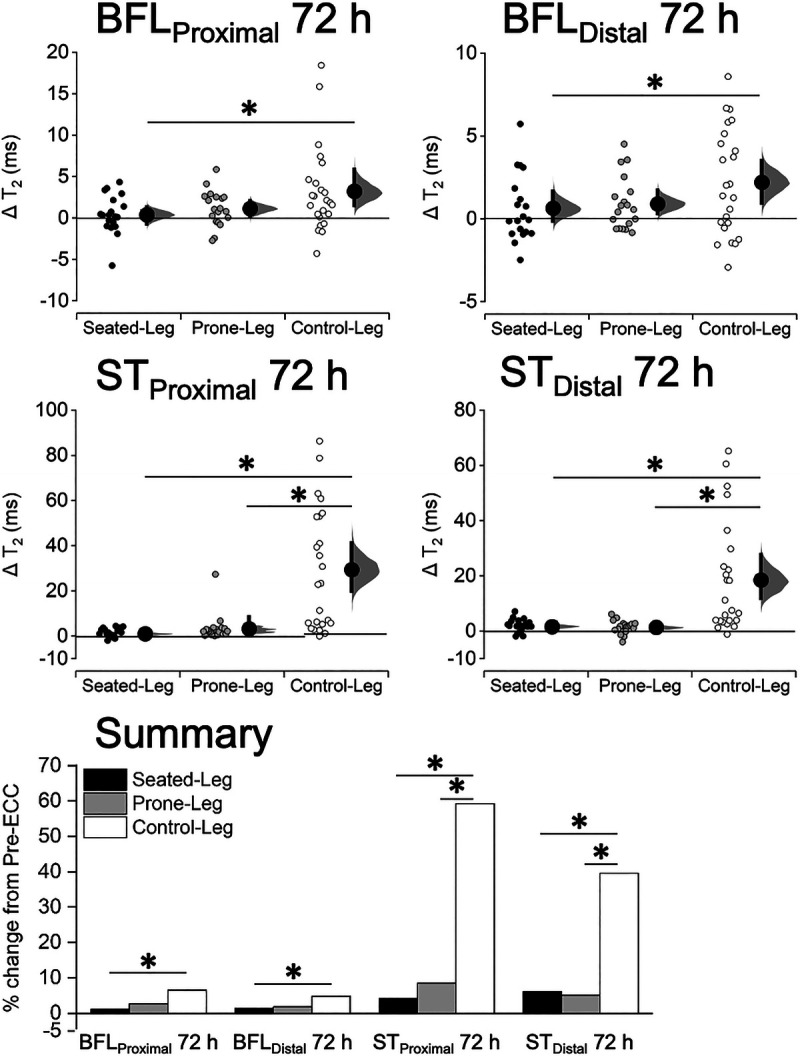
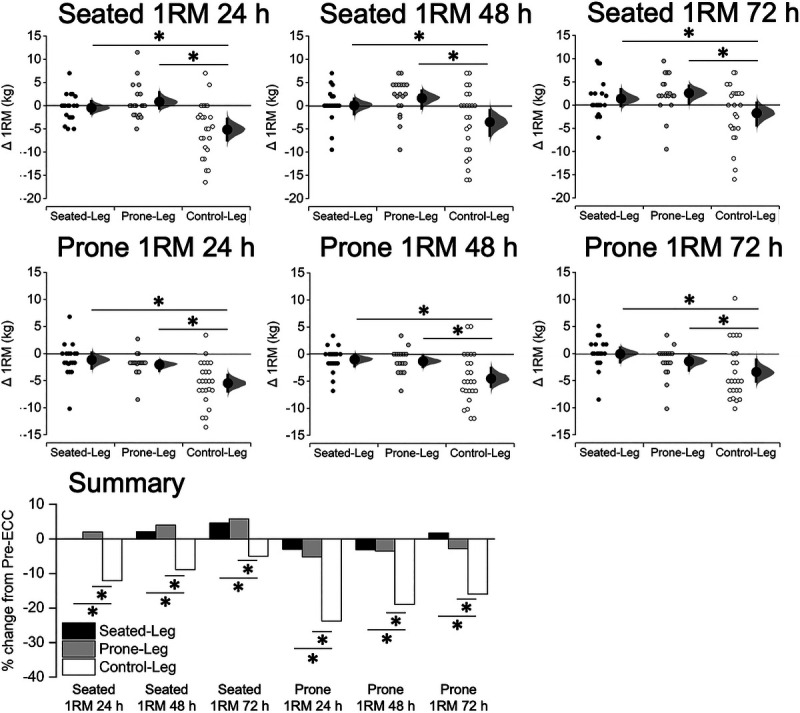
Results: Part 1: Training-induced increases in muscle volume were greater in Seated-Leg versus Prone-Leg for the whole hamstrings (+14% vs +9%) and each biarticular (+8%-24% vs +4%-19%), but not monoarticular (+10% vs +9%), hamstring muscle. Part 2: After eccentric exercise, Control-Leg had greater increases in T2 in each hamstring muscle (e.g., semitendinosus at 72 h: +52%) than Seated-Leg (+4%) and Prone-Leg (+6%). Decreases in 1RM were also greater in Control-Leg (e.g., seated/prone 1RM at 24 h: -12%/-24%) than Seated-Leg (0%/-3%) and Prone-Leg (+2%/-5%). None of the changes significantly differed between Seated-Leg and Prone-Leg at any time points.

Conclusion: Hamstrings muscle size can be more effectively increased by seated than prone leg curl training, suggesting that training at long muscle lengths promotes muscle hypertrophy, but both are similarly effective in reducing susceptibility to muscle damage.


Figures

FIGURE 1
FIGURE 1
Operating ranges of each hamstring muscle on the normalized force–length curve during the seated and prone knee flexion (leg curl) exercise. These were calculated using the OpenSim Lower Limb model (8,9), with the hip joint angle at 90° and 30° for the seated and prone conditions, respectively, and the knee joint angle ranging from 0° to 90° for both conditions as conducted in this study. It is clearly seen that the three biarticular hamstrings (BFL, ST, and SM) operate at longer muscle lengths during the seated than prone condition, while there is no difference in the monoarticular BFS. Some differences within the biarticular muscles are likely due to their different musculotendinous architecture and moment arms (10).
FIGURE 2
FIGURE 2
Flow diagram and demographic information of participants.
FIGURE 3
FIGURE 3
Example images for the T1-weighted MRI scans (for Seated-Leg in part 1) and T2-weighted MRI scans (for Control-Leg in part 2) at 50% of the thigh length, and a coronal localizer image. The images shown here are all for the right leg, but both legs were scanned in both part 1 and part 2.
FIGURE 4
FIGURE 4
Changes in muscle volume for Seated-Leg and Prone-Leg after training. Data are plotted as individual raw change (Δ) values from baseline (small dots), with a group mean (larger dots) and its 95% CI (indicated by the ends of the vertical error bars) shown together. The CI and the bootstrap sampling distributions (5000 samples, bias-corrected and accelerated) were obtained from respective paired (pre- to posttraining) data. *Significant difference between legs at P < 0.05 based on a baseline-adjusted ANCOVA. n = 20 legs for both Seated-Leg and Prone-Leg. The bar graphs in the summary figure are based on the mean changes for each muscle.
FIGURE 5
FIGURE 5
Changes in ACSA of the BFL and ST at 30% (BFLProximal, STProximal) and 70% (BFLDistal, STDistal) of the thigh length for Seated-Leg and Prone-Leg after training. Data are plotted as individual raw change (Δ) values from baseline (small dots), with a group mean (larger dots) and its 95% CI (indicated by the ends of the vertical error bars) shown together. The CI and the bootstrap sampling distributions (5000 samples, bias-corrected and accelerated) were obtained from respective paired (pre- to posttraining) data. *Significant difference between legs at P < 0.05 based on a baseline-adjusted ANCOVA. n = 20 legs for both Seated-Leg and Prone-Leg. The bar graphs in the summary figure are based on the mean changes for each muscle.
FIGURE 6
FIGURE 6
Changes in T2 of each hamstring muscle at 50% of the thigh length (BFLMiddle, STMiddle, SMMiddle, BFSMiddle) at 72 h after eccentric exercise for Seated-Leg, Prone-Leg, and Control-Leg. Data are plotted as individual raw change (Δ) values from baseline (small dots), with a group mean (larger dots) and its 95% CI (indicated by the ends of the vertical error bars) shown together. The CI and the bootstrap sampling distributions (5000 samples, bias-corrected and accelerated) were obtained from respective paired (pre- to postexercise) data. *Significant difference between legs at P < 0.05 based on a baseline-adjusted ANCOVA and an LSD post hoc test. n = 19 legs for both Seated-Leg and Prone-Leg, and 24 legs for Control-Leg. The bar graphs in the summary figure are based on the mean changes for each muscle.
FIGURE 7
FIGURE 7
Changes in T2 of the BFL and ST at 30% (BFLProximal, STProximal) and 70% (BFLDistal, STDistal) of the thigh length at 72 h after eccentric exercise for Seated-Leg, Prone-Leg, and Control-Leg. Data are plotted as individual raw change (Δ) values from baseline (small dots), with a group mean (larger dots) and its 95% CI (indicated by the ends of the vertical error bars) shown together. The CI and the bootstrap sampling distributions (5000 samples, bias-corrected and accelerated) were obtained from respective paired (pre- to postexercise) data. *Significant difference between legs at P < 0.05 based on a baseline-adjusted ANCOVA and an LSD post hoc test. n = 19 legs for both Seated-Leg and Prone-Leg, and 24 legs for Control-Leg. The bar graphs in the summary figure are based on the mean changes for each muscle.
FIGURE 8
FIGURE 8
Changes in the seated and prone leg curl 1RM at 24, 48, and 72 h after eccentric exercise for Seated-Leg, Prone-Leg, and Control-Leg. Data are plotted as individual raw change (Δ) values from baseline (small dots), with a group mean (larger dots) and its 95% CI (indicated by the ends of the vertical error bars) shown together. The CI and the bootstrap sampling distributions (5000 samples, bias-corrected and accelerated) were obtained from respective paired (pre- to postexercise) data. *Significant difference between legs at P < 0.05 based on a baseline-adjusted ANCOVA and an LSD post hoc test. n = 19 legs for both Seated-Leg and Prone-Leg, and 24 legs for Control-Leg. The bar graphs in the summary figure are based on the mean changes for each 1RM measurement.

References

    1. Morin JB Gimenez P Edouard P, et al. . Sprint acceleration mechanics: the major role of hamstrings in horizontal force production. Front Physiol. 2015;6:404. - PMC - PubMed
    1. Guex K, Millet GP. Conceptual framework for strengthening exercises to prevent hamstring strains. Sports Med. 2013;43(12):1207–15. - PubMed
    1. American College of Sports Medicine . American College of Sports Medicine Position Stand: progression models in resistance training for healthy adults. Med Sci Sports Exerc. 2009;41(3):687–708. - PubMed
    1. Garber CE Blissmer B Deschenes MR, et al. American College of Sports Medicine . American College of Sports Medicine Position Stand: quantity and quality of exercise for developing and maintaining cardiorespiratory, musculoskeletal, and neuromotor fitness in apparently healthy adults: guidance for prescribing exercise. Med Sci Sports Exerc. 2011;43(7):1334–59. - PubMed
    1. Abe T, DeHoyos DV, Pollock ML, Garzarella L. Time course for strength and muscle thickness changes following upper and lower body resistance training in men and women. Eur J Appl Physiol. 2000;81(3):174–80. - PubMed

Publication types