. 2020 Oct 2;11(1):4952.
doi: 10.1038/s41467-020-18682-4.

Disease trajectory browser for exploring temporal, population-wide disease progression patterns in 7.2 million Danish patients

Affiliations

Disease trajectory browser for exploring temporal, population-wide disease progression patterns in 7.2 million Danish patients

Troels Siggaard et al. Nat Commun. .

Abstract

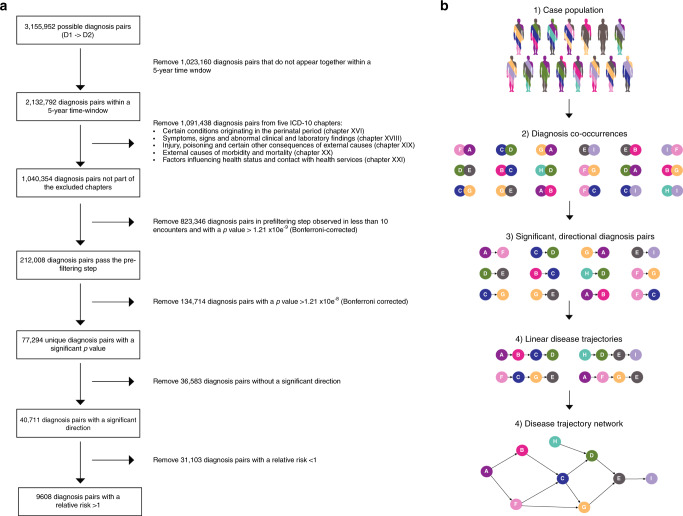
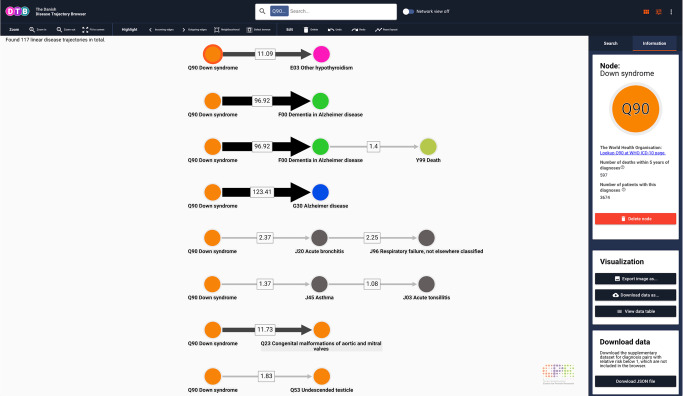
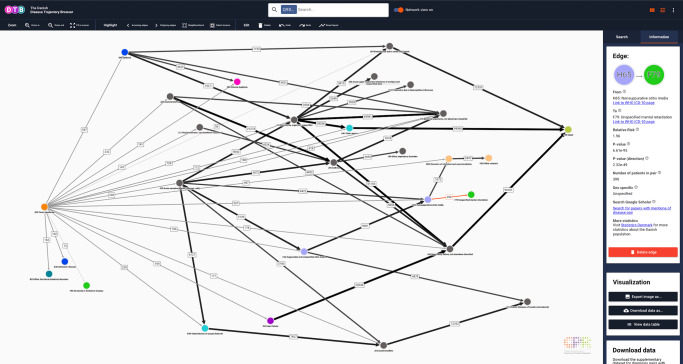
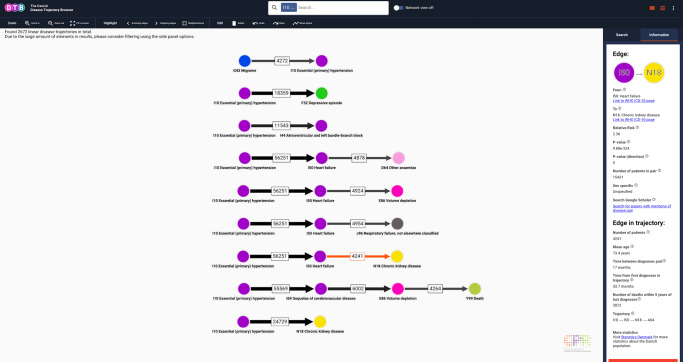
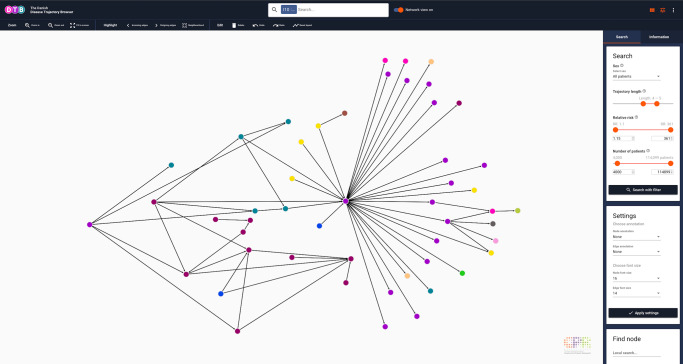
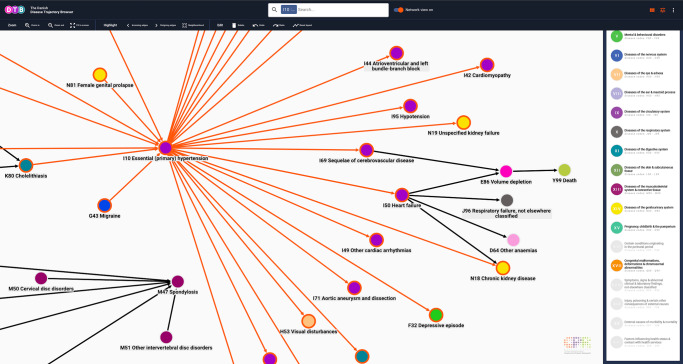
We present the Danish Disease Trajectory Browser (DTB), a tool for exploring almost 25 years of data from the Danish National Patient Register. In the dataset comprising 7.2 million patients and 122 million admissions, users can identify diagnosis pairs with statistically significant directionality and combine them to linear disease trajectories. Users can search for one or more disease codes (ICD-10 classification) and explore disease progression patterns via an array of functionalities. For example, a set of linear trajectories can be merged into a disease trajectory network displaying the entire multimorbidity spectrum of a disease in a single connected graph. Using data from the Danish Register for Causes of Death mortality is also included. The tool is disease-agnostic across both rare and common diseases and is showcased by exploring multimorbidity in Down syndrome (ICD-10 code Q90) and hypertension (ICD-10 code I10). Finally, we show how search results can be customized and exported from the browser in a format of choice (i.e. JSON, PNG, JPEG and CSV).


Conflict of interest statement

S.B. reports ownerships in Intomics A/S, Hoba Therapeutics Aps, Novo Nordisk A/S, Lundbeck A/S and managing board memberships in Proscion A/S and Intomics A/S outside the submitted work.

Figures

Fig. 1
Fig. 1. Register data processing.
Disease trajectory algorithm flowchart (a) and schematic representation of the disease trajectory algorithm that is the foundation for Danish Disease Trajectory Browser functionality (b). a Pre-filtering and computation of statistically significant diagnosis pairs in The Danish National Patient Registry (NPR), containing data on 7,186,865 patients. b (1) Users select a ICD-10 indexed patient population by typing ICD-10 code(s) or disease(s) of interest (ICD-10 code, level 3). (2/3) The first step where the algorithm identifies statistically significant directional diagnosis pairs. (4/5) The second step where the algorithm builds linear trajectories by concatenating statistically significant diagnosis pairs, that can then be merged into a disease trajectory network, consequent to the fact that one disease may appear in more than one linear disease trajectory. ICD-10 International Classification of Diseases, 10th Revision. Colours indicate disease category.
Fig. 2
Fig. 2. Linear disease trajectories for Down syndrome (Q90).
Upper bar with search field and switch to turn on Network view. Below the upper bar search results are displayed in the visualisation interface. Users can see the total number of linear trajectories (in this case 117). When a node is selected, search results are linked to the WHO ICD-10 browser in the side panel. The content of the link depends on the selected node (circles). When an edge is selected, search results also link to Google Scholar and Statistics Denmark. Width and shade of edges co-vary with the number of patients that follow the particular trajectory or as here the relative risk (depending on Settings selection, located in the side panel, Search tab). Users can navigate the search results, select the content of the links and change location of trajectories by clicking and dragging in the search result field. Search filter setting: no settings applied. WHO ICD-10 World Health Organization, International Classification of Diseases, 10th Revision. Colours of nodes represent ICD-10 chapters.
Fig. 3
Fig. 3. Network view representation of the linear disease trajectories for Down Syndrome (Q90).
Nodes represent ICD-10 codes and each colour corresponds to one of the 21 chapters in the ICD-10 index. Five chapters are excluded (for details, see Methods section). Arrows represent a statistically significant directionality between two diagnosis codes. Numbers describe how many patients follow the trajectories. If an edge is selected manually by clicking (red highlight) the statistical specifications will be displayed in the side panel. In the visualisation interface, selected nodes and edges may also be deleted (grouped or individually) by clicking on the icon “Delete edge”. A description of each variable can be retrieved by placing the curser over the question marks. Search filter settings: all patients, length 3–5, relative risk (RR) 1.5–361, number of patients 21–114,099. ICD-10 International Classification of Diseases, 10th Revision. Colours of nodes represent ICD-10 chapters.
Fig. 4
Fig. 4. Linear disease trajectories for essential (primary) hypertension (I10).
When an edge is selected, users can explore characteristics for the entire trajectory and the individual trajectory edges separately. In this case, there are 56,251 patients who follow the trajectory I10 -> I50, 24,729 patients that follow the trajectory I10 -> N18 and 4241 patients who follow the trajectory I10 -> I50 -> N18 (visualisation interface). In the Information tab users can find information on the selected length 2 trajectory as well as the entire trajectory (side panel). If users select a different edge or search for I50 or N18, the browser allows to compare e.g. mean age at assignment of first trajectory across all statistically significant trajectories with RR > 1 in the entire population. Search filter settings: all patients, length 4–5, RR 1.15–361, number of patients 4000–114,099. I10: ICD-10 code for essential (primary) hypertension. I50: ICD-10 code for heart failure. N18: ICD-10 code for chronic kidney disease. ICD-10 International Classification of Diseases, 10th Revision. Colours of nodes represent ICD-10 chapters.
Fig. 5
Fig. 5. Disease trajectory network for essential (primary) hypertension (I10).
When the search tab is selected in the side panel, users can perform advanced DTB queries by application of DTB functionality, comprised of a the drop-down menu (All patients, female patients only or male patients only), notches (trajectory length, relative risk and number of patients) or fields for typing the boundary values (relative risk and number of patients). Users can customise the layout of the search results by selecting annotation (type and font) and perform a local search by typing an ICD-10 code or a disease (bottom, left corner). Search filter setting: all patients, length 4–5, RR 1.15–361, number of patients 4000–114,099. DTB Danish Disease Trajectory Browser, ICD-10 International Classification of Diseases, 10th Revision. Colours of nodes represent ICD-10 chapters.
Fig. 6
Fig. 6. Details relating to Fig. 5 where the Neighbourhood tool has been selected.
When network view is on, users can customise the network display by applying different tools, e.g. Neighbourhood where all edges that link directly to a node are highlighted (red outline). In this case, I10 was selected and highlighted edges link to neighbour nodes. Other tools include Incoming edges, Outcoming edges and Select inverse. If the Select inverse functionality is activated after Neighbourhood, nodes and edges which are not neighbours will be highlighted. This is especially useful for deleting a section of the network, that users do not wish to export. Users can export the network that is displayed in the visualisation interface and may select parts manually by clicking on nodes and edges while holding down shift or dragging while holding down control (Windows/Linux) or command (Mac). I10 ICD-10 code for essential (primary) hypertension, ICD-10 International Classification of Diseases, 10th Revision. Colours of nodes represent ICD-10 chapters.

References

    1. Boycott KM, Innes AM. When one diagnosis is not enough. New Engl. J. Med. 2017;376:83–85. - PubMed
    1. Blair DR, et al. A nondegenerate code of deleterious variants in mendelian loci contributes to complex disease risk. Cell. 2013;155:70–80. - PMC - PubMed
    1. Jensen AB, et al. Temporal disease trajectories condensed from population-wide registry data covering 6.2 million patients. Nat. Commun. 2014;5:1–10. - PMC - PubMed
    1. Jia G, et al. Estimating heritability and genetic correlations from large health datasets in the absence of genetic data. Nat. Commun. 2019;10:5508. - PMC - PubMed
    1. Hidalgo CA, Blumm N, Barabási A-L, Christakis NA. A dynamic network approach for the study of human phenotypes. PLoS Comput. Biol. 2009;5:e1000353. - PMC - PubMed

Publication types