. 2020 Oct 2;11(1):4965.
doi: 10.1038/s41467-020-18613-3.

Real-world data from a molecular tumor board demonstrates improved outcomes with a precision N-of-One strategy

Affiliations

Real-world data from a molecular tumor board demonstrates improved outcomes with a precision N-of-One strategy

Shumei Kato et al. Nat Commun. .

Abstract

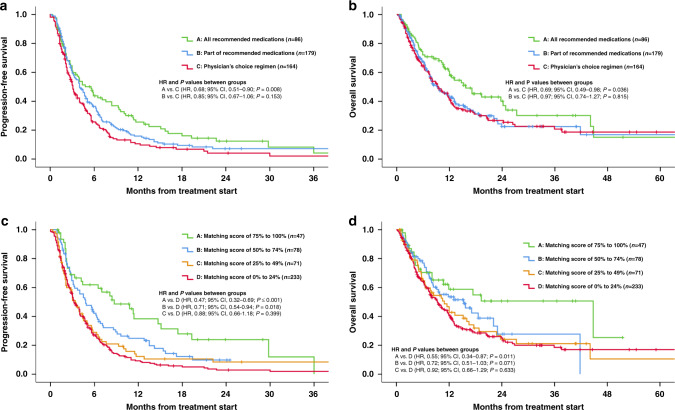
Next-generation sequencing (NGS) can identify novel cancer targets. However, interpreting the molecular findings and accessing drugs/clinical trials is challenging. Furthermore, many tumors show resistance to monotherapies. To implement a precision strategy, we initiated a multidisciplinary (basic/translational/clinical investigators, bioinformaticians, geneticists, and physicians from multiple specialties) molecular tumor board (MTB), which included a project manager to facilitate obtaining clinical-grade biomarkers (blood/tissue NGS, specific immunohistochemistry/RNA expression including for immune-biomarkers, per physician discretion) and medication-acquisition specialists/clinical trial coordinators/navigators to assist with medication access. The MTB comprehensively reviewed patient characteristics to develop N-of-One treatments implemented by the treating physician's direction under the auspices of a master protocol. Overall, 265/429 therapy-evaluable patients (62%) were matched to ≥1 recommended drug. Eighty-six patients (20%) matched to all drugs recommended by MTB, including combinatorial approaches, while 38% received physician's choice regimen, generally with unmatched approach/low degree of matching. Our results show that patients who receive MTB-recommended regimens (versus physician choice) have significantly longer progression-free (PFS) and overall survival (OS), and are better matched to therapy. High (≥50%) versus low (<50%) Matching Score therapy (roughly reflecting therapy matched to ≥50% versus <50% of alterations) independently correlates with longer PFS (hazard ratio [HR], 0.63; 95% confidence interval [CI], 0.50-0.80; P < 0.001) and OS (HR, 0.67; 95% CI, 0.50-0.90; P = 0.007) and higher stable disease ≥6 months/partial/complete remission rate (52.1% versus 30.4% P < 0.001) (all multivariate). In conclusion, patients who receive MTB-based therapy are better matched to their genomic alterations, and the degree of matching is an independent predictor of improved oncologic outcomes including survival.


Conflict of interest statement

S.K. serves as a consultant for Foundation Medicine and receives speaker’s fees from Roche. R.E. serves as a consultant for GSK, Merck, Eisai, Clovis Oncology, AstraZenica, Pfizer and Iovance. He has received speaker fees from AstraZenica and Merck. A.S. reports research funding and honoraria from Pfizer and Varian Medical Systems, consultant fees from AstraZeneca and Jounce Therapeutics, personal fees from Merck, and is the scientific founder with equity interest in Toragen Inc. outside the submitted work. J.K.S. receives research funds from Foundation Medicine Inc. and Amgen, as well as consultant fees from Grand Rounds, Deciphera and LOXO. R.K. has research funding from Incyte, Genentech, Merck Serono, Pfizer, Sequenom, Foundation Medicine, Guardant Health, Grifols, and Konica Minolta, as well as consultant fees from LOXO, X-Biotech, Actuate Therapeutics, Genentec, Pfizer and NeoMed. She receives speaker fees from Roche, and has an equity interest in IDbyDNA and Curematch, Inc. She is a co-founder of CureMatch and Board member of CureMatch and CureMetrix. The remaining authors declare no competing interests.

Figures

Fig. 1
Fig. 1. Frequency of characterized genomic alteration from tissue NGS and cfDNA.
a Frequency of characterized genomic alterations by tissue NGS (N = 646) (also see Supplementary Table 1). TP53 was the most commonly altered (52.3% [338/646]) followed by KRAS (23.8% [154/646]), PIK3CA (15.8% [102/646]), APC (13.6% [88/646]) and CDKN2A/B (11.5% [74/646]) alterations. *Percent indicates percent of the patient with alteration. Alterations seen in >3% of patients were included. b Frequency of characterized genomic alterations by cfDNA (N = 309) (See also Supplemental Table 2). The most common alterations were seen in TP53 (48.9% [151/309]) followed by KRAS (22.3% [69/309]), PIK3CA (18.4% [57/309]), BRAF (12.3% [38/309]) and EGFR (12.0% [37/309]) alterations. *Percent indicates percent of the patient with alteration. Alterations seen in >2.5% of patients were included.
Fig. 2
Fig. 2. Progression-free survival and overall survival according to compliance with recommendation of Molecular Tumor Board and matching scores.
a Progression-free survival according to compliance with recommendation of the Molecular Tumor Board (N = 429). Progression-free survival was significantly longer when Molecular Tumor Board recommendations were followed in full (group A) when compared to patients who received physician choice regimen (group C) (A vs. C: HR, 0.68; 95% CI, 0.51–0.90; P = 0.008, A vs. B: HR, 0.80; 95% CI, 0.60–1.06; P = 0.122, B vs. C: HR, 0.85; 95% CI, 0.67–1.06; P = 0.153). b Overall survival according to compliance with recommendation of Molecular Tumor Board (N = 429). Overall survival was significantly longer when Molecular Tumor Board recommendations were followed in full (group A) when compared to patients treated with physician choice regimen (group C). (A vs. C: HR, 0.69; 95% CI, 0.49–0.98; P = 0.036, A vs. B: HR, 0.72; 95% CI, 0.51–1.01; P = 0.056, B vs. C: HR, 0.97; 95% CI, 0.74–1.27; P = 0.815). c Progression-free survival according to matching scores (N = 429). Progression-free survival was longer among higher Matching Score groups (groups A and B) when compared to lower Matching Score patients (Group D) (A vs. D: HR, 0.47; 95% CI, 0.32–0.69; P < 0.001, B vs. D: HR, 0.71; 95% CI, 0.54–0.94; P = 0.018). Similarly, Group A versus C differed significantly, with Group A doing better (A vs. C: HR, 0.53; 95% CI, 0.34–0.82; P = 0.004) and there was a trend for Group A to be better than Group B (A vs. B: HR, 0.66; 95% CI, 0.43–1.01; P = 0.057). There was no significant difference between Group B vs. C (B vs. C: HR, 0.81; 95% CI, 0.57–1.15; P = 0.23). d Overall survival according to the matching scores (N = 429). Overall survival was longer among higher Matching Score groups (Group A) when compared to lower Matching Score (Group D) and trended longer for Group B vs. D and for Group A vs. C (A vs. D: HR, 0.55; 95% CI, 0.34–0.87; P = 0.011, B vs. D: HR, 0.72; 95% CI, 0.51–1.03; P = 0.071, A vs. C: HR, 0.59; 95% CI, 0.35–1.01; P = 0.053). There was however no difference between survival in groups A vs. B and B vs. C (A vs. B: HR, 0.76; 95% CI, 0.44–1.30; P = 0.312. B vs. C: HR, 0.79; 95% CI, 0.51–1.21; P = 0.269).
Fig. 3
Fig. 3. Progression-free survival, overall survival and clinical benefit rate (SD≥ 6 months/PR/CR) according to the high (≥50%) vs. low (<50%) matching scores.
a Progression-free survival according to the high (≥50%) vs. low (<50%) matching scores (N = 429). Progression-free survival was significantly longer among patients who received therapy with high (≥50%) matching score when compared to patients treated with low (<50%) matching scores. b Overall survival according to the high (≥50%) vs. low (<50%) matching scores (N = 429). Overall survival was significantly longer among patients who received therapy with high (≥50%) Matching Score when compared to patients treated with low (<50%) Matching Scores. c Clinical benefit rate (SD ≥ 6 months/PR/CR) according to the high (≥50%) vs. low (<50%) matching scores (N = 405*). Clinical benefit rate (SD ≥ 6 months/PR/CR) was significantly higher among patients who received therapy with high (≥50%) Matching Score when compared to patients treated with low (<50%) Matching Scores (52.1% vs. 30.3% [P < 0.001]).

References

    1. Drilon A, et al. Efficacy of larotrectinib in TRK fusion-positive cancers in adults and children. N. Engl. J. Med. 2018;378:731–739. doi: 10.1056/NEJMoa1714448. - DOI - PMC - PubMed
    1. Okamura, R. et al. Analysis of NTRK alterations in pan-cancer adult and pediatric malignancies: implications for NTRK-targeted therapeutics. JCO Precis. Oncol.2018 (2018). - PMC - PubMed
    1. Drilon A, et al. Safety and antitumor activity of the multitargeted pan-TRK, ROS1, and ALK inhibitor entrectinib: combined results from two phase I trials (ALKA-372-001 and STARTRK-1) Cancer Disco. 2017;7:400–409. doi: 10.1158/2159-8290.CD-16-1237. - DOI - PMC - PubMed
    1. Shaw AT, et al. Crizotinib in ROS1-rearranged non-small-cell lung cancer. N. Engl. J. Med. 2014;371:1963–1971. doi: 10.1056/NEJMoa1406766. - DOI - PMC - PubMed
    1. Loriot Y, et al. Erdafitinib in locally advanced or metastatic urothelial carcinoma. N. Engl. J. Med. 2019;381:338–348. doi: 10.1056/NEJMoa1817323. - DOI - PubMed

Publication types

Substances