. 2020 Oct 2;11(1):4949.
doi: 10.1038/s41467-020-18659-3.

A petascale automated imaging pipeline for mapping neuronal circuits with high-throughput transmission electron microscopy

Affiliations

A petascale automated imaging pipeline for mapping neuronal circuits with high-throughput transmission electron microscopy

Wenjing Yin et al. Nat Commun. .

Abstract

Electron microscopy (EM) is widely used for studying cellular structure and network connectivity in the brain. We have built a parallel imaging pipeline using transmission electron microscopes that scales this technology, implements 24/7 continuous autonomous imaging, and enables the acquisition of petascale datasets. The suitability of this architecture for large-scale imaging was demonstrated by acquiring a volume of more than 1 mm3 of mouse neocortex, spanning four different visual areas at synaptic resolution, in less than 6 months. Over 26,500 ultrathin tissue sections from the same block were imaged, yielding a dataset of more than 2 petabytes. The combined burst acquisition rate of the pipeline is 3 Gpixel per sec and the net rate is 600 Mpixel per sec with six microscopes running in parallel. This work demonstrates the feasibility of acquiring EM datasets at the scale of cortical microcircuits in multiple brain regions and species.


Conflict of interest statement

Harvard University has filed patent applications regarding GridTape (WO2017184621A1) and the prototype reel-to-reel TEM imaging stage (WO2018089578A1) on behalf of the investigators (B.J.G., W-C.A.L.) and others. C.S.O. and M.F.M. have a financial interest in Voxa. The remaining authors declare no competing interests.

Figures

Fig. 1
Fig. 1. Experimental pipeline from sample preparation to imaging.
a Sample preparation. A mouse brain with the region of interest (ROI) indicated with green dots is sliced into thick brain sections (thickness ≥1 mm). The thick brain sections undergo histology with osmium protocol and become dark (the green square represents the ROI to be imaged with the electron microscope). After embedding, the block of tissue (1 mm scale bar) is trimmed in a hexagonal shape and prepared for ultrathin sectioning onto grids or GridTape. b Schematic cross-section of six distributed autoTEMs. c Photograph of an autoTEM system in the EM suite.
Fig. 2
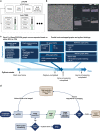
Fig. 2. Imaging pipeline and workflow.
a The architecture of piTEAM pipeline. It is composed of distributed autoTEMs for parallel imaging, an image record database, data servers, a sample database (TAO) and Multi-System Monitor (MSM). On each individual autoTEM, imaging is operated through pyTEM (acquisition software), pyTEM server, pyTEM GUI and TEM Graph. b pyTEM GUI. The left EM image is a preview while the right is an example of parallel imaging on five systems for 1 mm2 montage. The pyTEM GUI provides the user with an intuitive, web-based interface to perform manual imaging surveys as well as long serial montage runs containing hundreds or thousands of ROIs. From the web UI, any running autoTEM system can be observed and controlled. c TEM Graph key components. Images are acquired and loaded into GPU memory. A series of filter graphs apply corrections to the image (flatfield, down sampling for GUI preview). Separate graphs check image quality and statistics while the image is written to disk in parallel. d Closed-loop imaging workflow. After pyTEM receives ROIs and acquisition parameters, image acquisition is triggered, and image data are then analyzed on-the-fly on the acquisition computer. Rejected montages (those failing to meet QC thresholds) are flagged as a montage database instance to be re-imaged. If a montage passes inspection, it is sent to a data center for post-processing, alignment, and storage.
Fig. 3
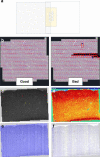
Fig. 3. Real-time quality control (QC) for capturing image and system errors.
It utilizes the template matching to detect any tile overlap issue during acquisition, and FFT score to measure the focus quality of each tile. a Diagram representing the overlap region and template matching between two image tiles (blue boxes). The template search area (yellow box) is a region of twice the tile overlap (~13% for 20Mpix camera and 9% for 50Mpix). Three templates are used per edge, and the mean and standard deviation of the three matching vectors are returned from the filter. b Good vs. Bad real-time matcher results displayed on GUI: each triangle represents a matching result (top and down or left and right). Blue hues indicate that the template is found beyond the expected position, and red hues indicate that the template is found before the expected position, and the intensity represents the magnitude of the offset between the ideal and actual locations. To test the matching operation, we introduced two types of errors shown in the bad montage. The stage position was artificially perturbed on row 4, and then on rows 10–11 the beam was blocked, resulting in black tiles. If the number of matched templates or the standard deviation of the template match vectors fail to meet thresholds, the tile is marked as an error. Imaging problems are usually detected as flagged tiles in the quality map or non-uniform QC output maps. See example QC output maps: c matcher quality map; d focus map (color code is arbitrary as color is used only to identify any non-uniform pattern); e x-offset from ideal; f y-offset from ideal. Blue hue indicates positive stage offset comparing to the target position, and red hue indicates negative offset. The intensity represents the magnitude of the offset.
Fig. 4
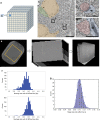
Fig. 4. Imaging of a cubic millimeter of mouse cortex with piTEAM.
a Scaling from 0.003 mm3 to 1 mm3, a 300-fold volume increase; b High-resolution electron microscopy image tile from the 1 mm3 dataset with neuronal somata highlighted in yellow and glia in green (scale bar 5 µm). c Zoomed-in area from (b) showing synapse with dendritic spine (scale bar 1 µm); d Zoomed-in area from (b) showing synapse with dendritic shaft (scale bar 1 µm); e Low-mag EM image of an aperture with an ROI highlighted; 2D stacked montage minimap and aligned 3D volume. f Distribution of montage acquisition rate (frames per second) achieved during 1 mm3 production. The plots represent a sample size of over 1000 sections imaged by 20 Mpixel and 50 Mpixel cameras each. g Example of stage step-and-settle time distribution for GridStage.
Fig. 5
Fig. 5. Imaging rate scaling roadmap.
a 1st generation platform using 20 Mpixel XIMEA camera; b 2nd generation platform with 50 Mpixel XIMEA camera (currently our platform contains six systems for parallel imaging); c AMT integrated column extension that can be combined with future commercial 100+ Mpix camera with back side illumination; d An example of Cricket which is a synchronous image sub-scanner and beam blanker. The inset is a 3 × 3 supertile acquired by Cricket sub-beam scanner. The electron beam is raster scanned to allow large fields of view to be quickly imaged.

References

    1. Sjöstrand FS. Ultrastructure of retinal rod synapses of the guinea pig eye as revealed by three-dimensional reconstructions from serial sections. J. Ultrastruct. Res. 1958;2:122–170. doi: 10.1016/S0022-5320(58)90050-9. - DOI - PubMed
    1. White JG, Southgate E, Thomson JN, Brenner S. The structure of the nervous system of the nematode caenorhabditis elegans. Philos. Trans. R. Soc. B Biol. Sci. 1986;314:1–340. - PubMed
    1. Gray EG. Electron microscopy of synaptic contacts on dendrite spines of the cerebral cortex. Nature. 1959;183:1592–1593. doi: 10.1038/1831592a0. - DOI - PubMed
    1. Bumbarger DJ, Riebesell M, Rödelsperger C, Sommer RJ. System-wide rewiring underlies behavioral differences in predatory and bacterial-feeding nematodes. Cell. 2013;152:109–119. doi: 10.1016/j.cell.2012.12.013. - DOI - PubMed
    1. Jarrell TA, et al. The connectome of a decision-making neural network. Sci. (80-.) 2012;337:437–444. doi: 10.1126/science.1221762. - DOI - PubMed

Publication types