. 2020 Oct 2;11(1):4939.
doi: 10.1038/s41467-020-18739-4.

Phylogenomic analysis sheds light on the evolutionary pathways towards acoustic communication in Orthoptera

Affiliations

Phylogenomic analysis sheds light on the evolutionary pathways towards acoustic communication in Orthoptera

Hojun Song et al. Nat Commun. .

Erratum in

Abstract

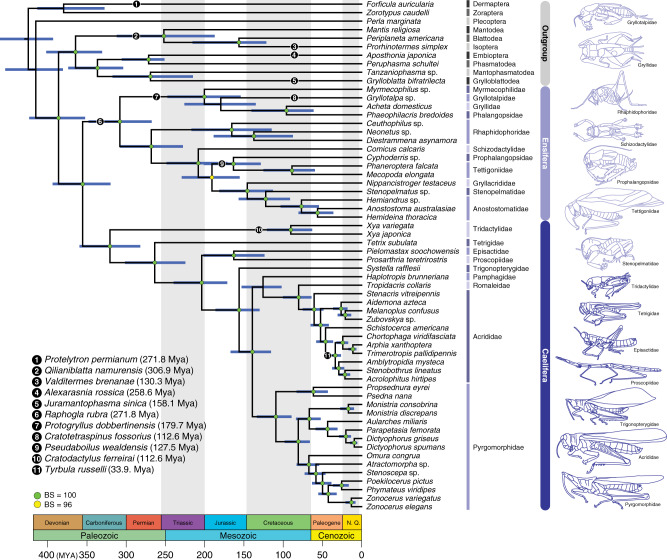
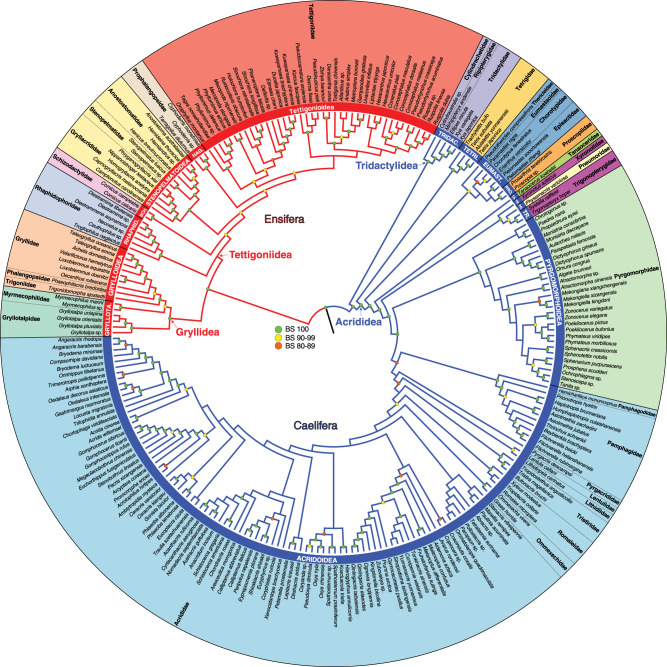
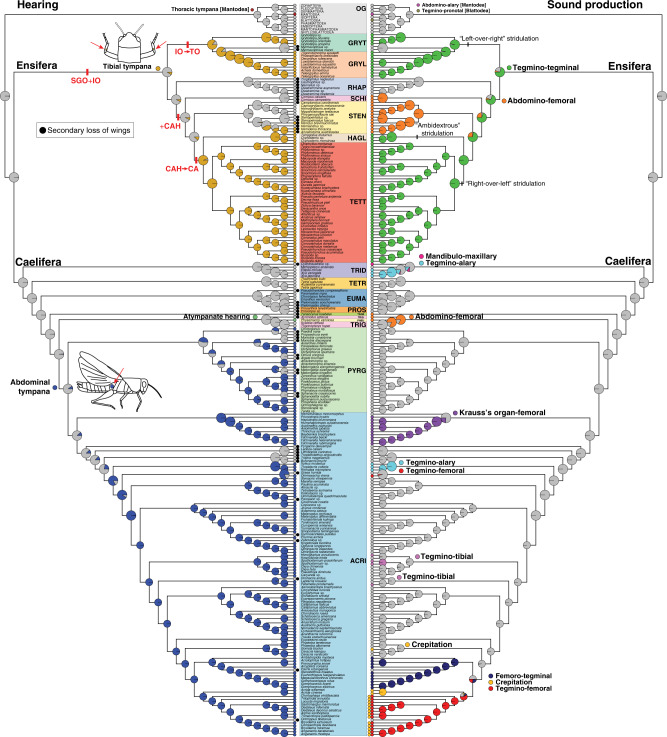
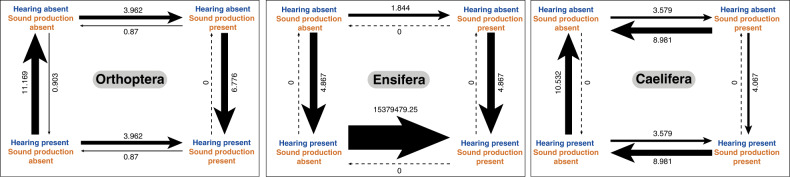
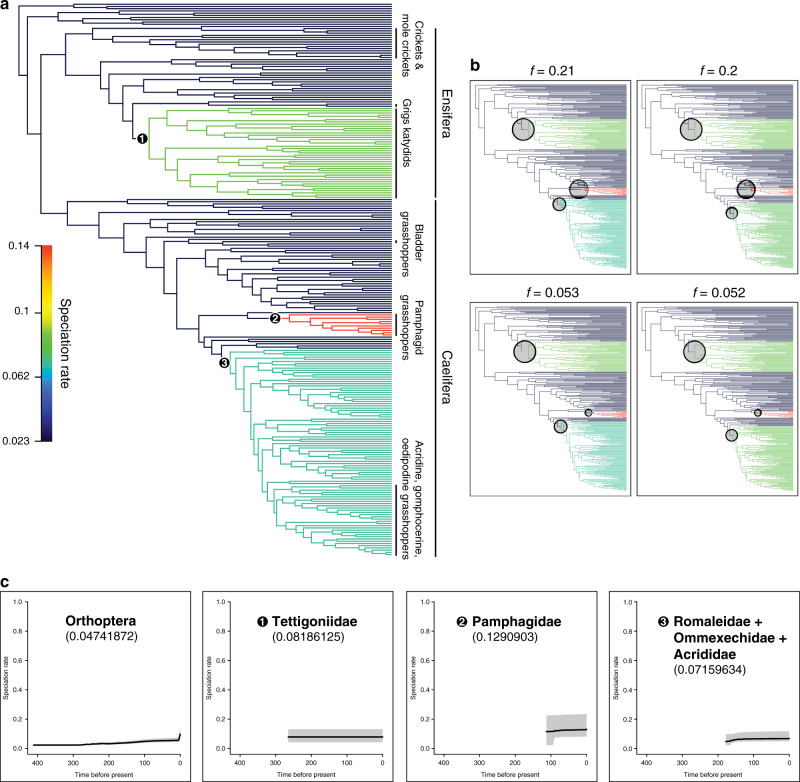
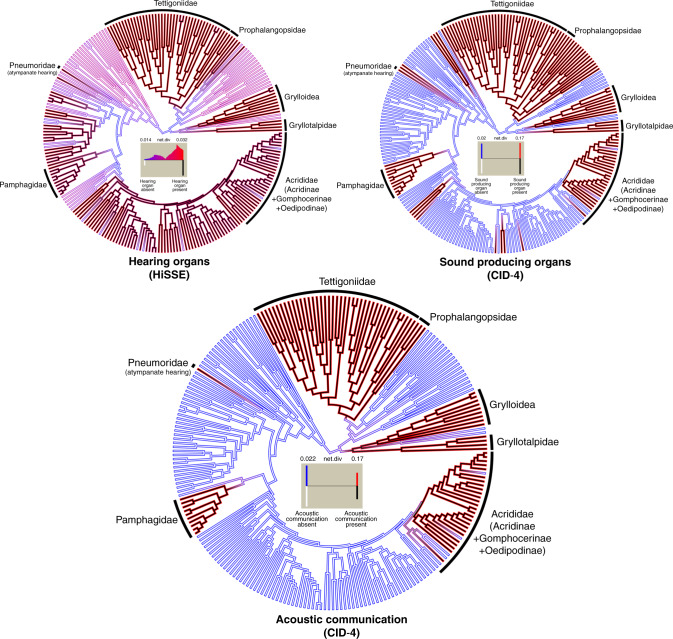
Acoustic communication is enabled by the evolution of specialised hearing and sound producing organs. In this study, we performed a large-scale macroevolutionary study to understand how both hearing and sound production evolved and affected diversification in the insect order Orthoptera, which includes many familiar singing insects, such as crickets, katydids, and grasshoppers. Using phylogenomic data, we firmly establish phylogenetic relationships among the major lineages and divergence time estimates within Orthoptera, as well as the lineage-specific and dynamic patterns of evolution for hearing and sound producing organs. In the suborder Ensifera, we infer that forewing-based stridulation and tibial tympanal ears co-evolved, but in the suborder Caelifera, abdominal tympanal ears first evolved in a non-sexual context, and later co-opted for sexual signalling when sound producing organs evolved. However, we find little evidence that the evolution of hearing and sound producing organs increased diversification rates in those lineages with known acoustic communication.


Conflict of interest statement

The authors declare no competing interests.

Figures

Fig. 1
Fig. 1. Dated phylogeny of Orthoptera based on the phylogenomic data.
This chronogram is a result of a divergence time estimate analysis based on the most decisive data set (Daa,trans,strict) consisting of 436,488 aligned amino acids. Bootstrap support (BS) values are indicated by coloured nodes (green: BS = 100; yellow: BS = 96); values below 90 are not shown. Divergence time estimates were calculated using 86,043 amino-acid sites and 11 fossil calibrations (species names and dates listed on figure). Blue bars indicate 95% credibility intervals of node ages. Geological timescale is shown at the bottom. Additional details on data generation and analyses can be found in Supplementary Methods 1 and 2.
Fig. 2
Fig. 2. Comprehensive phylogeny of Orthoptera.
This phylogeny is estimated based on analyses of data from transcriptomes and mitochondrial genomes (Dnt,trans+mito,strict). The tree is derived from a maximum likelihood analysis of 448,861 aligned sites of nucleotides. Bootstrap support (BS) values are indicated by coloured nodes (green: BS = 100; yellow: BS = 90-99; orange: BS = 80-89). Red branches indicate the suborder Ensifera and blue branches indicate Caelifera. The red and blue clade names indicated by arrows (Gryllidea, Tettigoniidea, Tridactylidea and Acrididea) are infraorder names. The names in white, in red or blue bars are superfamily names. Broad circular bars are colour-coded by superfamily. TRIDAC Tridactyloidea, TETRI Tetrigoidea, EUMAST Eumastacoidea, PRO Proscopioidea, TA Tanaoceroidea, TR Trignopterygoidea, PN Pneumoroidea, GRYLLOTA Gryllotalpoidea, RHAPHID Rhaphidophoroidea, SCH Schizodactyloidea, HAG Hagloidea.
Fig. 3
Fig. 3. Ancestral character state reconstruction of hearing and sound-producing organs.
The topology used for this analysis is the comprehensive phylogeny based on Dnt,trans+mito,strict (presented in Fig. 2). The coloured circle at each branch tip indicates the character state of the corresponding species, with grey circles indicating the absence. The coloured circle at each node shows the probability of each ancestral character state. On the left, the character evolution of hearing organs is shown and the character states are colour-coded. In addition to the ancestral character state reconstruction, two additional traits are mapped. The first trait is the internal sensory organs in the ensiferan foretibia, shown in red. The ancestral condition for Ensifera is the presence of the subgenual organ (SGO) and the intermediate organ (IO). In the common ancestor of Gryllidea, IO was modified to tibial organ (TO), Rhaphidophoridae retains the ancestral SGO + IO. In the common ancestor of Schizodactyloidea, Stenopelmatoidea, Hagloidea and Tettigonioidea, a novel third component known as crista acustica homologue (CAH) evolved. In the common ancestor of Hagloidea and Tettigonioidea, CAH was modified to an auditory sensory organ called crista acustica (CA). The second trait is the loss of wings, which is indicated by black circles. Often, the species that lack tympanal hearing also have lost wings. On the right, the character evolution of sound-producing organs, in the form of stridulatory apparatus, is shown, and the character states are colour-coded. We used a specific naming convention in which the first-named structure has the stridulatory file and the second named structure has the scraper. For example, abdominal-femoral stridulation would have the stridulatory files on the abdomen and the scraper on the inner side of hind femora. Different mechanics of tegmino-tegminal stridulation are mapped onto the phylogeny. The common ancestor of Gryllidea evolved “left-over-right” stridulation, the common ancestor of Hagloidea evolved “ambidextrous” stridulation, and the common ancestor of Tettigonioidea evolved “right-over-left” stridulation. OG Outgroups, GRYT Gryllotalpoidea, GRYL Grylloidea, RHAP Rhaphidophoroidea, SCHI Schizodactyloidea, STEN Stenopelmatoidea, HAG Hagloidea, TETT Tettigonioidea, TRID Tridactyloidea, TETR Tetrigoidea, EUMAS Eumastacoidea, PROS Proscopioidea, TANA Tanaoceroidea, TRIG Trignopterygoidea, PNEU Pneumoroidea, PYRG Pyrgomorphoidea, ACRI Acridoidea.
Fig. 4
Fig. 4. Evolutionary correlation between hearing and sound production in Orthoptera.
Pagel’s test for evolutionary correlation was calculated between hearing and sound production in Orthoptera and its two suborders, Ensifera and Caelifera. The thickness of arrows corresponds to the rate of change from one combination of trait states (i.e. no hearing and no sound production) to another combination (i.e. no hearing and sound production). The higher the rate, the thicker the arrow. In each of the three analyses, there is a strong evolutionary correlation between hearing and sound production, but the patterns are different. In Orthoptera as a whole, the strongest transition rate is from hearing present & sound production absent to both hearing and sound production absent. In Ensifera, the strongest rate is from hearing present & sound production absent to both hearing and sound production present. In Caelifera, the strongest transition rate is from hearing present and & sound production absent to both hearing and sound production absent. The differences between Ensifera and Caelifera show that the co-evolutionary dynamics between hearing and sound production differ between the two lineages.
Fig. 5
Fig. 5. Bayesian analysis of macroevolutionary mixtures for Orthoptera.
The ultrametric tree used in this analysis is the dated phylogeny based on the combined data (Dnt,trans+mito,strict). a Phylorate plot showing speciation rates (cool colours = slow, warm = fast; specific rate range shown in the vertical colour legend) along each branch of the Orthoptera phylogeny. The three clades indicated by the black circled nodes are the clades with increased rate shifts. Lineages that show acoustic communication are indicated with vertical lines near the terminals. Branches are coloured according to the rate shifts. b About 95% credible sets of macroevolutionary shift configurations. f value of 0.21 indicates that 21% of the samples in posterior can be assigned to shift configuration shown in the upper left plot. These four shift configurations collectively account for 51.5% of the posterior distribution. c Clade-specific evolutionary rate variation through time for Orthoptera and the three lineages identified to have rate shifts.
Fig. 6
Fig. 6. Models of trait-dependent diversification.
Character reconstruction of states and net diversification rates estimated using multimodel inference methods implemented in hisse. Shown here are the best-fitting models for each tested trait (presence/absence of hearing organs, of sound hearing organs and of acoustic communication) from the 24 models of trait-dependent and trait-independent diversification models. All clades that are characterised by having sexual communication using acoustic signalling are labelled in the circular trees, and estimates of the most likely state and rate are based on the model-averaged marginal reconstructions inferred under the best-fitting models. The histograms inside the trees show the location of the rates on a gradient of rates, as well as the frequency of both these rates and states for each contemporary tip taxa. For hearing organs, the best-fitting model was one of the HiSSE models, but for both sound-producing organs and acoustic communication, the best-fitting model was one of the trait-independent diversification models (CID-4).

References

    1. Brumm, H. Animal Communication and Noise (Springer, 2013).
    1. Hedwig, B. Insect Hearing and Acoustic Communication (Springer, 2014).
    1. Ewing, A. W. Arthropod Bioacoustics: Neurobiology and Behaviour (Cornell Univ. Press, 1989).
    1. Chen Z, Wiens JJ. The origins of acoustic communication in vertebrates. Nat. Commun. 2020;11:369. - PMC - PubMed
    1. Ladich F, Winkler H. Acoustic communication in terrestrial and aquatic vertebrates. J. Exp. Biol. 2017;220:2306–2317. - PubMed

Publication types

LinkOut - more resources