. 2021 Feb;101(2):177-192.
doi: 10.1038/s41374-020-00490-5. Epub 2020 Oct 2.

Kras mutation rate precisely orchestrates ductal derived pancreatic intraepithelial neoplasia and pancreatic cancer

Affiliations

Kras mutation rate precisely orchestrates ductal derived pancreatic intraepithelial neoplasia and pancreatic cancer

Kanchan Singh et al. Lab Invest. 2021 Feb.

Erratum in

Abstract

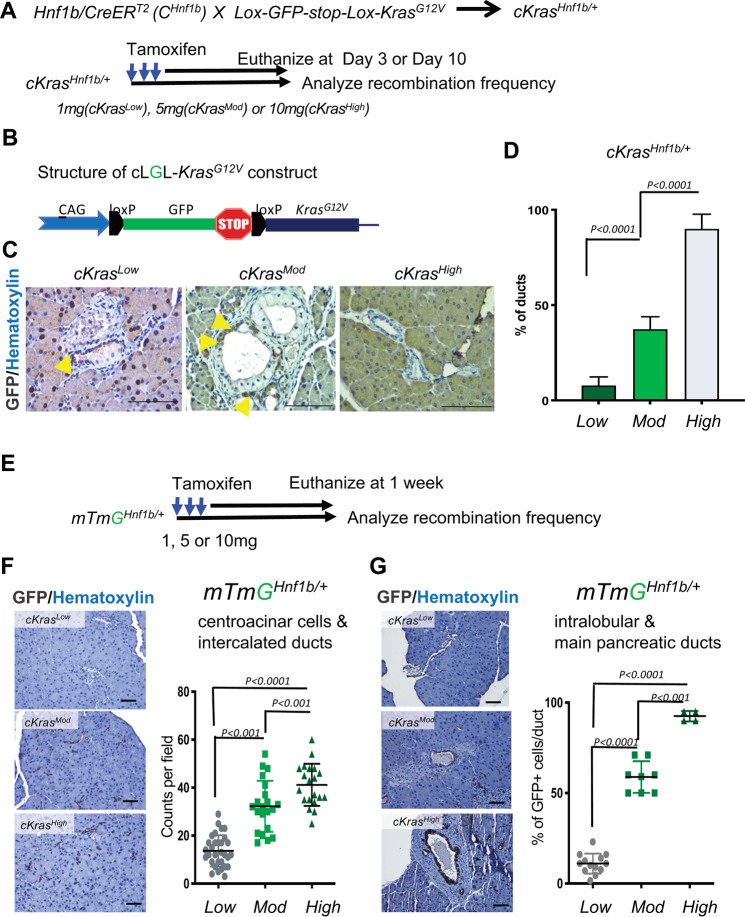
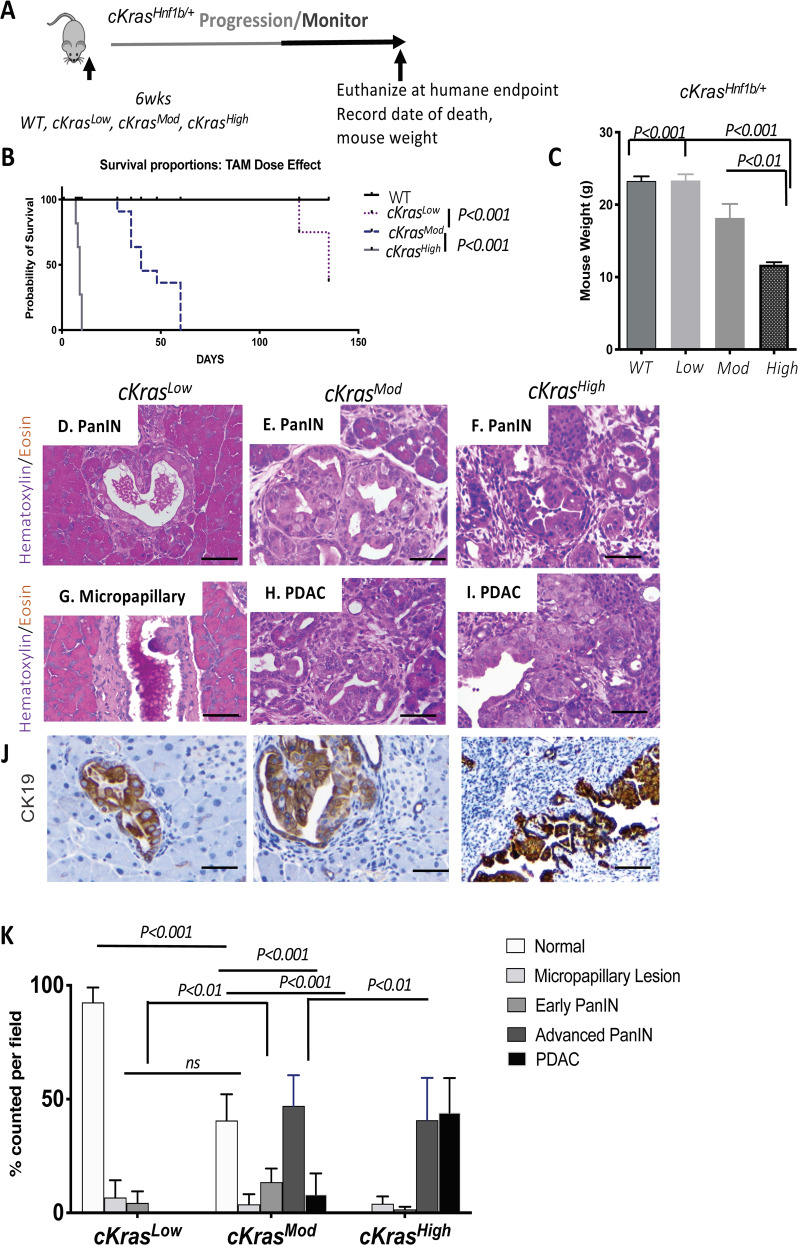
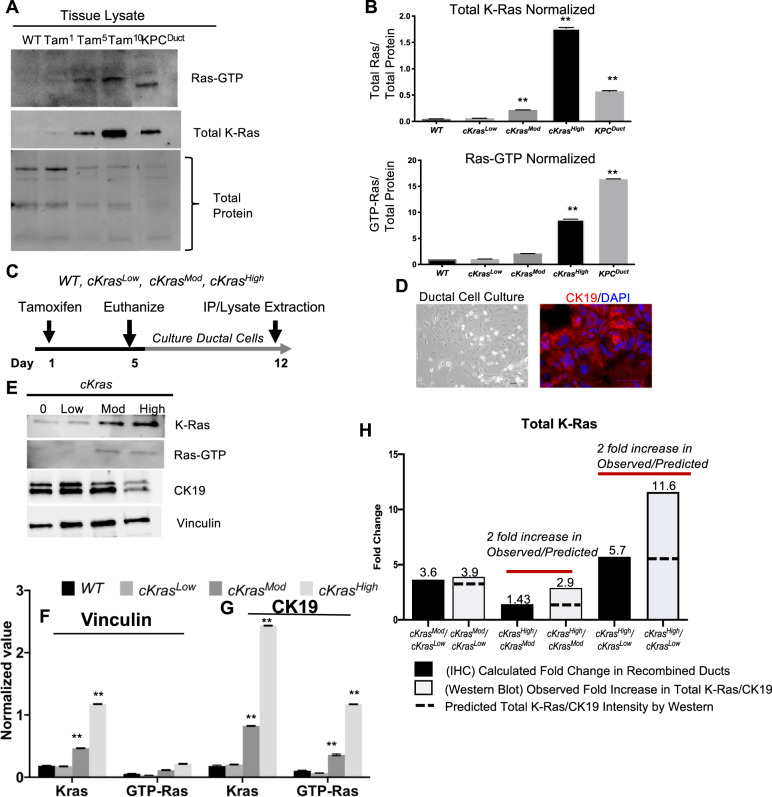
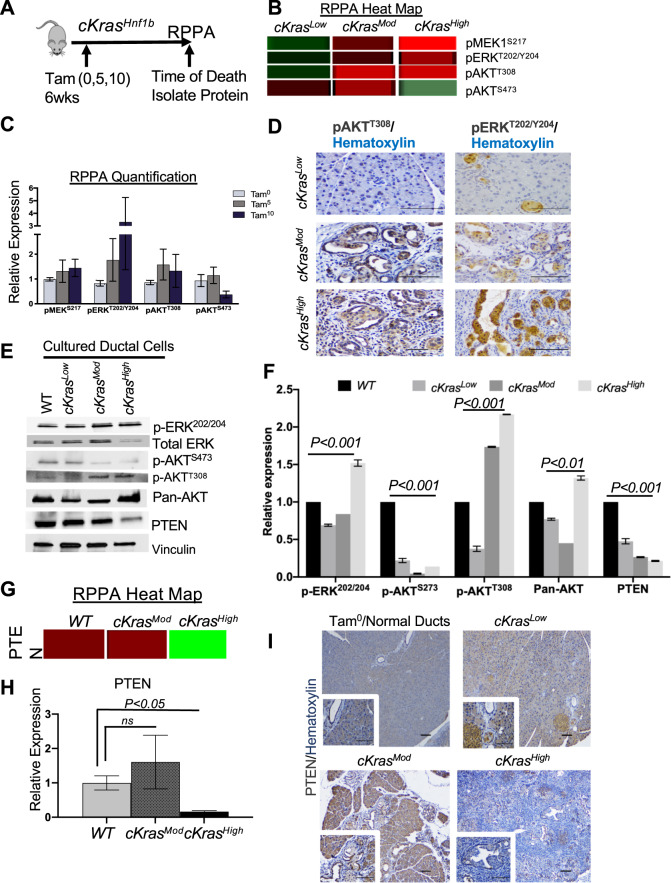
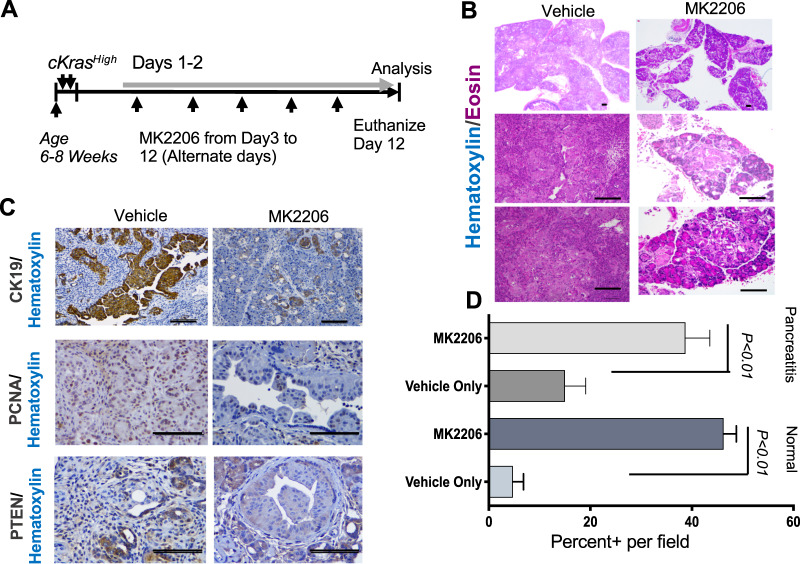
Pancreatic ductal adenocarcinoma (PDAC) is the third leading cause of cancer-related death in the United States. Despite the high prevalence of Kras mutations in pancreatic cancer patients, murine models expressing the oncogenic mutant Kras (Krasmut) in mature pancreatic cells develop PDAC at a low frequency. Independent of cell of origin, a second genetic hit (loss of tumor suppressor TP53 or PTEN) is important for development of PDAC in mice. We hypothesized ectopic expression and elevated levels of oncogenic mutant Kras would promote PanIN arising in pancreatic ducts. To test our hypothesis, the significance of elevating levels of K-Ras and Ras activity has been explored by expression of a CAG driven LGSL-KrasG12V allele (cKras) in pancreatic ducts, which promotes ectopic Kras expression. We predicted expression of cKras in pancreatic ducts would generate neoplasia and PDAC. To test our hypothesis, we employed tamoxifen dependent CreERT2 mediated recombination. Hnf1b:CreERT2;KrasG12V (cKrasHnf1b/+) mice received 1 (Low), 5 (Mod) or 10 (High) mg per 20 g body weight to recombine cKras in low (cKrasLow), moderate (cKrasMod), and high (cKrasHigh) percentages of pancreatic ducts. Our histologic analysis revealed poorly differentiated aggressive tumors in cKrasHigh mice. cKrasMod mice had grades of Pancreatic Intraepithelial Neoplasia (PanIN), recapitulating early and advanced PanIN observed in human PDAC. Proteomics analysis revealed significant differences in PTEN/AKT and MAPK pathways between wild type, cKrasLow, cKrasMod, and cKrasHigh mice. In conclusion, in this study, we provide evidence that ectopic expression of oncogenic mutant K-Ras in pancreatic ducts generates early and late PanIN as well as PDAC. This Ras rheostat model provides evidence that AKT signaling is an important early driver of invasive ductal derived PDAC.


Conflict of interest statement

The authors declare that they have no conflict of interest.

Figures

Fig. 1
Fig. 1. Tamoxifen dosage directly correlates with recombination frequency in pancreatic ducts.
a Schematic showing the experimental strategy to lineage trace Hnf1b+ duct cells in the pancreas of cKrasHnf1b/+ mice for analysis of tamoxifen mediated CreERT2 recombination. At an age of 6–8 weeks, mice received 1 mg (cKrasLow), 5 mg (cKrasMod), or 10 mg (cKrasHigh) of tamoxifen and were analyzed at both early and late timepoints. b Structure of the cLGL-KrasG12V ectopic expression transgene. cKras was engineered following a human CMV and chicken-β-actin chimeric promoter (CAG) and blocked by the proximal insertion of a loxP-green fluorescent protein (GFP)-Stop-loxP cassette (c) Lineage tracing shows that PDAC precursors (PanIN and micropapillary lesions) and associated PDAC arise in pancreatic ducts of mice. Recombination in ducts depends on tamoxifen dosage (yellow arrows show nonrecombined ducts in cKrasLow and cKrasMod at end point and cKrasHigh mice at day3 post tamoxifen). d Quantification of percentage of ductal cells recombined in cKrasLow, cKrasMod, and cKrasHigh mice. We observed a significant increase in recombination comparing cKrasLow (7.8 ± 4.5%) to cKrasMod (37.3 ± 6.5%) and cKrasMod to cKrasHigh (90 ± 7.62%). e Schematic showing the experimental strategy to lineage trace Hnf1b+ duct cells in the pancreas of mTmGHnf1b/+ for analyzing tamoxifen mediated Cre recombination. Mice received 1, 5, and 10 mg of tamoxifen and were analyzed at 1 week. f and g IHC staining for GFP and quantification of recombined centroacinar and intercalated ducts. GFP immunolabeling significantly increased in centroacinar and intercalated ducts in mTmGHnf1b/+ High mice with an average count of 41/field compared to mTmGHnf1b/+ Low (13/field) or mTmGHnf1b/+ Mod (32/field) mice. mTmGHnf1b/+ Mod mice had significantly higher numbers of recombined centroacinar cells and intercalated ducts than mTmGHnf1b/+ Low mice (P < 0.001). g When analyzing recombination in main pancreatic and intralobular ducts, we observed a significant increase in mTmGHnf1b/+ Mod (58% ducts/field) and mTmGHnf1b/+ High (92% of ducts/field) mice compared to mTmGHnf1b/+ Low mice (11% ducts/field). Statistical analysis was performed using a Two-way Anova in Prism GraphPad software.
Fig. 2
Fig. 2. Pathologic outcomes of increasing the percentage of pancreatic ductal cells expressing cKras.
a Schematic of experimental plan to study the effect of titrating tamoxifen given to mice to study recombination efficiency and effects on pancreatic histology. b Increased dosage of tamoxifen significantly decreases survival of cKrasHnf1b/+ mice. cKrasHigh mice survive an average of 10 days, cKrasMod mice survive an average of 42 days and 50% of cKrasLow mice are still alive 138 days after administered tamoxifen. The other 50% had to be euthanized. c cKrasHigh and cKrasMod have a significant reduction in body weight at time of death (P < 0.001) compared to littermate control weight and cKrasLow mice at time of death. Statistical analysis was evaluated using a student’s t test. di Representative H&E images and CK19 IHC of pancreas from cKrasLow, cKrasMod and cKrasHigh mice. d cKrasLow mice show limited early PanIN and (g) Micropapillary lesions. (e) cKrasMod mice have early and advanced PanIN and (h) PDAC whereas cKrasHigh mice have predominantly advanced PanIN (f) and PDAC(I). (j) CK19 labeling of ductal lesions in cKrasLow, cKrasMod and cKrasHigh mice. k Quantification of normal ducts, micropapillary lesions, early PanIN, advanced PanIN, and PDAC as a consequence of tamoxifen dosage. Lesions were counted and percentages were calculated using total ducts as the denominator. A two-way Anova using Prism Graphpad software evaluated statistical significance. An n = 8 mice per tamoxifen dosage was used for pathologic analysis. Scale bars are 50 µM.
Fig. 3
Fig. 3. cKrasMod expression in murine pancreata results in full spectrum of PanIN and PDAC.
a H&E images of early (i) and advanced (ii) PanIN lesions arising in pancreatic ducts of cKrasMod mice. Early PanIN (EP) have columnar epithelium and mucin and papillary outgrowths (ii) advanced PanIN (AP) occasionally have loss of basement membrane. b Serial section panel is Alcian blue staining of tissue shown in (a). Scale bars are 50 µM.
Fig. 4
Fig. 4. Pancreatitis and fibrostroma are elevated in cKrasMod and cKrasHigh pancreata.
a Representative H&E images of cKrasLow, cKrasMod, and cKrasHigh mice showing increasing pancreatitis surrounding the ductal lesions with increased Kras expression. Increased lymphocyte infiltration can be noted. b Trichrome staining of pancreas from cKrasLow, cKrasMod, and cKrasHigh showing increased fibrillar collagen. c and d quantification of pancreatitis and fibrillar collagen per field in cKrasLow, cKrasMod, and cKrasHigh mice. 5 fields per slide were selected for quantification and 5 mice were analyzed per tamoxifen dose. Analysis of pancreatitis area and collagen+ stroma were completed using imageJ software with color deconvolution plugin (Supplementary Fig. 5). Statistical analysis was done using a one-way Anova and Prism Graphpad software.
Fig. 5
Fig. 5. Tamoxifen dose is directly related to total Ras levels and signaling.
a Lysates from wild-type pancreas (Lane1), cKrasLow, cKrasMod, and cKrasHigh murine pancreas (lanes 2,3,4) were affinity precipitated with Raf RBD agarose and subjected to immunoblot analysis with anti-Ras antibody. b Quantification of Total Ras protein and RAS-GTP to total protein confirmed a significant increase in Ras expression and GTP bound Ras with increased tamoxifen dosage. c Experimental plan to establish ductal cell culture from cKrasHnf1b/+ mice. d Brightfield image of primary pancreatic duct culture and adjacent panel showing CK19 IF labeling confirming ducts. Western blot analysis of lysates from primary ducts cultured from WT, cKrasLow, cKrasMod, and cKrasHigh murine pancreas four days after tamoxifen administration. f Normalization of western blot image. Normalization of protein expression was done in triplicate using vinculin as the control for ductal cell culture expression analysis. g Normalization of total K-Ras and GTP bound Ras using CK19 as epithelial marker control for duct cells indicates increased K-Ras expression per cells with increased tamoxifen dose. h Comparison of K-Ras expression predicted vs calculated based on IHC and western analysis indicating increased K-Ras expression per cell with increased tamoxifen dosage. Statistical analysis was done using a Two-way Anova in Prism GraphPad.
Fig. 6
Fig. 6. Proteomic analysis of ductal PDAC reveals loss of PTEN.
a Schematic and (b) RPPA heat map data showing increased pMEKS127, pERKT202/Y204, pAKTT308, and decreased expression of pAKTS273 in lysates from WT, cKrasMod, and cKrasHigh pancreata. c Quantification of RPPA relative expression data. d IHC analysis of pAKTT308 and pERKT202/Y204 in WT, cKrasMod and cKrasHigh pancreata confirms RPPA data that pAKTT308 and pERKT202/Y204 are significantly increased in cKrasMod and cKrasHigh pancreata relative to cKrasLow. e Western blot analysis of downstream signaling pathways in WT, cKrasLow, cKrasMod, and cKrasHigh cultured pancreatic ducts. f Quantification of western blot data normalized to vinculin. g Heatmap and (h) quantification for PTEN relative expression in WT, cKrasMod, and cKrasHigh mice. (i) IHC staining for PTEN of pancreata from cKrasLow, cKrasMod, and cKrasHigh mice (Zoomed in ×40 magnification images in inset). PTEN expression in normal ducts can be seen in cKrasLow, cKrasMod, and cKrasHigh mice. Scale bars are 50 µM.
Fig. 7
Fig. 7. Kras signaling through AKT is important for ductal derived PDAC.
a Schematic of experimental setup to study the role of AKT in cKrasHigh mice. b Representative H&E sections (×4 and ×20 magnification) show a significant reduction in PDAC in cKrasHigh pancreata from mice treated with MK2206 relative to vehicle control (n = 5 mice analyzed per treatment). c CK19, PCNA, and PTEN IHC in vehicle control versus MK2206 treated mice. We observe a reduction in IHC staining for CK19 and PCNA. In resistant advanced PanIN, we observe sustained loss of PTEN. d Quantification of normal and pancreatitis percent positive per ×20 field quantified (n = 5 per mouse). We observe a significant increase in normal pancreas in MK2206 treated mice. While we do not observe PDAC in MK2206 mice, we do observe significant pancreatitis, indicating sustained inflammation even in the setting of MK2206 treatment. Scale bars are 50 μM. Statistical analysis was performed using a student’s test, Prism GraphPad software.

References

    1. Hoadley KA, Yau C, Hinoue T, Wolf DM, Lazar AJ, Drill E, et al. Cell-of-origin patterns dominate the molecular classification of 10,000 tumors from 33 types of cancer. Cell. 2018;173:291–304. - PMC - PubMed
    1. Visvader JE. Cells of origin in cancer. Nature. 2011;469:314–22. - PubMed
    1. Kuboki Y, Fischer CG, Beleva Guthrie V, Huang W, Yu J, Chianchiano P, et al. Single-cell sequencing defines genetic heterogeneity in pancreatic cancer precursor lesions. J Pathol. 2019;247:347–56. - PMC - PubMed
    1. Lee AYL, Duboi CL, Sarai K, Zarei S, Schaeffer DF, Sander M, et al. Cell of origin affects tumour development and phenotype in pancreatic ductal adenocarcinoma. Gut. 2019;68:487–98. - PMC - PubMed
    1. Öhlund D, Handly-Santana A, Biffi G, Elyada E, Almeida AS, Ponz-Sarvise M, et al. Distinct populations of inflammatory fibroblasts and myofibroblasts in pancreatic cancer. J Exp Med. 2017;214:579–96. - PMC - PubMed

Publication types

MeSH terms

Substances