Review
. 2021 Dec;54(6):1706-1729.
doi: 10.1002/jmri.27367. Epub 2020 Oct 2.

Role of Structural, Metabolic, and Functional MRI in Monitoring Visual System Impairment and Recovery

Affiliations
Review

Role of Structural, Metabolic, and Functional MRI in Monitoring Visual System Impairment and Recovery

Jeffrey R Sims et al. J Magn Reson Imaging. 2021 Dec.

Abstract

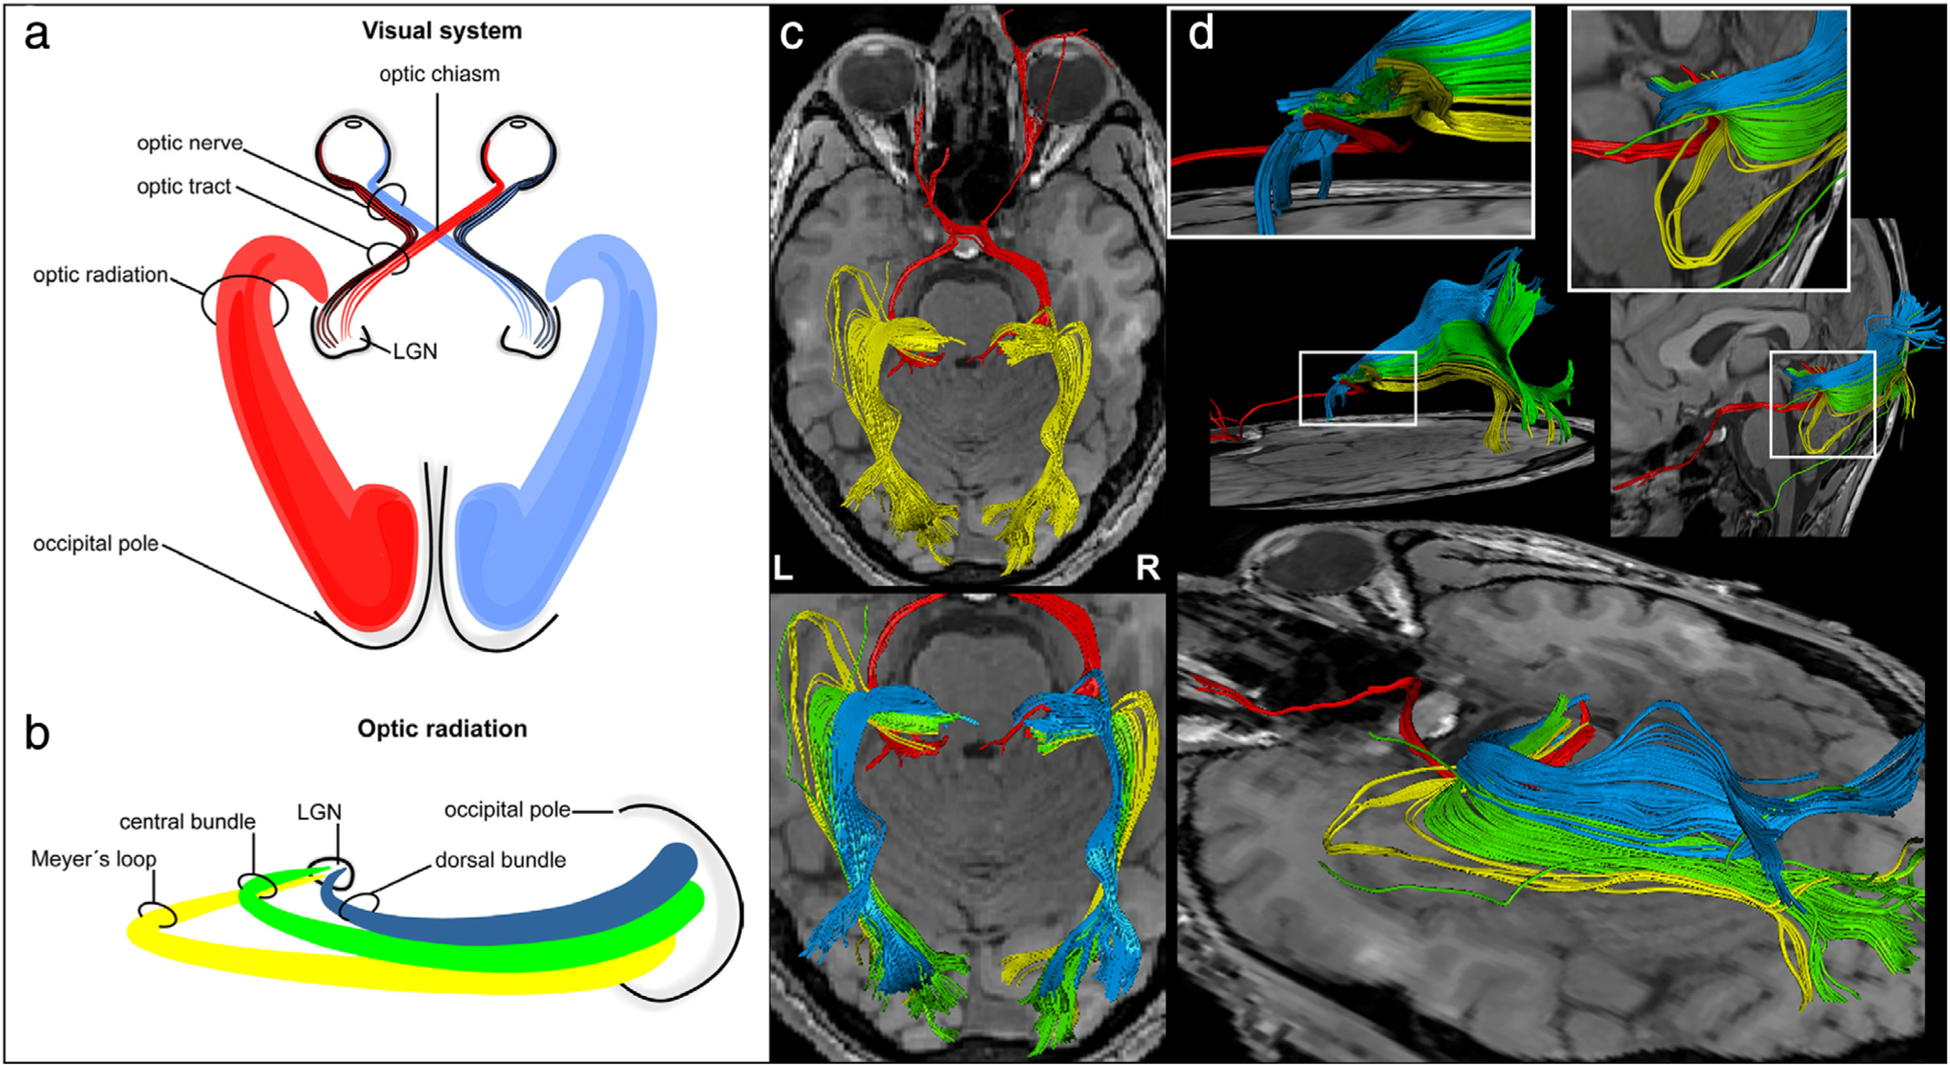
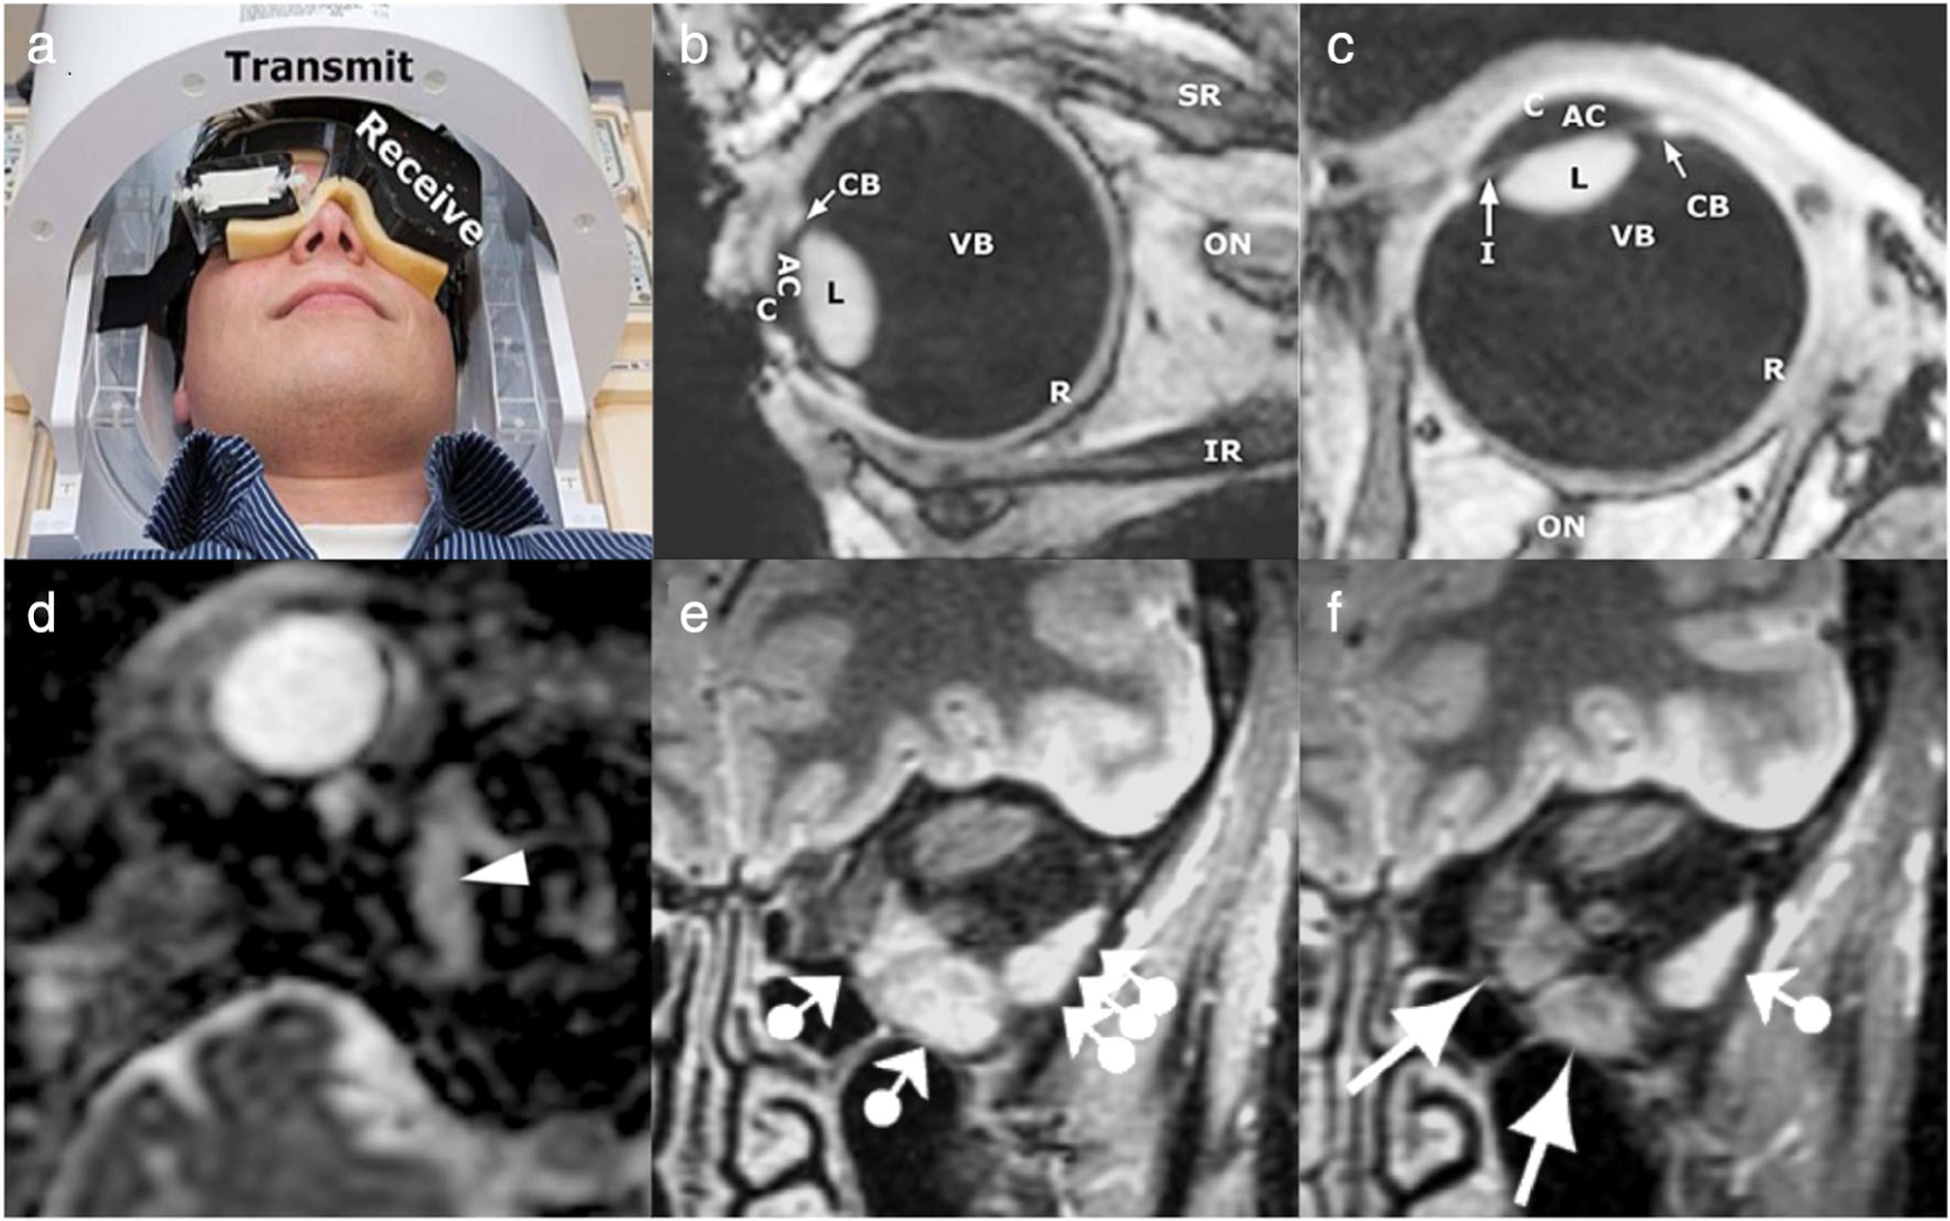
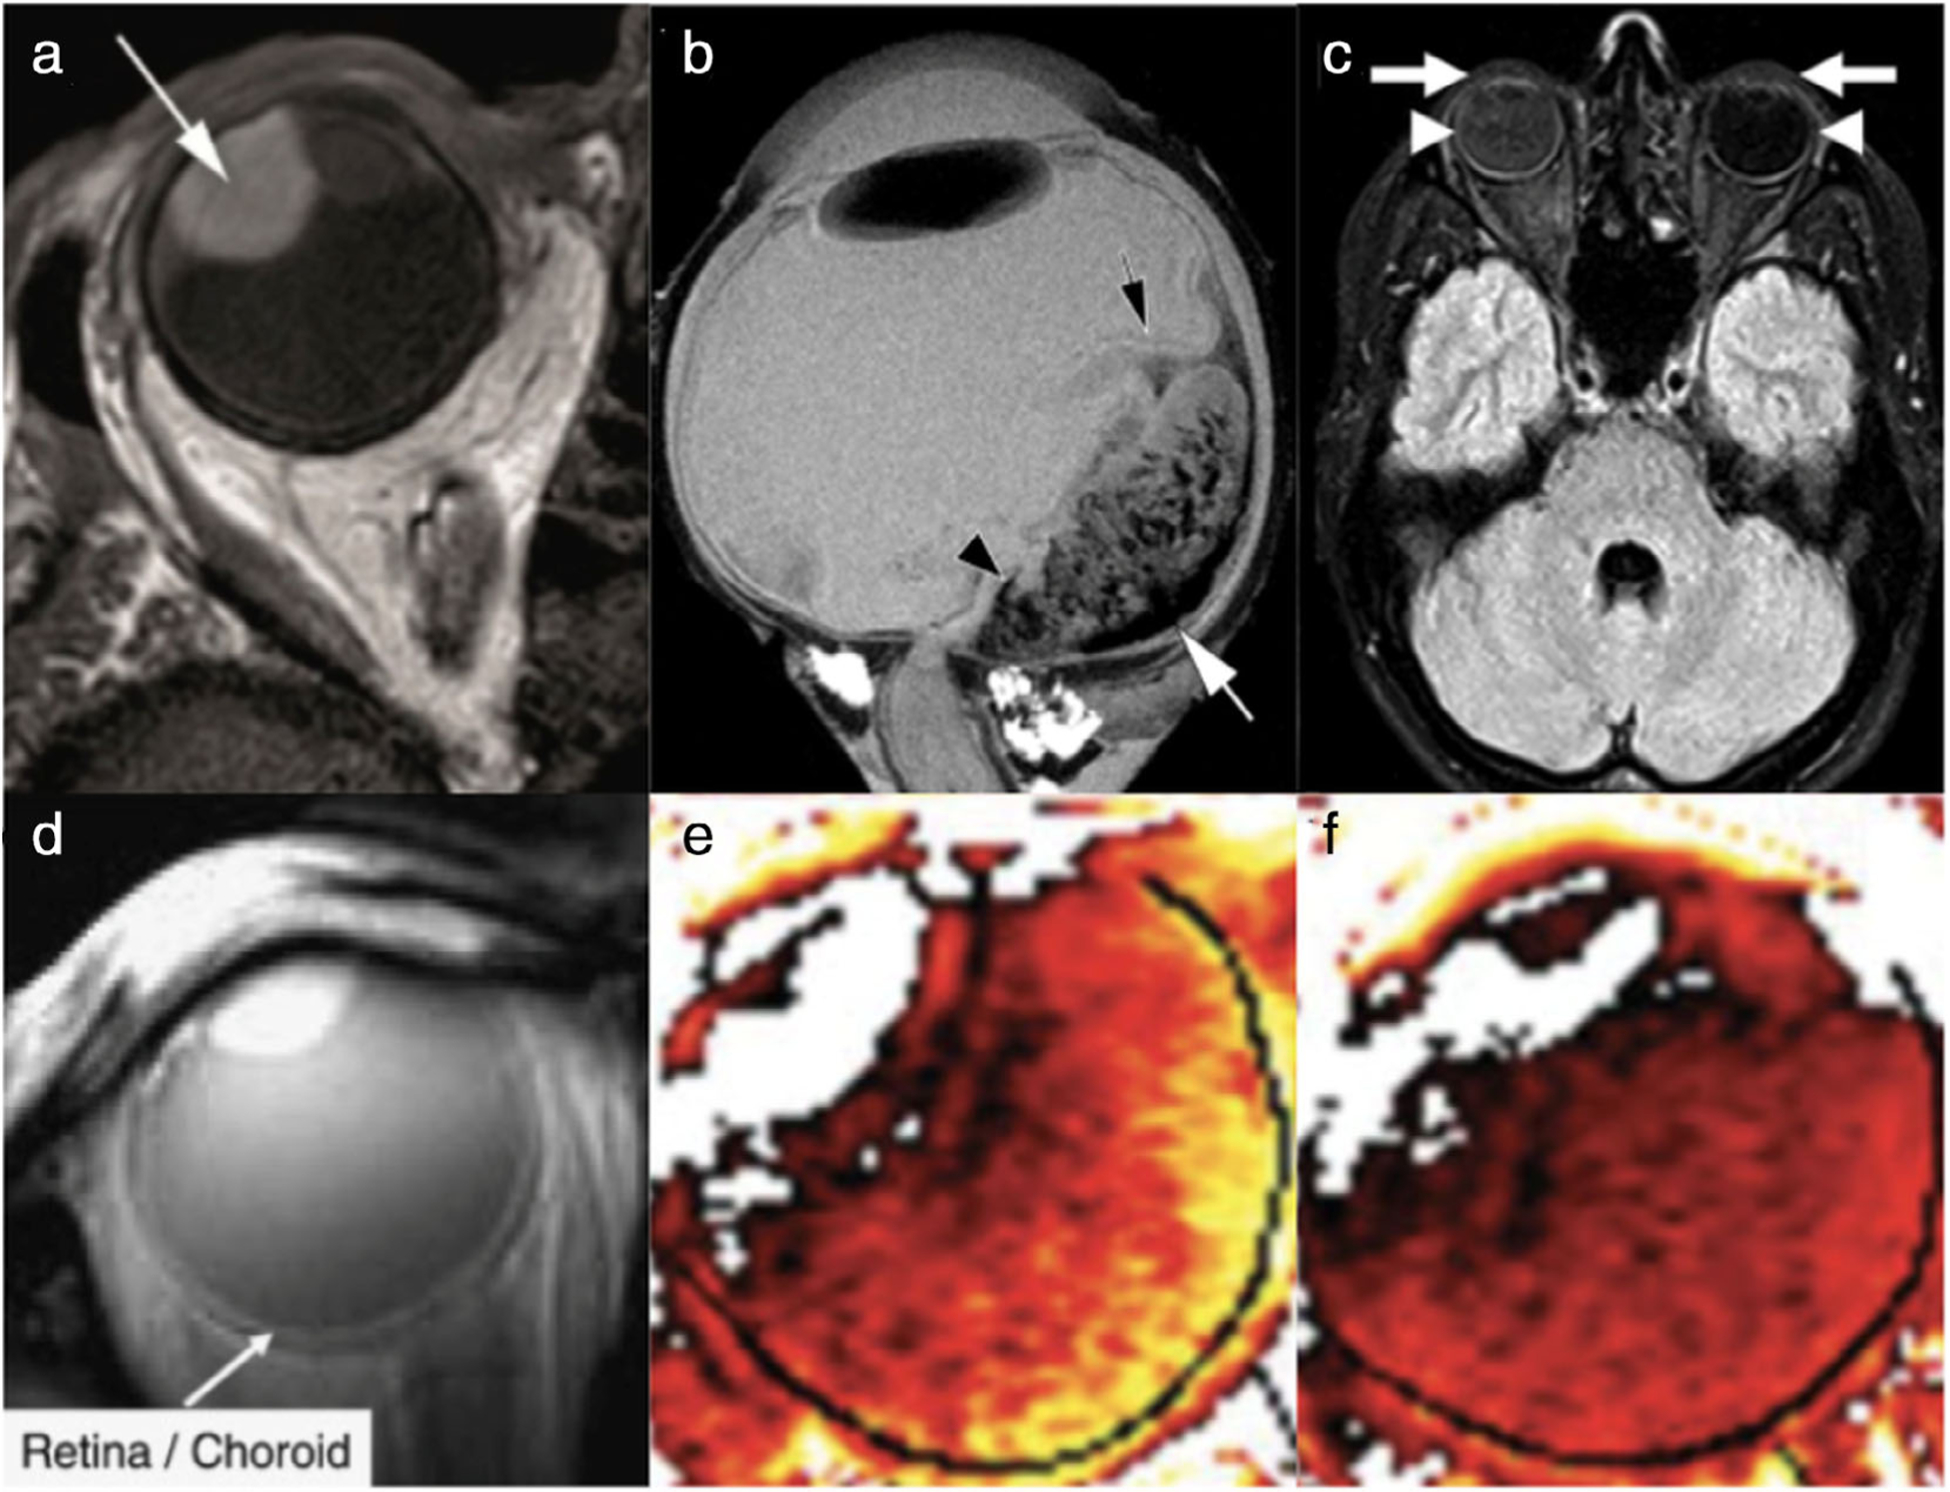
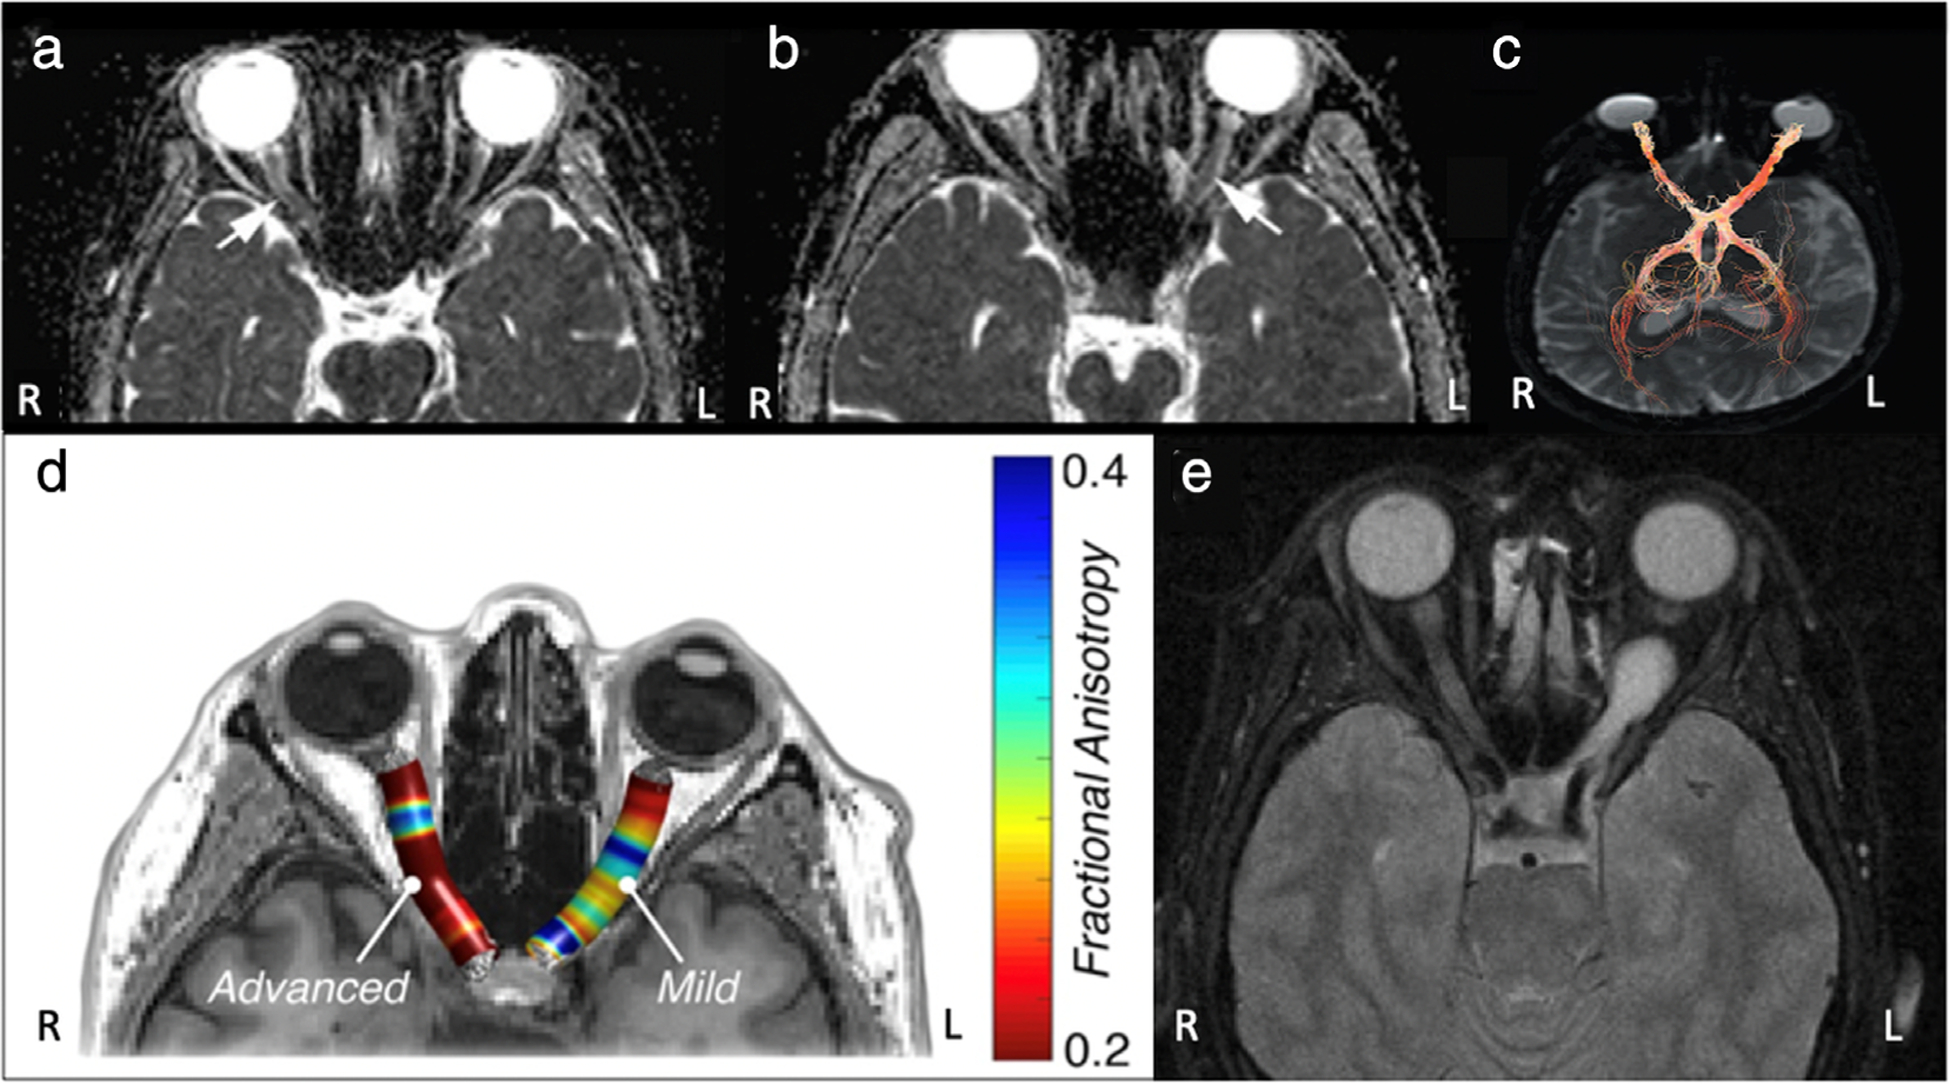
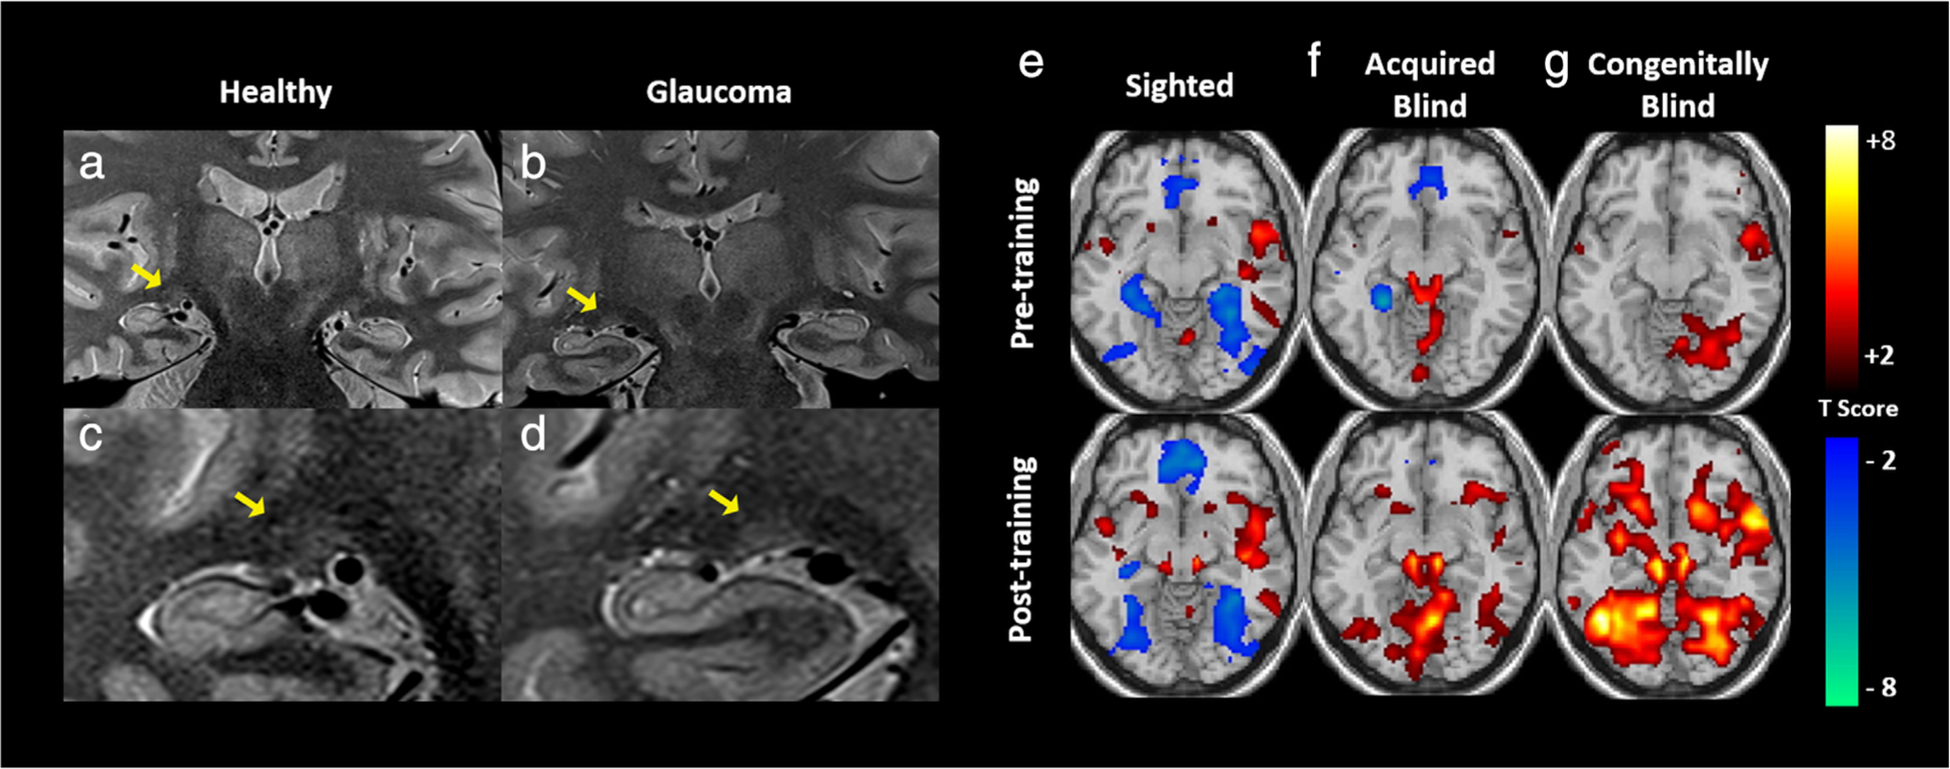
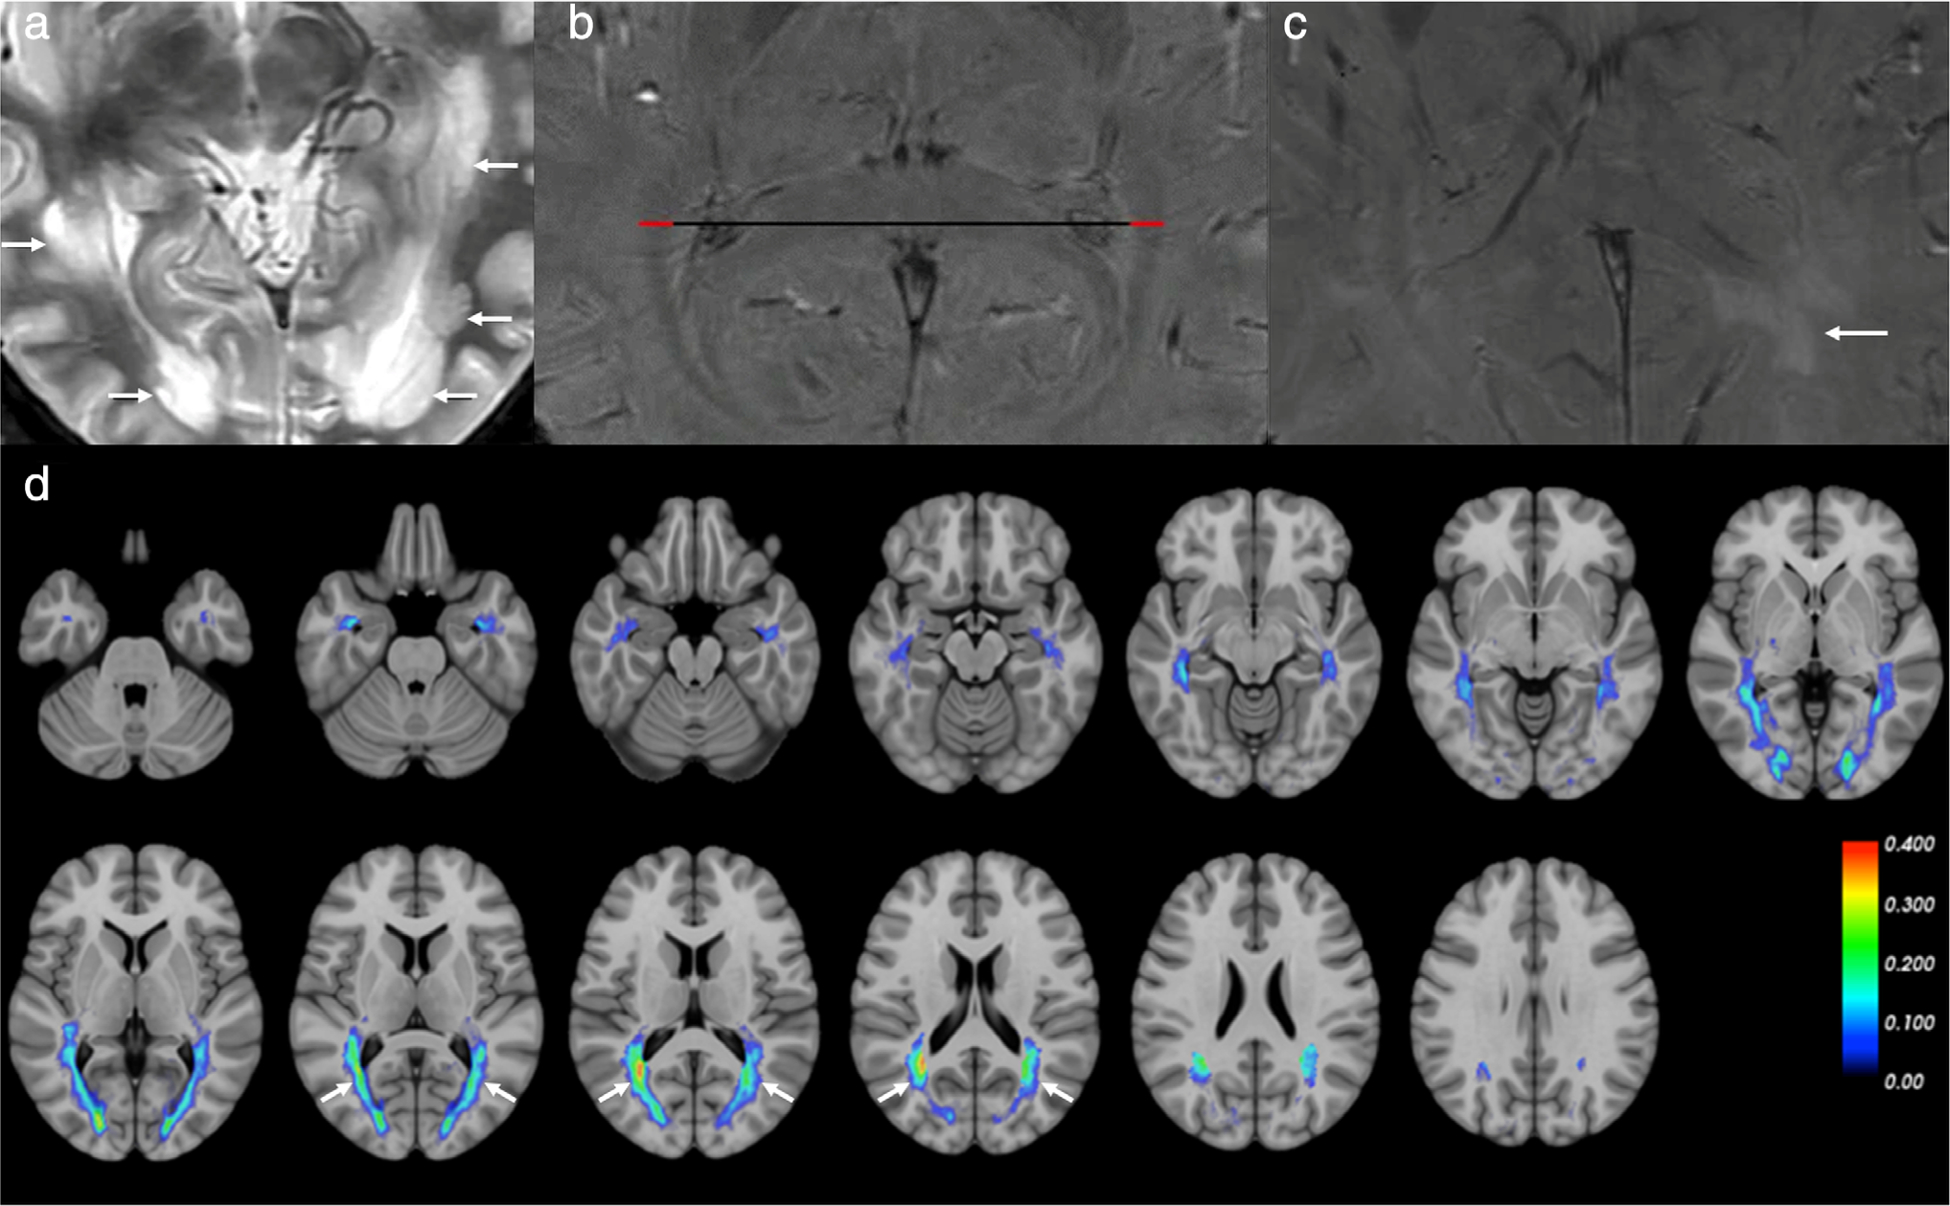
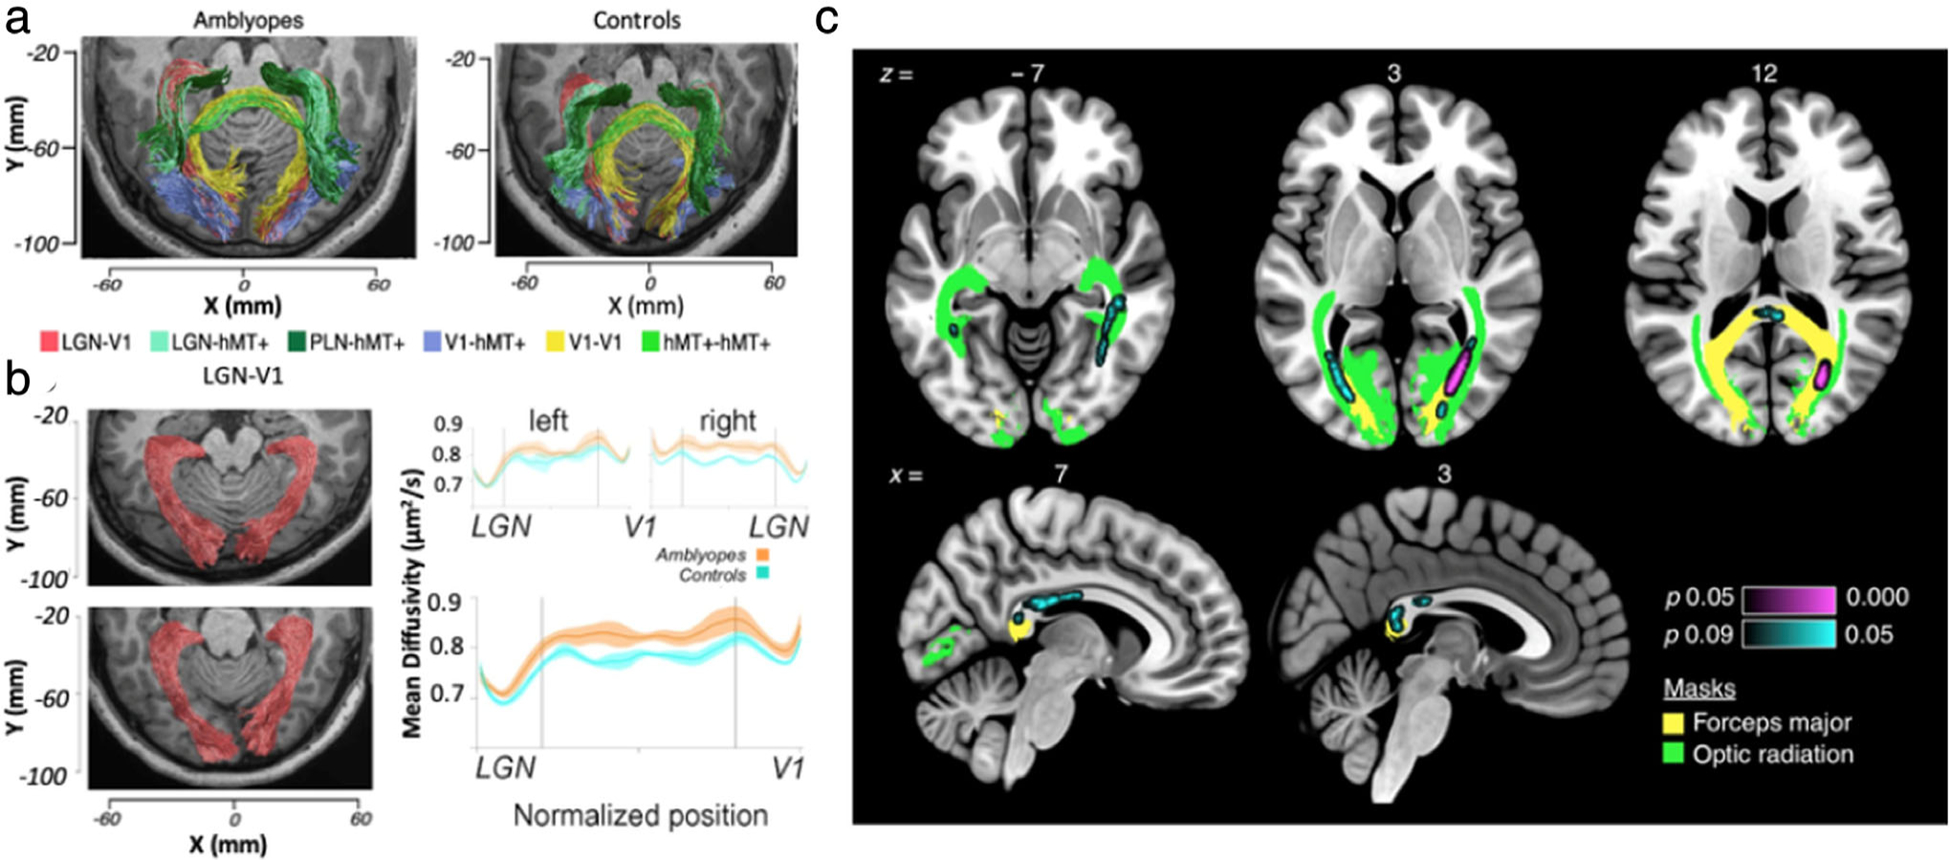
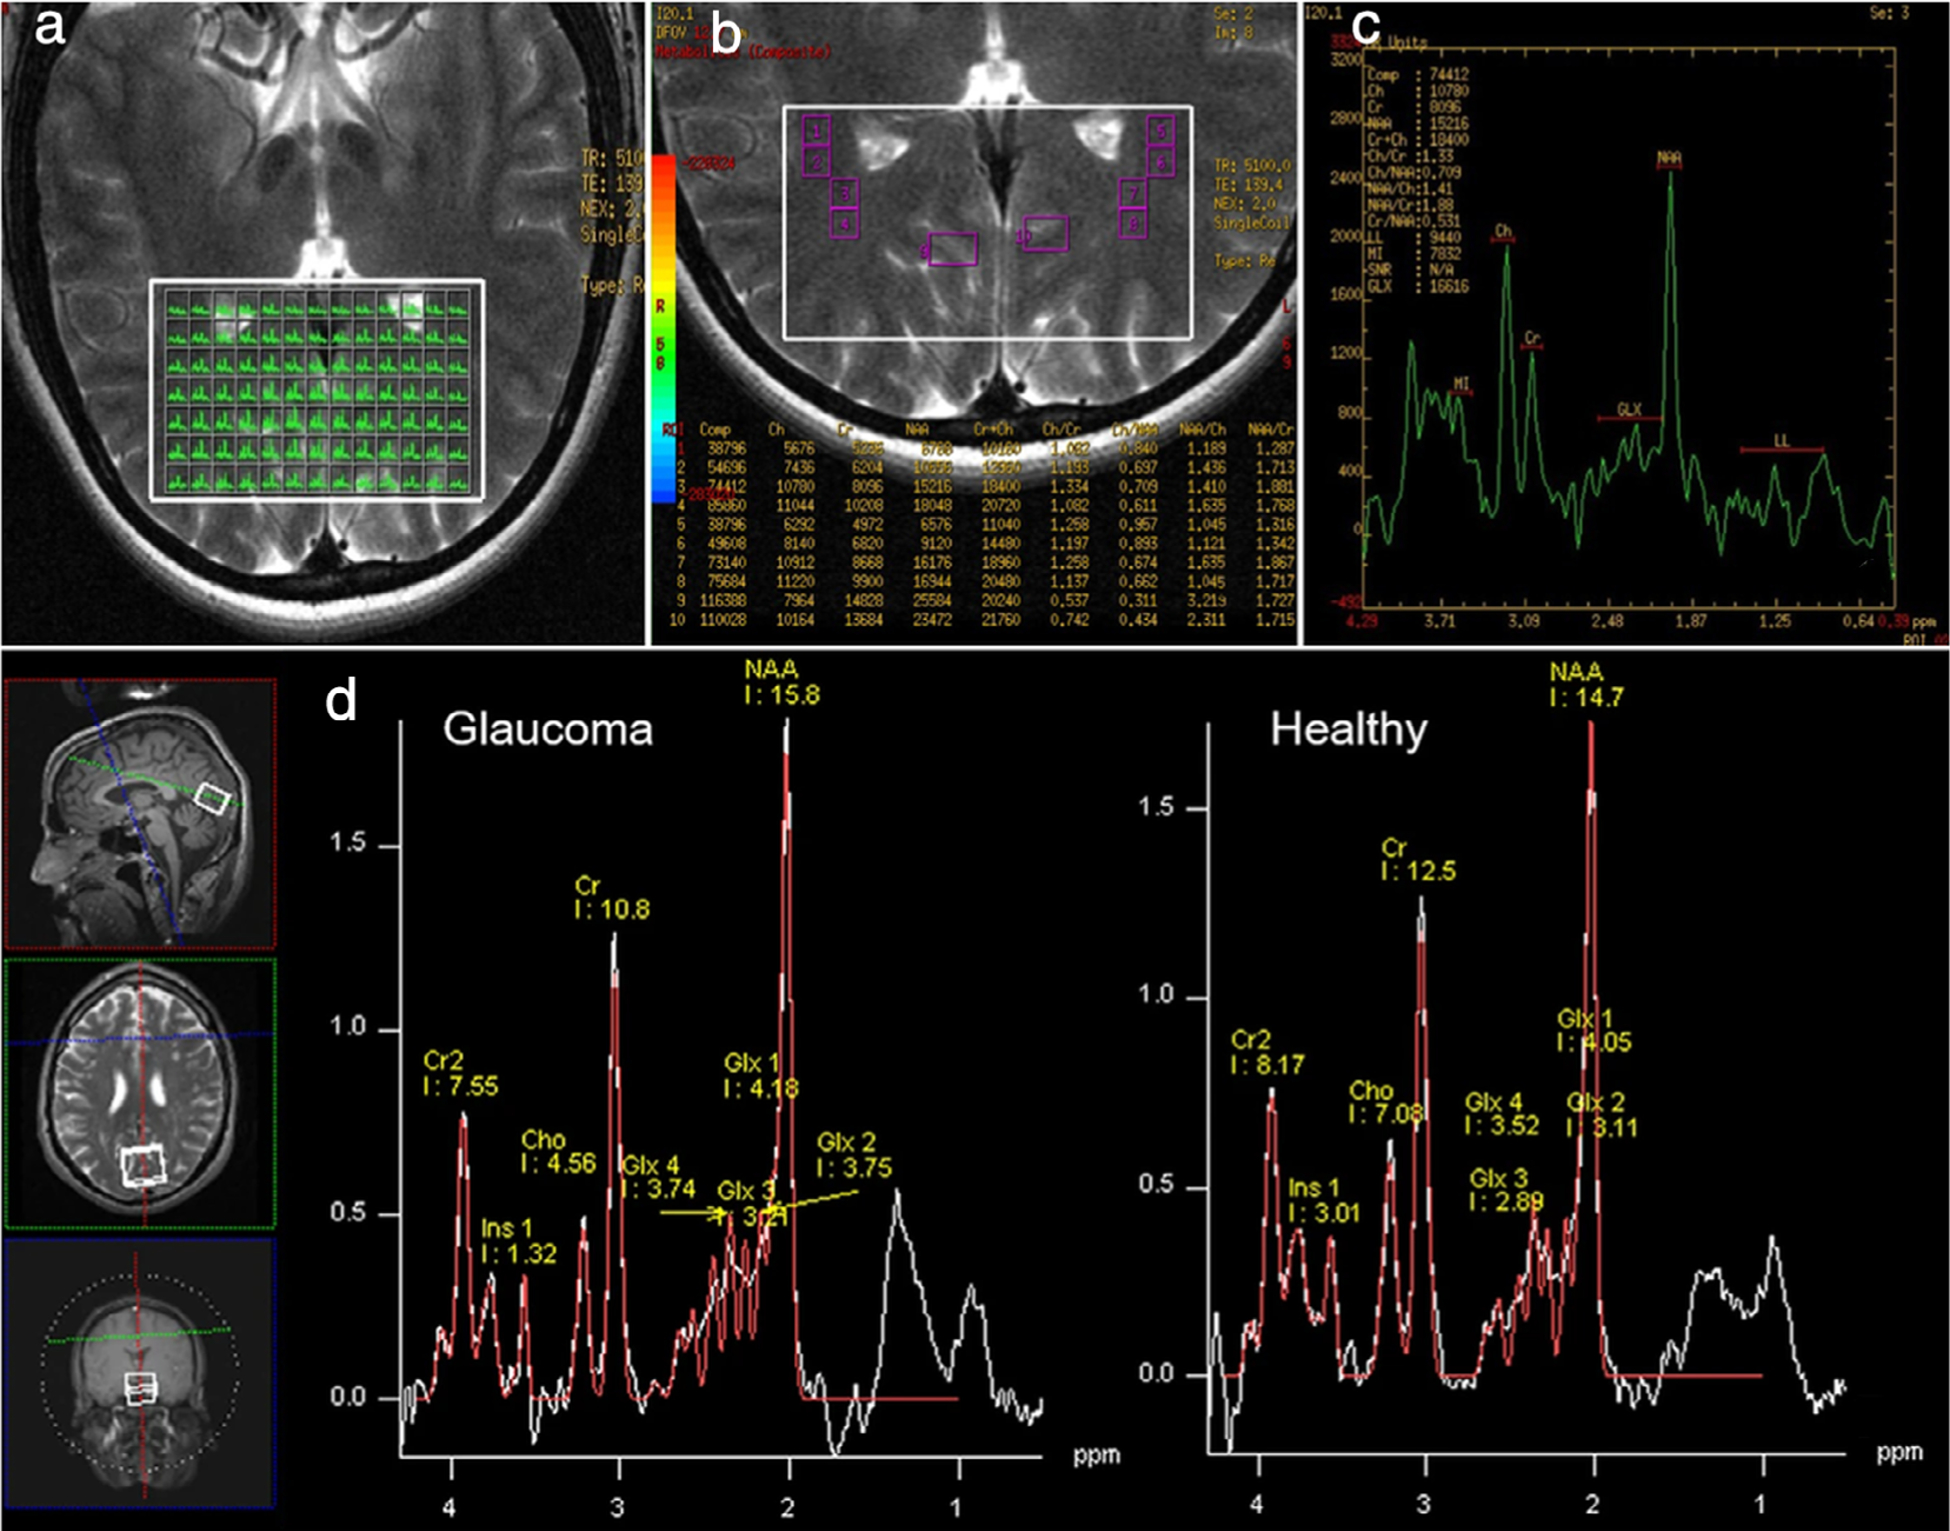
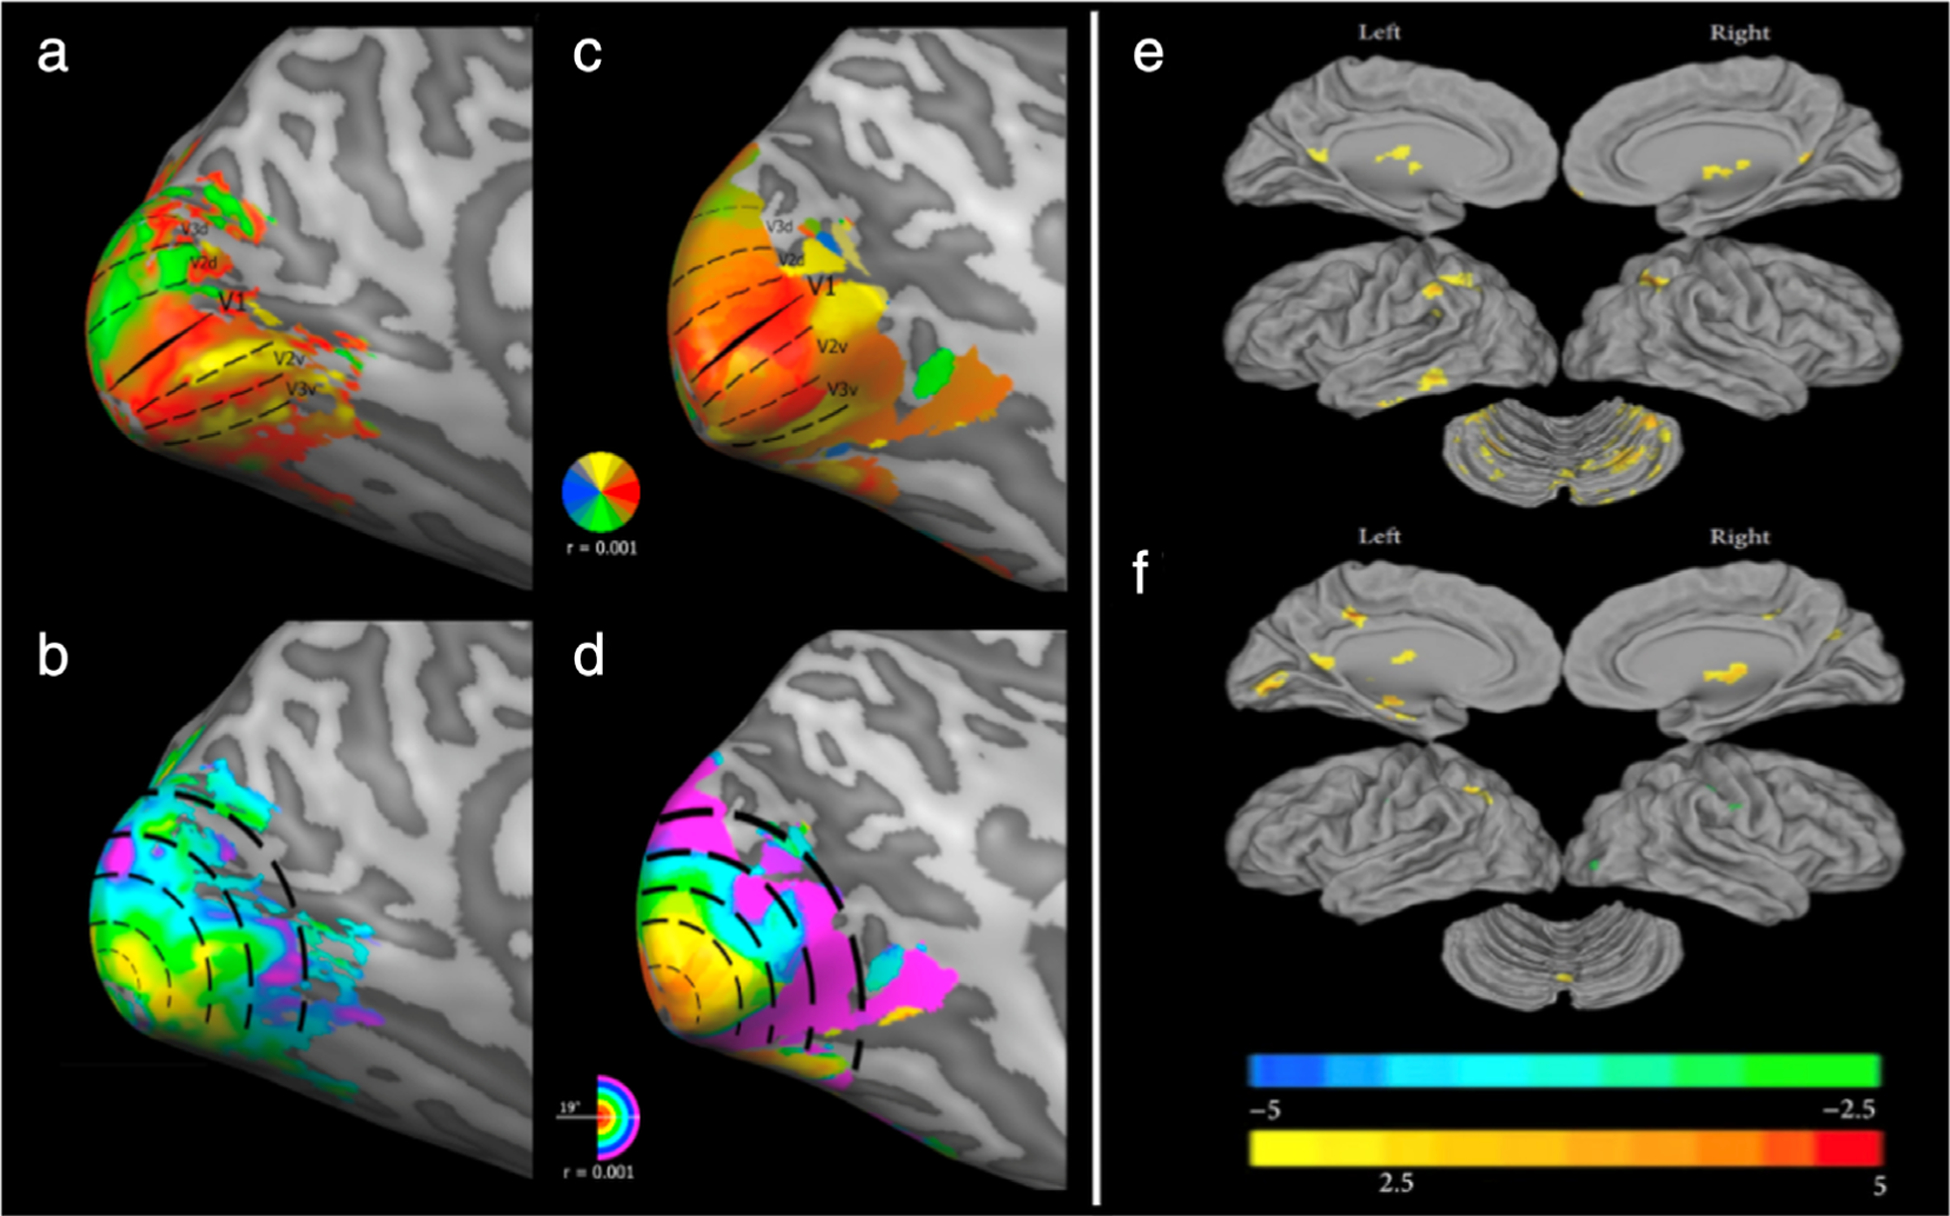
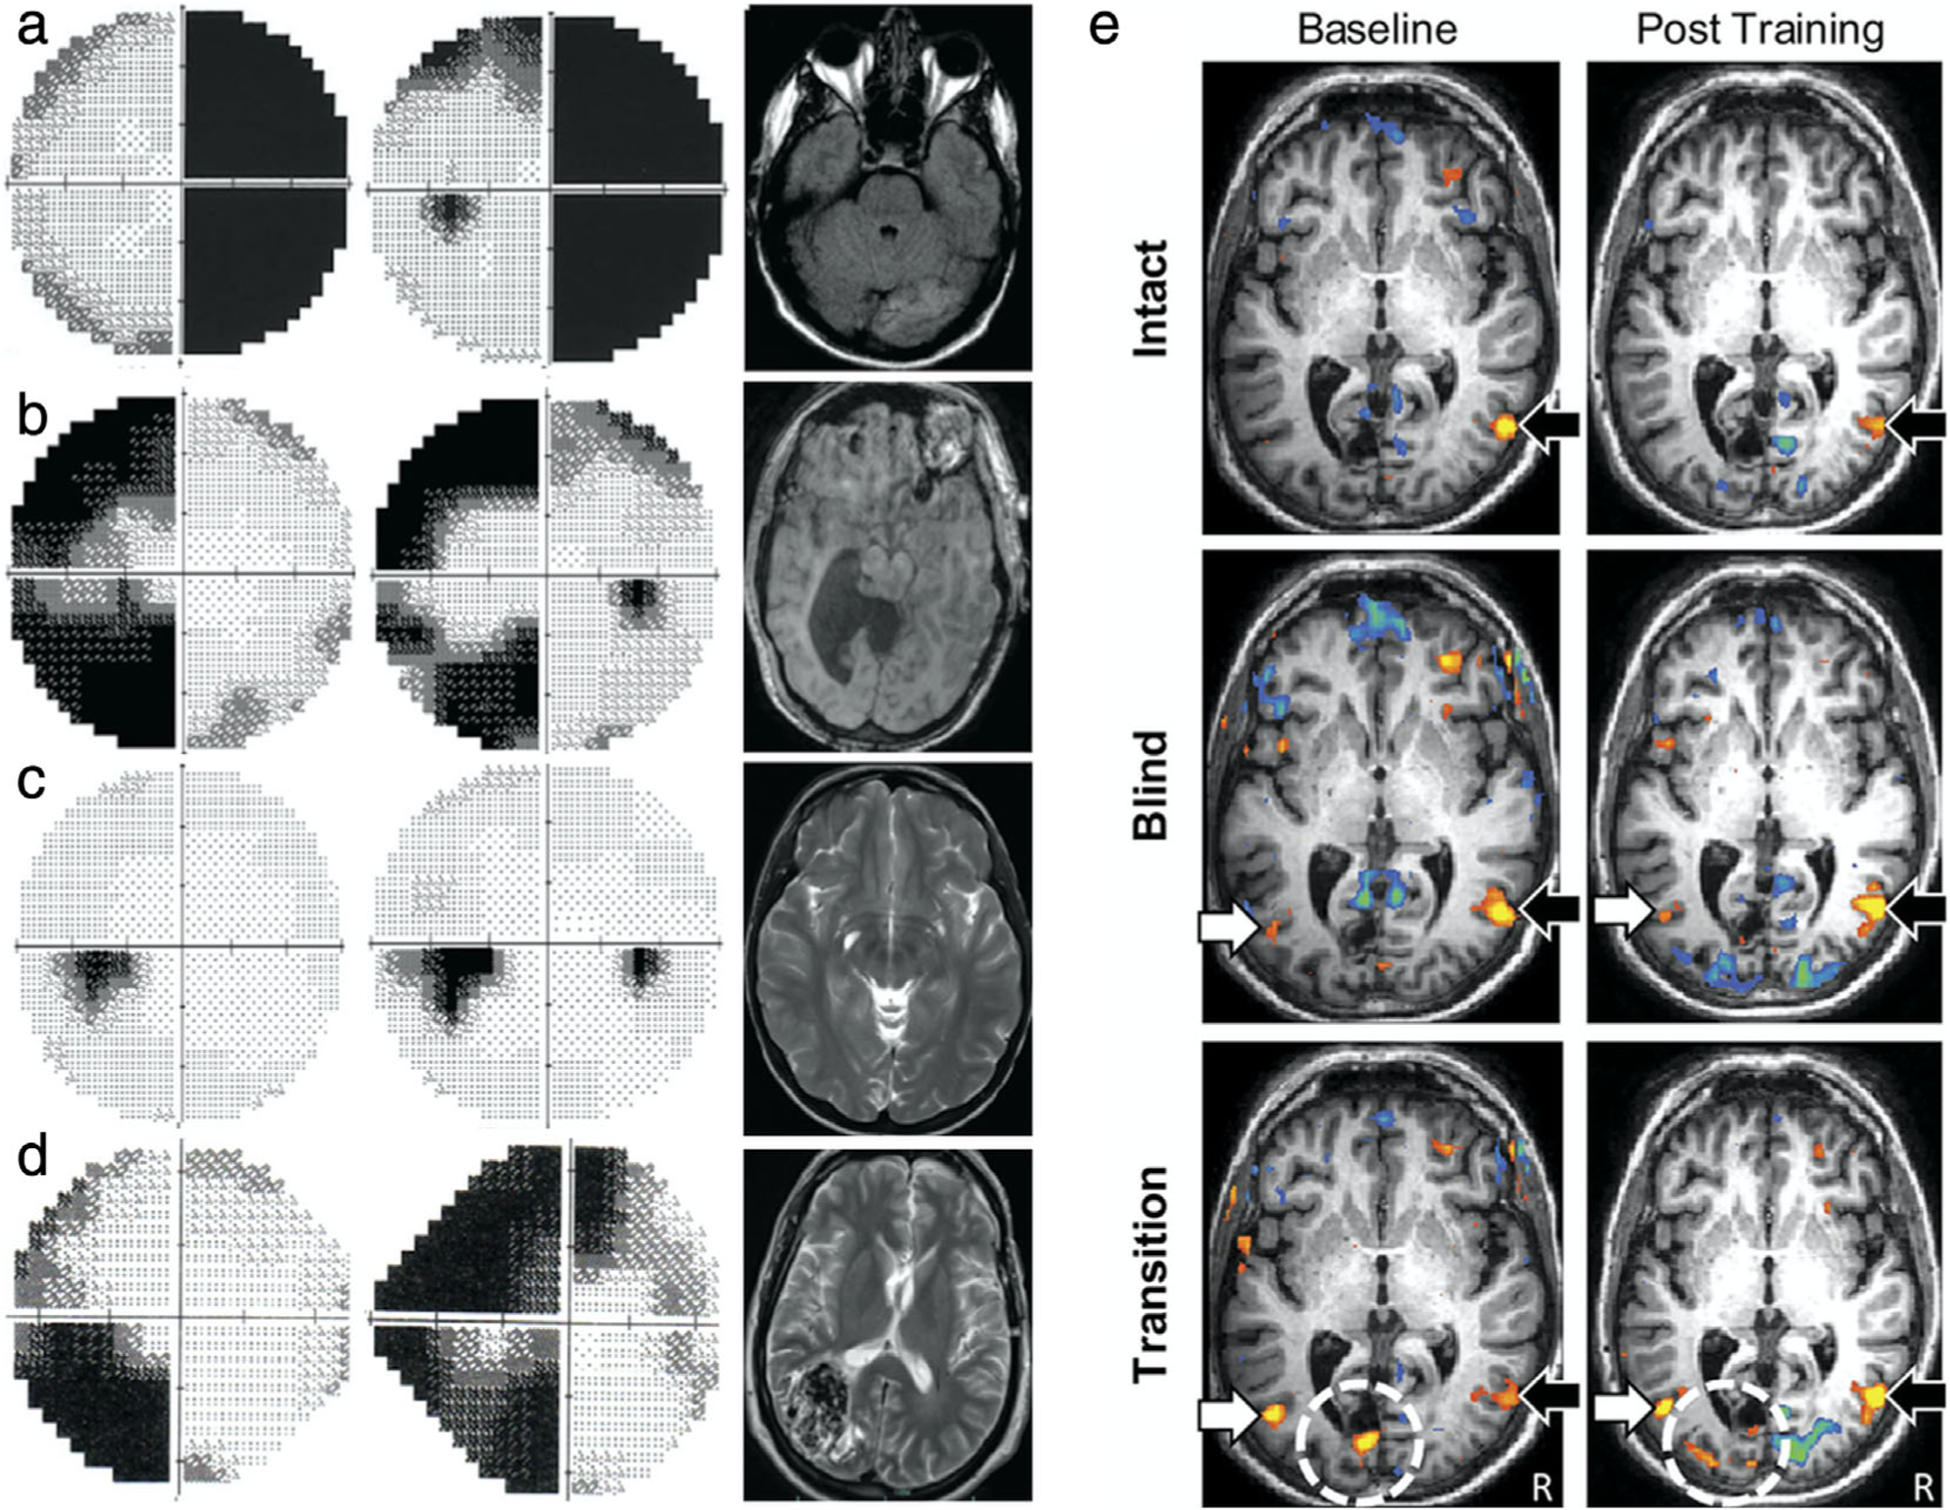
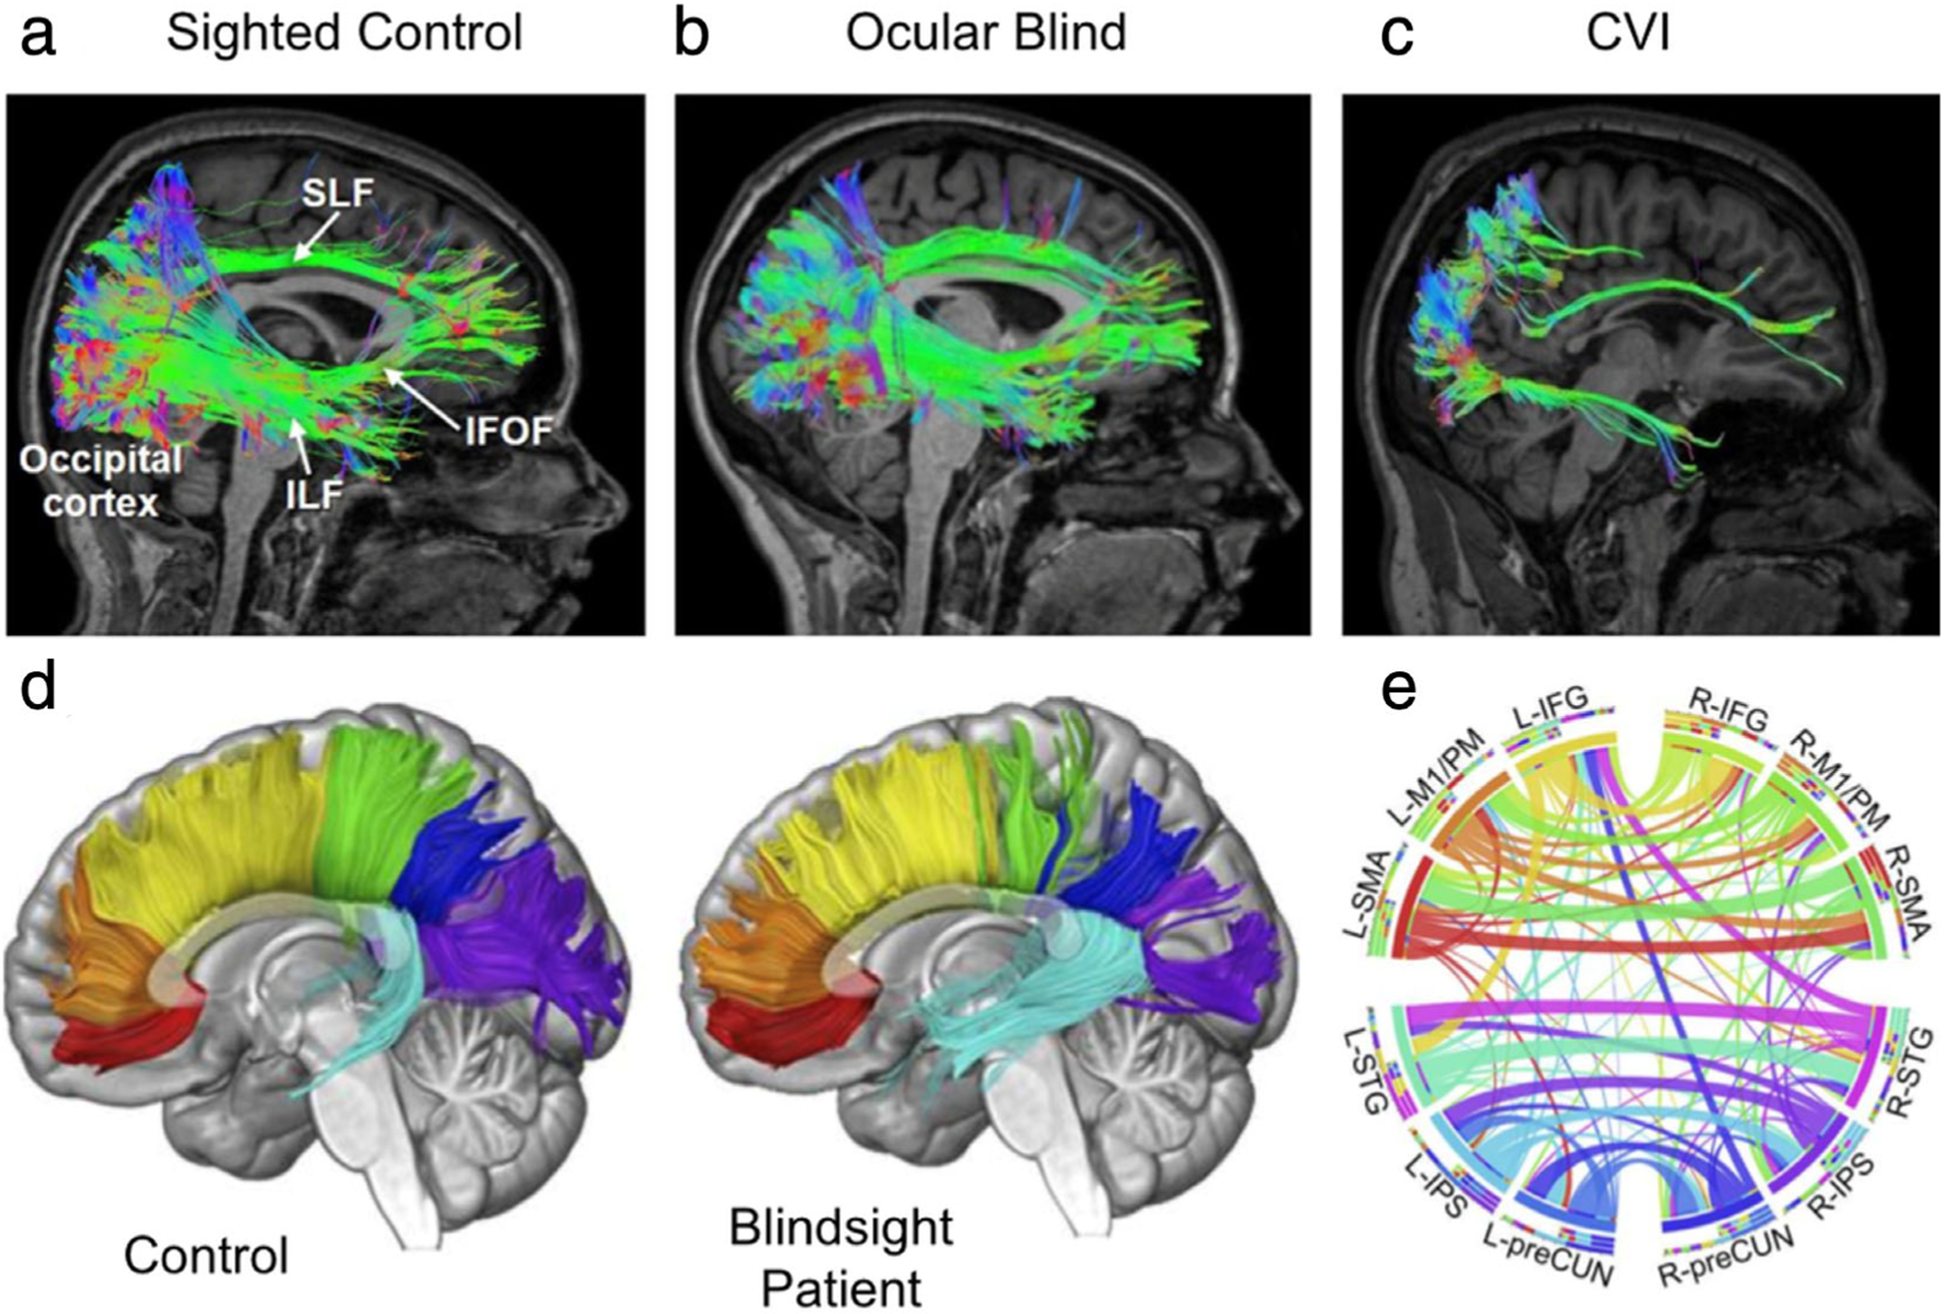
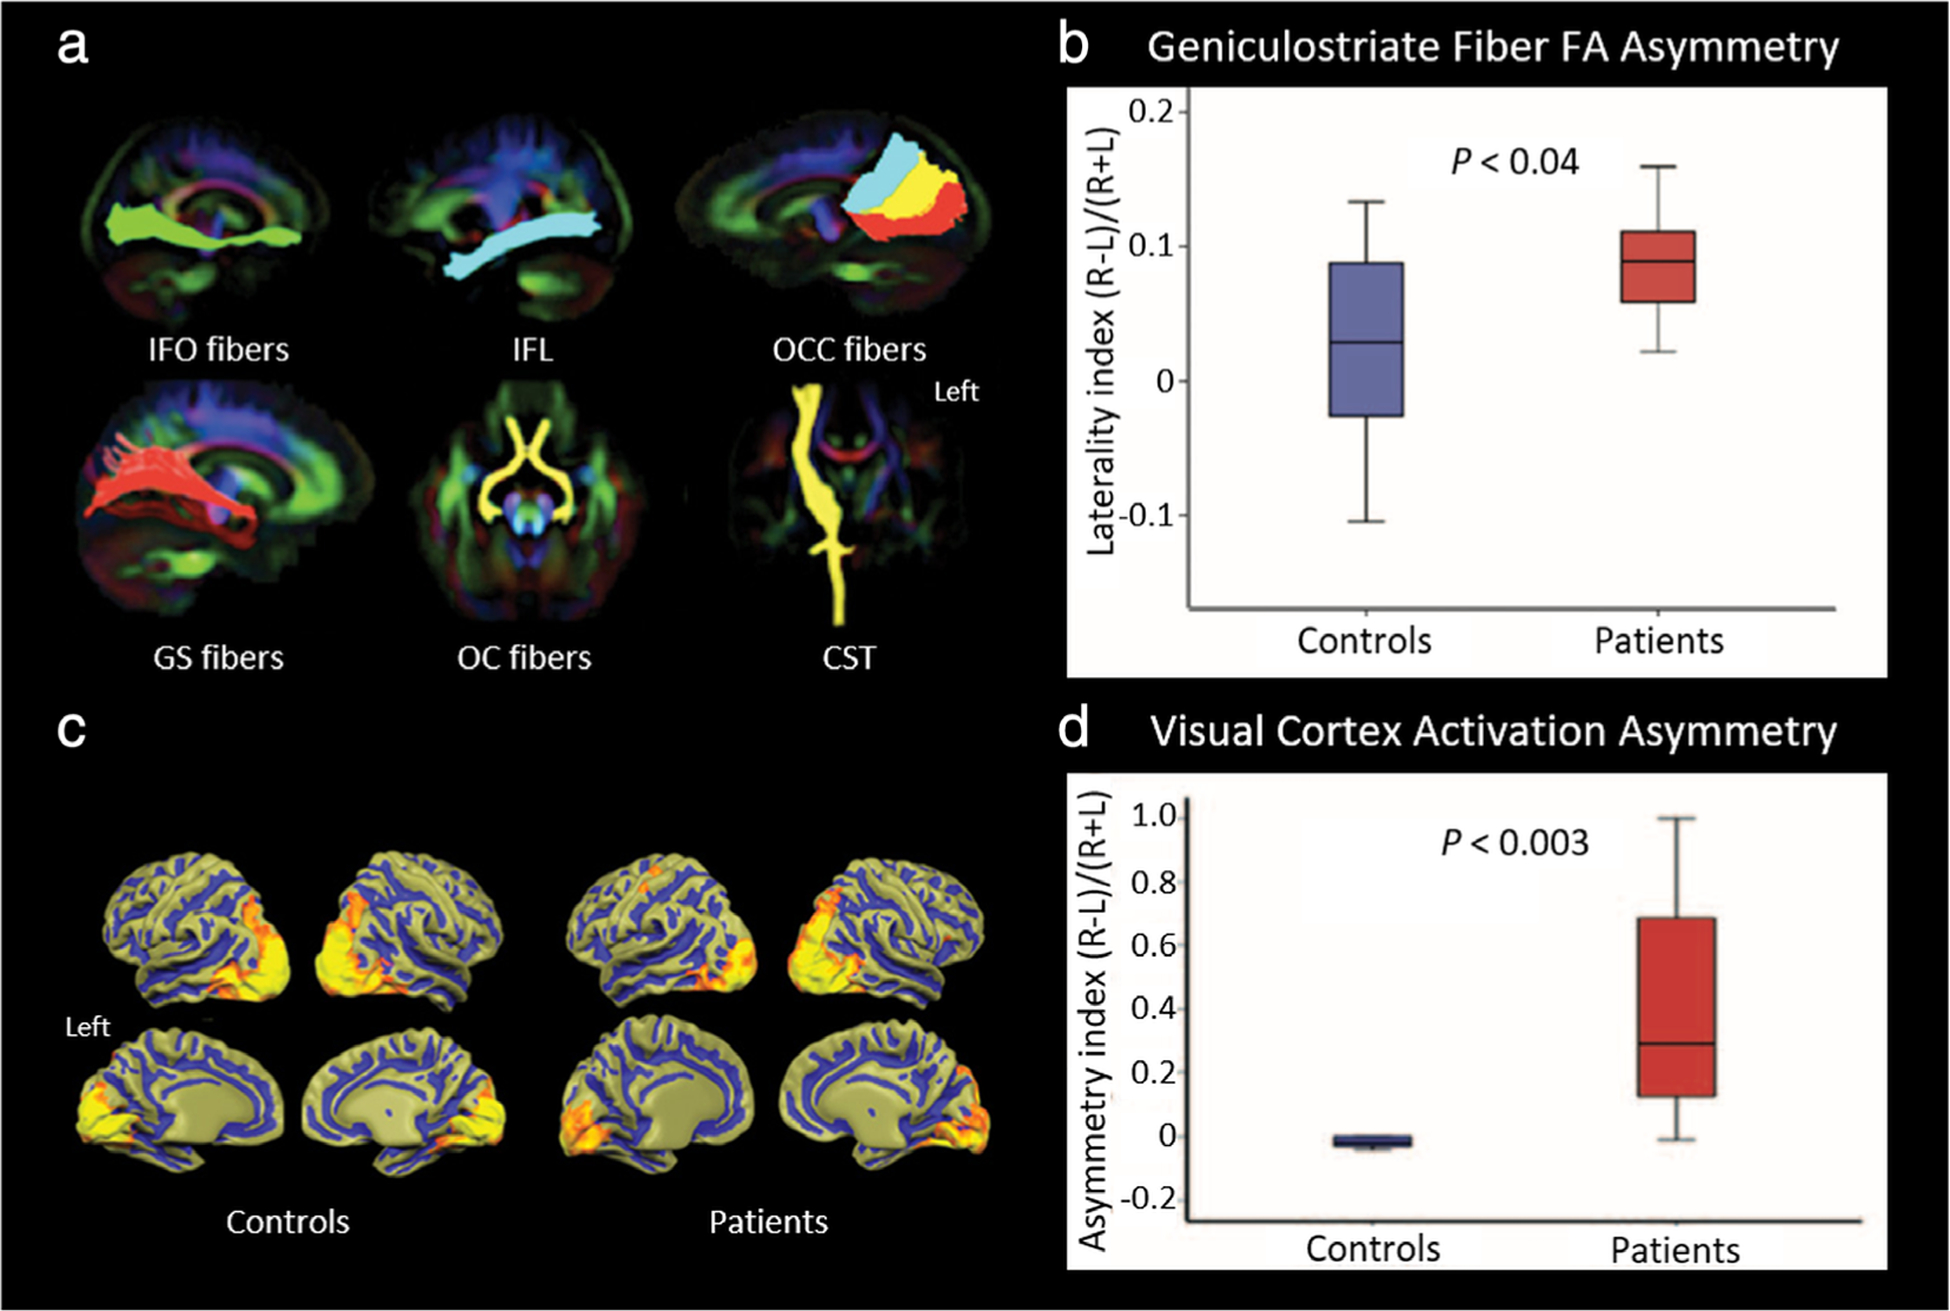
The visual system, consisting of the eyes and the visual pathways of the brain, receives and interprets light from the environment so that we can perceive the world around us. A wide variety of disorders can affect human vision, ranging from ocular to neurologic to systemic in nature. While other noninvasive imaging techniques such as optical coherence tomography and ultrasound can image particular sections of the visual system, magnetic resonance imaging (MRI) offers high resolution without depth limitations. MRI also gives superior soft-tissue contrast throughout the entire pathway compared to computed tomography. By leveraging different imaging sequences, MRI is uniquely capable of unveiling the intricate processes of ocular anatomy, tissue physiology, and neurological function in the human visual system from the microscopic to macroscopic levels. In this review we discuss how structural, metabolic, and functional MRI can be used in the clinical assessment of normal and pathologic states in the anatomic structures of the visual system, including the eyes, optic nerves, optic chiasm, optic tracts, visual brain nuclei, optic radiations, and visual cortical areas. We detail a selection of recent clinical applications of MRI at each position along the visual pathways, including the evaluation of pathology, plasticity, and the potential for restoration, as well as its limitations and key areas of ongoing exploration. Our discussion of the current and future developments in MR ocular and neuroimaging highlights its potential impact on our ability to understand visual function in new detail and to improve our protection and treatment of anatomic structures that are integral to this fundamental sensory system. LEVEL OF EVIDENCE 3: TECHNICAL EFFICACY STAGE 3: .

Keywords: diffusion MRI; functional MRI; magnetic resonance spectroscopy; visual impairments; visual neuroplasticity; visual restoration.


Figures

FIGURE 1:
FIGURE 1:
Visual system anatomy. (a,b) Schematic representation of the entire visual pathway in axial view (a) and the optic radiations in sagittal view (b), extending from the lateral geniculate nucleus (LGN) to the cortex. (c,d) Diffusion tensor imaging (DTI) reconstructions of the visual pathway in successive axial planes (c) and in the sagittal plane (d), with emphasis on the spatial relationship of the three bundles of the optic radiations. Adapted with permission from Ref. .
FIGURE 2:
FIGURE 2:
Structural imaging of normal ocular anatomy and orbital pathology. (a–c) High-resolution structural MRI of the eye and orbit using a microcoil array. A three-channel receive eye microcoil array was developed and integrated alongside a transmit quadrature head coil (a) for in vivo 7T imaging. Using an intermittent blinking paradigm with a 3D inversion recovery turbo gradient echo imaging technique, sagittal (b) and transverse (c) images of the eye and nearby tissue were acquired in a healthy volunteer. AC = anterior chamber; C = cornea; CB = ciliary body; I = iris; IR = inferior rectus; L = lens; ON = optic nerve; R = retina and sclera; SR = superior rectus; VB = vitreous body. (d) Inflammatory myositis of the right superior oblique muscle, as visualized here on axial apparent diffusion coefficient (ADC) via diffusion-weighted MRI using an echo planar imaging sequence. No diffusion restriction is observed along the superior oblique muscle (arrowhead), and additional enhanced T1-weighted images with fat signal suppression (not depicted) demonstrated enlargement and contrast enhancement of the muscle with surrounding cellulitis, all of which favor inflammation over infection or malignancy. Patient improved after corticosteroids and avoided biopsy. (e,f) Longitudinal imaging of a patient with thyroid eye disease, using frontal short tau inversion-recovery (STIR) images with 4-mm slice thickness. Initial MRI workup (e) occurred 12 months after disease onset in the left eye. Normal signal intensity was observed in all right eye extraocular muscles (not depicted) and the left superior rectus and superior oblique muscles, indicating lack of acute inflammation. The left medial and inferior rectus muscles displayed increased signal intensity as well as enlargement, indicating active inflammation (ball-arrowheads). The lateral rectus muscle, despite appearing normal in size on T1-weighted spin echo imaging (not depicted), was also found to have increased signal representing active disease (triple ball-arrowheads). At 7-year follow-up (f), the signal was unchanged in the left superior rectus and superior oblique muscles, and increased signal intensity of the lateral rectus muscle remained, likely indicating active inflammation in chronic thyroid eye disease (ball-arrowhead). Signal intensity of the left medial and inferior rectus muscle normalized (arrows), with decreased size noted on T1-weighted spin-echo imaging, suggesting decreased disease activity in these muscles. Adapted with permissions from Refs. , , .
FIGURE 3:
FIGURE 3:
Intraocular tumors and blood–ocular barrier physiology. (a) Uveal melanoma (arrow) in the right eye of a patient, shown here on axial multislice 2-mm T1-weighted imaging at 3T. (b) Exophytic retinoblastoma imaged ex vivo using T2-weighted rapid acquisition with relaxation enhancement (RARE) sequence at 9.4T following enucleation of the eye. The black arrow denotes a partial retinal detachment, which was a consequence of this tumor. The white arrow indicates potential hemosiderin deposition, and the black arrowhead marks a hypointense area found to correspond to hemorrhage via further histopathology. (c) Gadolinium leakage into ocular structures (GLOS) in a patient with right optic neuritis, on axial fluid-attenuated inversion recovery (FLAIR) sequence 1.5T MRI; the patient’s right side is on the left side of this image. In this patient, GLOS was bilateral but asymmetric, observed more prominently ipsilateral to the unilateral optic neuritis. GLOS can be seen in the anterior chamber (arrows) and vitreous body (arrowheads). (d–f) MRI evaluation of blood–retinal barrier damage (d) and retinal oxygenation response (ROR) (e,f). Dynamic contrast-enhanced MRI (DCE-MRI) had an in-plane resolution of 390 μm2 (12-mm slice thickness), as seen on this coronal image (d) illustrating the retina/choroid complex (ie, white line along the posterior aspect of the eye). The ROR in the preretinal vitreous was studied by taking advantage of the paramagnetic oxygen contrast in direct proportion to the change in oxygen concentration in the preretinal vitreous. Type I diabetic patients and similar-age normal volunteers initially inhaled room air and then were switched to 100% O2 for 40 minutes. MRI of the partial oxygen pressure (ΔPO2) at 40 minutes demonstrates increased signal intensity in the preretinal vitreous of a diabetic patient with no retinopathy (e) compared to a control volunteer (f) of the same age. Lighter color (yellow) corresponds to a higher ΔPO2 (up to 250 mm Hg), and darker color (red) corresponds to a lower value. Adapted with permissions from Refs. , , , .
FIGURE 4:
FIGURE 4:
MRI of the optic nerve. (a,b) Apparent diffusion coefficient (ADC) maps of a patient with multiple sclerosis-optic neuritis of the right optic nerve (a) and a patient with AQP4-IgG positive neuromyelitis optica-optic neuritis of the left optic nerve (b). Mean group ADC in the study was significantly lower in neuromyelitis optica-optic neuritis than in multiple sclerosis-optic neuritis. (c) Visual pathway fiber bundle tracking showing significantly lower nerve fiber bundle density in the optic nerve affected by indirect traumatic optic neuropathy (right) than in the normal nerve (left). (d) Fractional anisotropy (FA) map demonstrating significantly lower FA values in an optic nerve affected by advanced glaucoma (right) compared to the optic nerve with mild glaucoma (left). (e) Preoperative T1-weighted MRI showing a left optic glioma. Adapted with permissions from Refs. , , , .
FIGURE 5:
FIGURE 5:
Structural and functional MRI of the visual brain nuclei. (a–d) Structural MRI indicating atrophy of the lateral geniculate nucleus (LGN) in a glaucoma patient (b,d) in comparison with a healthy subject (a,c). (e–g) Functional MRI demonstrating activation maps before (top row) and after (bottom row) task training for interpretation of cross-modal visual information inputted via auditory stimulation in three study cohorts: sighted (e), acquired blind (f), and congenitally blind (g) individuals. As compared to sighted individuals, those with acquired or congenital blindness demonstrated increased activity in the subcortical nuclei, suggesting cross-modal sensory input is processed at this level in a distinct manner in this population. Adapted with permissions from Refs. , .
FIGURE 6:
FIGURE 6:
MRI of the optic radiation in multiple sclerosis. (a) Conventional T2-weighted imaging showed hyperintense signals of lesions in the optic radiation (arrows) in a multiple sclerosis patient. (b,c) Magnitude images of enhanced T2*-weighted angiography imaging (ESWAN) showed symmetrical and hypointense signals within the optic radiation bilaterally in a healthy subject (b), while in a multiple sclerosis patient (c), the left optic radiation had more lesions (arrow). Red lines indicate the thickness of the optic radiations. (d) Optic radiation segmentation using the diffusion-based tractography approach showed that lesions were more frequent in the middle part of the optic radiation (arrows) adjacent to the lateral ventricle, compared with the anterior and posterior parts of the optic radiation. Adapted with permissions from Refs. , .
FIGURE 7:
FIGURE 7:
Diffusion tensor imaging of the optic radiation in ophthalmic diseases. (a,b) Diffusion tensor imaging in amblyopia. Visual white matter pathways estimated by probabilistic tractography (a) in representative amblyopia (left) and control (right) participants. Pathways are color-coded. LGN-V1 (ie, the optic radiation) is red. LGN = lateral geniculate nucleus; V1 = primary visual cortex; V5/hMT + = human middle temporal visual cortex; PLN = pulvinar nucleus. (b) Visualized optic radiation pathway anatomy estimates in representative control (top left) and amblyopic (bottom left) participants, showing significantly increased mean diffusivity in amblyopes compared to controls (right). (c) Tract-based spatial statistics (TBSS) analysis revealed differences in fractional anisotropy (FA) in the white matter of glaucoma patients and controls. A significant difference in FA was found in a 380-voxel white matter region in three axial slices and two sagittal slices, using threshold-free cluster enhancement correction for multiple comparisons. Violet (P < 0.05) and cyan (P < 0.09) labeling show areas of decreased FA in glaucoma patients compared to controls. Green color labels the optic radiation, and yellow color labels the forceps major. Adapted with permissions from Refs. , .
FIGURE 8:
FIGURE 8:
Metabolic imaging of the optic radiation and visual cortex in glaucoma. (a–c) Multivoxel proton MRS. (a) displays all fixed-voxels in the volume of interest (VOI) (white box). The size of each voxel was 31.6 mm2. (b) The amplification of (a). Several voxels were selected as regions of interest (ROIs) in the geniculocalcarine tracts (GCTs) and the striate area. ROI 1 through ROI 8 were distributed symmetrically on the GCTs. ROI 9 and ROI 10 were located in the striate area, each containing six voxels. (c) The spectrum of ROI 2 in the right GCT, with N-acetyl-aspartate (NAA) and choline (Cho) peaks. (d) Single-voxel proton MRS, where each proton MR spectrum was acquired using a 20 × 25 × 30 mm3 voxel centered at the calcarine sulcus bilaterally, as shown in the anatomical images in three orthogonal planes (white boxes in left insets). Voxels covered both upper and lower visual field representations in each hemisphere. Here, we see sample proton MR spectrum (white curve) and fitted spectrum (red curve) of metabolic profiles in the primary visual cortex of a glaucoma patient (left) and a healthy subject (right). The levels of Cho, NAA, glutamate–glutamine complex (Glx), and creatine (Cr) brain metabolite contents were estimated from the spectrum. For quantitative comparisons, they were normalized to the Cr level. Adapted with permissions from Refs. , .
FIGURE 9:
FIGURE 9:
Retinotopic mapping and cortical functional connectivity. (a–d) Retinotopic mapping. Retinotopic maps of a representative healthy control (a,b) vs. a patient with blindsight following a right functional hemispherectomy (c,d). Polar angle maps (a,c) show delineated visual areas V1, V2d, V3d, V2v, V3v in the left hemisphere. The dorsal visual areas above the calcarine sulcus and ending in “d” correspond to the contralateral (right) lower visual field quadrant, and the ventral visual areas ending in “v” correspond to the right upper visual field quadrant. Aside from the less clearly defined dorsal components (ie, blurred border between V2d and V3d), the retinotopic organization of the patient’s intact left visual areas did not differ substantially from those of healthy controls. Eccentricity maps (b,d) expectedly show a smooth and continuous phase progression of foveal representation in the occipital pole and peripheral representation in increasingly anterior locations. Compared to healthy controls, the patient with blindsight had a marked increase in population receptive field (pRF) sizes at 4–6° of eccentricity, with a size difference that reached ~300% between 8° and 10° (not depicted). Receptive field sizes at foveal and parafoveal eccentricities (≤4°) were not measurably altered. (e,f) Functional connectivity in amblyopia. Using resting-state fMRI, the anatomical distribution of functional connectivity alterations in mixed amblyopic (ie, anisometropic and strabismic) subjects is shown in comparison with normal sighted controls. Functional connectivity with the left primary visual cortex (V1; e) and right V1 (f), is individually visualized (P < 0.01, 130 voxels, AlphaSim corrected palpha = 0.01). Adapted with permissions from Refs. , .
FIGURE 10:
FIGURE 10:
Clinical MRI correlates in hemianopia and functional imaging of plasticity. (a–d) Examples of homonymous hemianopia with corresponding neuroimaging. (a) Axial T1-weighted MRI with contrast in complete right homonymous hemianopia following a left occipital lobe stroke (right) affects the entire hemifield of both eyes (left). (b) Axial T1-weighted MRI of left incongruous homonymous hemianopia with macular sparing due to hydrocephalus and subsequent shunt. (c) Axial T2-weighted MRI of left congruous homonymous hemianopia due to right occipital lobe encephalomalacia. (d) Axial T2-weighted MRI of left incongruous homonymous hemianopia due to right parietal lobe arteriovenous malformation. (e) Visual motion perception–related activation as a function of stimulus location before and after task-fMRI training suggest some recovery of visual function. Analysis of a patient with right hemianopia after occipital lobe stroke. Random dot kinetograms were used as visual stimuli. Behavioral performance on a direction-discrimination task was assessed with stimuli presented in either the patient’s intact field (ie, stimuli were detected on all three administered high-resolution perimetry tests), blind field (ie, stimuli were never detected), or transition zone (ie, stimuli were detected on only one or two tests). For intact visual field stimuli (top), activation within the contralateral motion-processing area of V5/hMT + is observed and is comparable at baseline and after training (black arrow). For blind field stimuli (middle), there is bilateral activation of V5/hMT + in the contralateral (white arrow) and ipsilateral (black arrow) hemispheres at both baseline and after training. For transition zone stimuli (bottom), task performance at baseline is associated with bilateral V5/hMT + activation (arrows), as well as perilesional activation (dotted circle). Posttraining shows similar bilateral activation of V5/hMT +, but with a larger network of activation within the occipital pole including visual areas V2/V3. The threshold for significance was set at P < 0.05. Colors indicate percentage BOLD signal change. A blue to green gradient represents increasing negative change (−3.75% to −8.00%, respectively), and a red to yellow gradient represents increasing positive change (+ 3.75% to + 8.00%, respectively). Adapted with permissions from Refs. , .
FIGURE 11:
FIGURE 11:
Diffusion tensor imaging of structural connectivity in the cortex and corpus callosum. (a–c) White matter reconstructions (shown in sagittal view) of three main pathways involved in the processing of visual information: the superior longitudinal fasciculus (SLF; the neuroanatomical correlate of the dorsal visual processing stream), inferior longitudinal fasciculus (ILF; the ventral visual processing stream), and inferior fronto-occipital fasciculus (IFOF; mediating visual attention and orienting). Diffusion data was acquired using high angular resolution diffusion tensor imaging (HARDI) for improved delineation of crossing fibers. Pathway reconstructions are shown in a normal sighted control (a), an early ocular blind patient (b), and an individual with cortical/cerebral visual impairment (CVI) and associated periventricular leukomalacia, who has significant visual dysfunction caused by injury to visual pathways and structures during early perinatal development (c). All pathways can be reconstructed in both the control and early ocular blind individuals. In contrast, in the individual with CVI, the SLF and ILF are sparser, and the IFOF cannot be reconstructed. These differences in structural integrity may be related to the observed cognitive visual dysfunctions in CVI. (d,e) fMRI-guided tractography shows connectional, topographic, and microstructural properties of the corpus callosum (CC). Tractographic segmentation (d) of seven callosal fibers based on cortical projections in one representative control participant (left) and one patient who suffered right hemianopia with macular sparing at age 8, following selective destruction of his left striate cortex as a result of traumatic brain injury (right). This arrangement of subdivisions is clearly discernible in the midsagittal cross-section of the CC (as shown) and highly coherent across patient and age-matched controls. Fibers are color-coded: red, orbitofrontal; orange, anterior frontal; yellow, superior frontal; green, superior parietal; blue, posterior parietal; purple, occipital; and cyan, temporal. Circular representation of the connectional fingerprint associated with functionally (e) defined cortical areas coactivated with callosal clusters of the CC using diffusion-weighted MRI and probabilistic tractography with fMRI. Segments represent different areas and ribbons represent fiber tracts, to clearly assess the relationship between structural and functional brain properties. Connections between areas in opposite hemispheres that did not course through the activated clusters in the CC are not displayed. L = left; R = right; IFG = inferior frontal gyrus; M1/PM = primary motor/premotor cortex; SMA = supplementary motor cortex; STG = superior temporal gyrus; IPS = intraparietal sulcus; preCUN = precuneus. Adapted with permissions from Refs. , .
FIGURE 12:
FIGURE 12:
MRI of visual system plasticity following retinal gene therapy. Patients with Leber’s congenital amaurosis, a congenital retinal dystrophy that causes severe vision loss early in life, underwent gene therapy via subretinal injection of an adeno-associated virus vector into the superior temporal retina of the right eye, which projects ipsilaterally at the optic chiasm and, therefore, should only affect visual pathways projecting to the right hemisphere. Imaging occurred at least 2 years after gene therapy in these patients, along with demographically-matched control volunteers. MRI was conducted with a 3T scanner using a 32-channel head coil. (a,b) Diffusion tensor tractography. Major fiber tracts between the visual cortex and other parts of the brain, including the inferior fronto-occipital (IFO) fibers, inferior longitudinal fasciculus (IFL), occipital callosal (OCC) fibers, geniculostriate (GS) fibers, and optic chiasm (OC) fibers, as well as the nonvision-related corticospinal tracts (CST) as control fibers, were extracted and superimposed as anatomical regions-of-interest (ROIs) for average fractional anisotropy (FA) calculation in each tract. Fiber bundles were superimposed on a color FA template (a), with the left side of the brain on the right side. Tractography analysis only showed a difference between patients and controls for the GS fibers. A laterality index for average FA along the left and right GS fibers for each group was calculated (b). Patients had a much higher FA along the right GS fibers, and the laterality index was significantly different between groups, suggesting structural normalization of the right hemisphere visual cortex and GS fibers following unilateral treatment. (c,d) Functional imaging of visual cortical activation. Group-averaged fMRI results (c) of high-contrast checkerboard stimuli presented to the right eye of controls and patients showed symmetrical activation in the hemispheres of sighted controls, in contrast to the asymmetric activation in patients, which had much greater cortical activity in the right hemisphere. Here, the left side of the brain is on the left. An asymmetry index for total volume (number of voxels) activated in the left and right visual cortex was calculated in each group (d). Significantly greater quantifiable activation asymmetry was found in patients compared to controls, further demonstrating unilateral functional plasticity in response to treatment. Adapted with permission from Ref. .

References

    1. Pike MG, Holmstrom G, de Vries LS, et al. Patterns of visual impairment associated with lesions of the preterm infant brain. Dev Med Child Neurol 1994;36(10):849–862. - PubMed
    1. Pineles SL, Demer JL. Bilateral abnormalities of optic nerve size and eye shape in unilateral amblyopia. Am J Ophthalmol 2009;148(4):551–557. - PMC - PubMed
    1. Faiq MA, Wollstein G, Schuman JS, Chan KC. Cholinergic nervous system and glaucoma: From basic science to clinical applications. Prog Retin Eye Res 2019;72:100767. - PMC - PubMed
    1. Gala F Magnetic resonance imaging of optic nerve. Indian J Radiol Imaging 2015;25(4):421–438. - PMC - PubMed
    1. Hofer S, Karaus A, Frahm J. Reconstruction and dissection of the entire human visual pathway using diffusion tensor MRI. Front Neuroanat 2010;4:15. - PMC - PubMed

Publication types