. 2020 Oct 20;119(8):1590-1605.
doi: 10.1016/j.bpj.2020.07.044. Epub 2020 Sep 16.

Liquid Phase Separation Controlled by pH

Affiliations

Liquid Phase Separation Controlled by pH

Omar Adame-Arana et al. Biophys J. .

Abstract

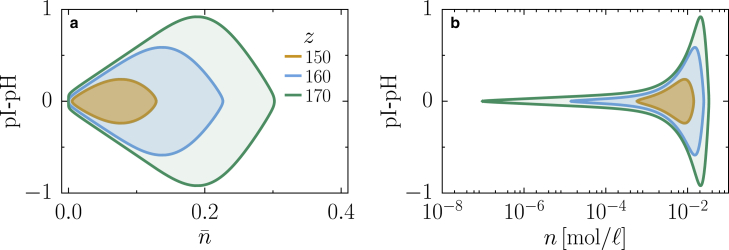
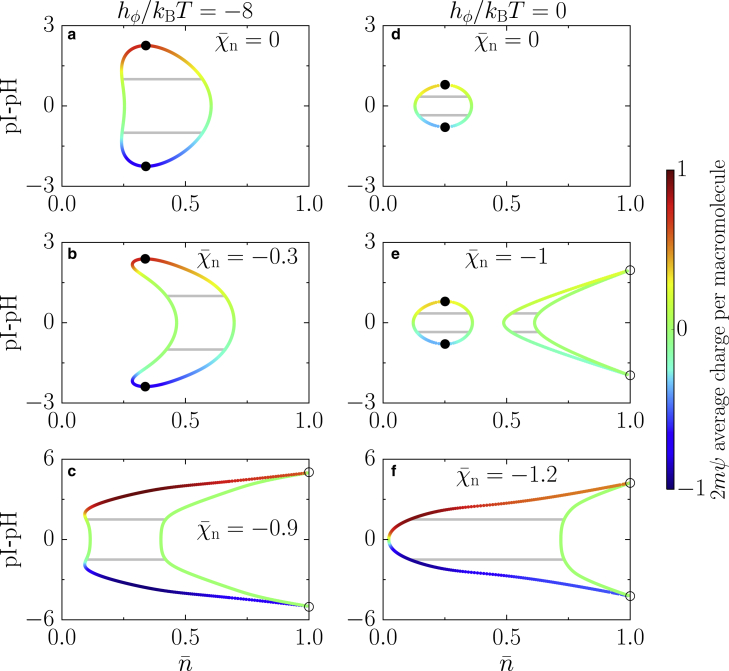
We present a minimal model to study the effects of pH on liquid phase separation of macromolecules. Our model describes a mixture composed of water and macromolecules that exist in three different charge states and have a tendency to phase separate. This phase separation is affected by pH via a set of chemical reactions describing protonation and deprotonation of macromolecules, as well as self-ionization of water. We consider the simple case in which interactions are captured by Flory-Huggins interaction parameters corresponding to Debye screening lengths shorter than a nanometer, which is relevant to proteins inside biological cells under physiological conditions. We identify the conjugate thermodynamic variables at chemical equilibrium and discuss the effective free energy at fixed pH. First, we study phase diagrams as a function of macromolecule concentration and temperature at the isoelectric point of the macromolecules. We find a rich variety of phase diagram topologies, including multiple critical points, triple points, and first-order transition points. Second, we change the pH relative to the isoelectric point of the macromolecules and study how phase diagrams depend on pH. We find that these phase diagrams as a function of pH strongly depend on whether oppositely charged macromolecules or neutral macromolecules have a stronger tendency to phase separate. One key finding is that we predict the existence of a reentrant behavior as a function of pH. In addition, our model predicts that the region of phase separation is typically broader at the isoelectric point. This model could account for both in vitro phase separation of proteins as a function of pH and protein phase separation in yeast cells for pH values close to the isoelectric point of many cytosolic proteins.


Figures

Figure 1
Figure 1
Chemical equilibrium conditions and free-energy density at chemical equilibrium. Multiple solutions are found for ϕ (a) and ψ (b) as a function of the total macromolecule volume fraction n¯, enabling the system to exhibit phase separation between different branches of the chemical equilibrium. The blue solid lines correspond to equilibrium concentrations at which the system remains homogeneous, the orange solid lines represent solutions to the chemical equilibrium relations that are metastable states, and the dotted red line shows the unstable states. (c) Maxwell construction for the dimensionless free-energy density vf¯/kBT is shown as a function of the total macromolecule volume fraction; the green line describes the region of macromolecule volume fraction where the system split into two phases, with different compositions given by the green circles. Parameters χe/kBT = −3, χn = 0, pI − pH = 0.2, hϕ/kBT = −10, and ε = 0.1 apply to all panels. To see this figure in color, go online.
Figure 2
Figure 2
Topologies of the phase diagrams for varying values of the normalized molecular field h˜ϕ = hϕ/kBT0 defined in Eq. 27, where T0 is a reference temperature. (ad) Phase diagrams for a system in which charge-charge interactions are slightly stronger than neutral-neutral interactions are given. (eh) Phase diagrams for a system in which neutral-neutral interactions are slightly stronger than charge-charge interactions are given. The binodals are given by the colored points, which denote coexisting phases. Tie lines (gray solid lines) connect coexisting phases and are horizontal. The regions within the binodals undergo a demixing transition, whereas the regions outside the binodal lines remain well mixed. The critical points at which phases become indistinguishable are denoted by black circles, first-order transition points at which there is a discontinuity in the value of ϕ are denoted by white circles, and triple points are denoted by black diamonds. A thorough explanation of the phase diagrams is given in the main text. Parameters χ = −8.5 and ε = 0.1 apply to all panels. The color bar indicates the value of the charged fraction of macromolecules 2ϕ. To see this figure in color, go online.
Figure 3
Figure 3
Critical behavior on the n¯ = 1 line. (ac) Derivative of the free energy with respect to ϕ for different temperature values is shown. (a) Inflection point corresponding to the critical point defined in (34a), (34b), (34c) is shown as a solid black circle. The black dotted line shows the value of h˜ϕ=h˜ϕc −23.23. (b) Emergence of a maximum and a minimum for T < Tc is shown; coexisting phases are shown as two colored circles (the color encodes their value of ϕ). (c) Derivative of the free-energy density is shown for T/T0 = 0.2, implying T/Tc ≪ 1. (df) Phase diagrams for fixed h˜ϕ = hϕ/kBT0 in the vicinity of the transition point at n¯ = 1 are given. (d) The solid black circle is the isolated critical point defined in (34a), (34b), (34c) corresponding to (a). (e) The phase coexistence lines shown in blue and red end on the n¯ = 1 line at the first-order transition point (open circle) defined in (b). (f) The coexistence region connected to the n¯ = 1 axis merges with the quasibinary region, leading to the appearance of two triple points (black diamonds in f). Parameters χ = −8.5, λ = 0.2, and ε = 0.1 apply to all panels. T0 is a reference temperature with Tc/T0 10.6. To see this figure in color, go online.
Figure 4
Figure 4
Phase behavior as a function of pH for fixed interaction strength between charges χe/kBT = −3.5 and varying values of the interaction strength χ¯n = χn/kBT between neutral macromolecules. (ac) Phase diagrams with neutral macromolecules energetically favored (hϕ/kBT = −8) are given. (a) In the absence of neutral-neutral interactions, there is a small region in the diagram where there is reentrant phase-separation behavior. (b) Small values of neutral-neutral interactions lead to a reduction of the demixing region. (c) Increasing the neutral-neutral attraction even further, the two critical points merge, and two first-order transition points appear at n¯ = 1; these points have a discontinuity in ϕ and ψ. (df) Phase diagrams with charged macromolecules energetically favored (hϕ/kBT = 0) are given. (d) An effective binary mixture at the pI shows a simple mixing behavior while deviating from the isoelectric point. (e) For large enough interactions between neutral macromolecules, a second disconnected region appears; such a region ends in two first-order transition points at n¯ = 1. (f) Increasing the neutral-neutral interactions further, the two regions merge, giving rise to a broadening of the demixing region while the critical points vanish and the coexistence region connects to the n¯ = 1 line with two first-order transition points at which ϕ and ψ have a discontinuity. Parameters ε = 0.1 and m = 1 apply to all panels. The color bar indicates the value of the charged fraction of macromolecules 2ϕ. To see this figure in color, go online.
Figure 5
Figure 5
Binodal lines for different choices of the total number of charges on the macromolecules z with interactions χe/kBT = −αzε. The shaded region within the binodals is the region where macromolecules undergo a demixing transition, whereas the region outside is where the system remains homogeneously mixed. (a) Phase diagram as a function of the total macromolecule volume fraction n¯ and deviations from the isoelectric point pH − pI is given. (b) The same diagram as in (a) is shown, but as a function of the total macromolecule molar concentration n. Parameters ε = 0.002, hϕ/kBT = 10, and α = 7.5 apply to both panels. To see this figure in color, go online.
Figure 6
Figure 6
Phase behavior as a function of pH; the color bar indicates the average charge per macromolecule 2 = m(nM+nM)/n. Parameters ε = 0.1, χe/kBT = −3.5, and m = 1 apply to all panels. To see this figure in color, go online.

References

    1. Alberts B. Garland Science; New York: 2017. Molecular Biology of the Cell.
    1. Brangwynne C.P., Eckmann C.R., Hyman A.A. Germline P granules are liquid droplets that localize by controlled dissolution/condensation. Science. 2009;324:1729–1732. - PubMed
    1. Molliex A., Temirov J., Taylor J.P. Phase separation by low complexity domains promotes stress granule assembly and drives pathological fibrillization. Cell. 2015;163:123–133. - PMC - PubMed
    1. Zwicker D., Decker M., Jülicher F. Centrosomes are autocatalytic droplets of pericentriolar material organized by centrioles. Proc. Natl. Acad. Sci. USA. 2014;111:E2636–E2645. - PMC - PubMed
    1. Brangwynne C.P. Phase transitions and size scaling of membrane-less organelles. J. Cell Biol. 2013;203:875–881. - PMC - PubMed

Publication types

LinkOut - more resources