. 2020 Dec 3;27(6):937-950.e9.
doi: 10.1016/j.stem.2020.09.016. Epub 2020 Sep 21.

Human Pluripotent Stem Cell-Derived Neural Cells and Brain Organoids Reveal SARS-CoV-2 Neurotropism Predominates in Choroid Plexus Epithelium

Affiliations

Human Pluripotent Stem Cell-Derived Neural Cells and Brain Organoids Reveal SARS-CoV-2 Neurotropism Predominates in Choroid Plexus Epithelium

Fadi Jacob et al. Cell Stem Cell. .

Abstract

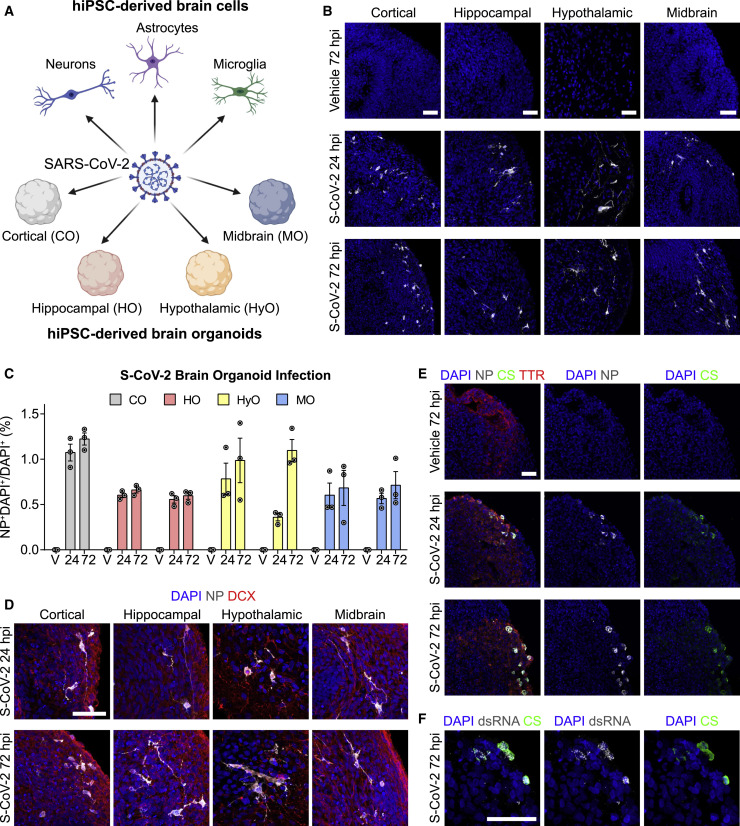
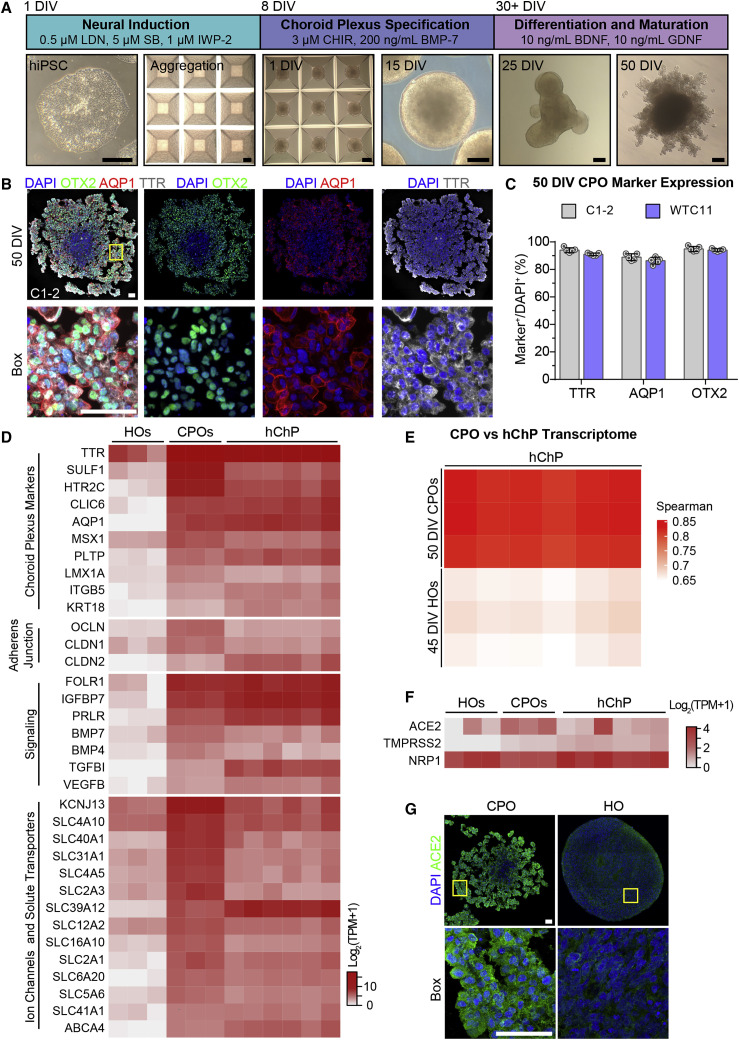
Neurological complications are common in patients with COVID-19. Although severe acute respiratory syndrome coronavirus 2 (SARS-CoV-2), the causal pathogen of COVID-19, has been detected in some patient brains, its ability to infect brain cells and impact their function is not well understood. Here, we investigated the susceptibility of human induced pluripotent stem cell (hiPSC)-derived monolayer brain cells and region-specific brain organoids to SARS-CoV-2 infection. We found that neurons and astrocytes were sparsely infected, but choroid plexus epithelial cells underwent robust infection. We optimized a protocol to generate choroid plexus organoids from hiPSCs and showed that productive SARS-CoV-2 infection of these organoids is associated with increased cell death and transcriptional dysregulation indicative of an inflammatory response and cellular function deficits. Together, our findings provide evidence for selective SARS-CoV-2 neurotropism and support the use of hiPSC-derived brain organoids as a platform to investigate SARS-CoV-2 infection susceptibility of brain cells, mechanisms of virus-induced brain dysfunction, and treatment strategies.

Keywords: COVID-19; SARS-CoV-2; astrocyte; brain organoid; choroid plexus organoid; cortical organoid; hippocampal organoid; human iPSCs; hypothalamic organoid; midbrain organoid; neuron; neurotropism.


Conflict of interest statement

Declaration of Interests The authors declare no competing interests.

Figures

None
Graphical abstract
Figure 1
Figure 1
SARS-CoV-2 Neurotropism in hiPSC-Derived Brain Organoids (A) Diagram outlining the strategy for testing the broad susceptibility of brain cells to SARS-CoV-2 infection. Tested cultures include hiPSC-derived cortical neurons, astrocytes, and microglia in monolayer cultures and hiPSC-derived cortical, hippocampal, hypothalamic, and midbrain organoids. (B) Representative confocal images of fluorescent immunohistology for DAPI and SARS-CoV-2 nucleoprotein (NP) in hiPSC-derived cortical, hippocampal, hypothalamic, and midbrain organoids after SARS-CoV-2 (S-CoV-2) (105 FFUs) or vehicle treatment at 24 and 72 h post-infection (hpi). Scale bars, 50 μm. FFUs, focus-forming units. (C) Quantification of percentages of NP+DAPI+ cells among DAPI+ cells in S-CoV-2 (105 FFUs) and vehicle (V)-treated, hiPSC-derived cortical organoid (CO), hippocampal organoid (HO), hypothalamic organoid (HyO), and midbrain organoid (MO) cultures at 24 and 72 hpi. Values represent mean ± SEM with individual data points plotted (n = 3 organoids per brain region and condition with 3 images per organoid). Brain organoids derived from two independent hiPSC lines were analyzed for HO, HyO, and MO. (D) Representative confocal images of fluorescent immunohistology for DAPI, NP, and neuronal marker doublecortin (DCX) in hiPSC-derived cortical, hippocampal, hypothalamic, and midbrain organoids after S-CoV-2 (105 FFUs) treatment at 24 and 72 hpi. Scale bar, 50 μm. (E) Representative confocal images of fluorescent immunohistology for DAPI, NP, convalescent serum from a patient with COVID-19 (CS), and transthyretin (TTR) in hippocampal organoids after S-CoV-2 (105 FFUs) or vehicle treatment at 24 and 72 hpi, highlighting regions with choroid plexus cell differentiation. Scale bar, 50 μm. (F) Representative confocal images of fluorescent immunohistology for DAPI, double-stranded RNA (dsRNA), and patient convalescent serum (CS) in a hippocampal organoid with a region of choroid plexus differentiation after S-CoV-2 (105 FFUs) treatment at 72 hpi. Scale bar, 50 μm. Also see Figure S1.
Figure 2
Figure 2
Generation of Choroid Plexus Organoids from hiPSCs (A) Diagram describing the protocol for generating choroid plexus organoids (CPOs) from hiPSCs with sample bright-field images of hiPSCs, aggregated hiPSCs, and CPOs at 1, 15, 25, and 50 days in vitro (DIV). Scale bars, 200 μm. (B) Representative confocal images of fluorescent immunohistology for DAPI, OTX2, AQP1, and TTR in CPOs at 50 DIV (made from C1-2 hiPSCs). Shown on the top panel are tiled images. Scale bars, 50 μm. (C) Quantification of percentages of TTR+, AQP1+, and OTX2+ cells among DAPI+ cells in CPOs at 50 DIV. Values represent mean ± SEM with individual data points plotted (n = 5 organoids per hiPSC line with 3 images per organoid). (D) Heatmap comparing expression of choroid plexus markers and genes related to adherens junction, cell signaling, and ion channel and solute transport genes within the bulk RNA transcriptomes of 45 DIV hippocampal organoids (HOs), 50 DIV CPOs, and adult human choroid plexus tissue (hChP) (Rodriguez-Lorenzo et al., 2020). Values are shown as Log2(TPM + 1). (E) Heatmap comparing the Spearman correlation of the bulk RNA transcriptomes of 50 DIV CPOs and 45 DIV HOs to adult hChP (Rodriguez-Lorenzo et al., 2020). (F) Heatmap comparing expression of SARS-CoV-2 receptor genes within the bulk RNA transcriptomes of 45 DIV HOs, 50 DIV CPOs, and hChP (Rodriguez-Lorenzo et al., 2020). Values are shown as Log2(TPM + 1). (G) Representative confocal images of fluorescent immunohistology for DAPI and ACE2 in the 50 DIV CPO and 65 DIV HO (made from C1-2 hiPSCs). Shown on the top panel are tiled images. Scale bars, 50 μm. Also see Figure S2 and Table S1.
Figure 3
Figure 3
Productive Infection of Choroid Plexus Organoids and Increased Cell Death by SARS-CoV-2 (A) Representative confocal images of fluorescent immunohistology for DAPI, SARS-CoV-2 NP, patient CS, and TTR after S-CoV-2 (105 FFUs) or vehicle treatment of 67 DIV CPOs at 24 and 72 hpi. Scale bar, 50 μm. (B) Quantification of percentages of NP+TTR+ cells among TTR+ cells after S-CoV-2 (105 FFUs) or vehicle treatment of 67 DIV CPOs at 24 and 72 hpi. Values represent mean ± SEM with individual data points plotted (n = 3 organoids per hiPSC line with 3 images per organoid; ∗∗∗p < 0.001; Fisher’s least significant difference [LSD] test). (C) Quantification of viral titers from CPO lysates (left) and culture supernatants (right) after S-CoV-2 (105 FFUs) treatment of 47 DIV CPOs at 0, 24, and 72 hpi. Values represent mean ± SD (n = 2 biological replicates consisting of 4 organoids each; p < 0.05; ∗∗∗p < 0.001; Student’s t test). (D) Representative confocal images of fluorescent immunohistology for DAPI and NP after S-CoV-2 (105 FFUs) treatment of 47 DIV CPOs at 24 and 72 hpi. Boxed regions show NP+ syncytia with individual Z-planes separated to highlight multiple nuclei counted within each syncytium. Scale bars, 25 μm. (E) Quantification of the percentages of NP+ syncytia among total NP+ cells after S-CoV-2 (105 FFUs) treatment of 47 DIV CPOs at 24 and 72 hpi. Values represent mean ± SEM with individual data points plotted (n = 3 organoids per hiPSC line with 3 images per organoid; ∗∗p < 0.01; Fisher’s LSD test). (F) Representative confocal images of fluorescent immunohistology for DAPI, TUNEL, NP, and TTR after S-CoV-2 (105 FFUs) or vehicle treatment of 67 DIV CPOs at 24 and 72 hpi. Boxed regions highlight NP+TUNEL+ cells. Yellow arrows highlight NPTUNEL+ cells near NP+ cells. Scale bars, 25 μm. (G) Quantification of percentages of TUNEL+NPTTR+ cells among NPTTR+ cells (top) and TUNEL+NP+TTR+ cells among NP+TTR+ cells (bottom) after S-CoV-2 (105 FFUs) or vehicle treatment of 67 DIV CPOs at 24 and 72 hpi. Values represent mean ± SEM with individual data points plotted (n = 3 organoids per hiPSC line with 3 images per organoid; p < 0.05; ∗∗∗p < 0.001; ns, not significanct, p > 0.05; Fisher’s LSD test). Also see Figure S3.
Figure 4
Figure 4
Transcriptional Dysregulation in Choroid Plexus Organoids upon SARS-CoV-2 Infection (A) Quantification comparing Log10(TPM+1) of S-CoV-2 viral transcripts after S-CoV-2 (105 FFUs) or vehicle treatment of 47 DIV CPOs at 24 and 72 hpi by bulk RNA-seq. Values represent mean ± SEM with individual data points plotted (n = 3 biological replicates containing 3 organoids each). (B) Quantification comparing Log10(TPM+1) of known S-CoV-2 receptor transcripts after S-CoV-2 (105 FFUs) or vehicle treatment of 47 DIV CPOs at 24 and 72 hpi by bulk RNA-seq. Values represent mean ± SEM with individual data points plotted (n = 3 biological replicates containing 3 organoids each). (C) Dot plot of selected enriched gene ontology (GO) terms for biological process (red), molecular function (green), and cellular component (blue) for upregulated and downregulated genes when comparing S-CoV-2 (105 FFUs) and vehicle-treated 47 DIV CPOs at 72 hpi. See Table S2 for the complete list of differentially expressed genes and Table S3 for the complete list of GO terms for differentially expressed genes. tmem., transmembrane. (D) Heatmap of selected upregulated and downregulated genes when comparing S-CoV-2 (105 FFUs) and vehicle-treated 47 DIV CPOs at 72 hpi. Genes related to different biological functions are grouped and labeled. Values are shown for each biological replicate as the row Z score per gene of Log2(TPM+1)-transformed values. (E) Venn diagrams comparing the overlap of upregulated and downregulated genes following S-CoV-2 infection in CPOs, human hepatocyte organoids (Yang et al., 2020a), and human intestinal organoids (Lamers et al., 2020). Differentially expressed genes at both 24 and 72 hpi were combined for CPOs, and differentially expressed genes for both expansion and differentiation intestinal organoid types were combined for intestinal organoids. Also see Figure S4 and Tables S1, S2, and S3.

Update of

References

    1. Ashburner M., Ball C.A., Blake J.A., Botstein D., Butler H., Cherry J.M., Davis A.P., Dolinski K., Dwight S.S., Eppig J.T. Gene ontology: tool for the unification of biology. The Gene Ontology Consortium. Nat. Genet. 2000;25:25–29. - PMC - PubMed
    1. Bao L., Deng W., Huang B., Gao H., Liu J., Ren L., Wei Q., Yu P., Xu Y., Qi F. The pathogenicity of SARS-CoV-2 in hACE2 transgenic mice. Nature. 2020;583:830–833. - PubMed
    1. Bardy C., van den Hurk M., Eames T., Marchand C., Hernandez R.V., Kellogg M., Gorris M., Galet B., Palomares V., Brown J. Neuronal medium that supports basic synaptic functions and activity of human neurons in vitro. Proc. Natl. Acad. Sci. USA. 2015;112:E2725–E2734. - PMC - PubMed
    1. Beers J., Linask K.L., Chen J.A., Siniscalchi L.I., Lin Y., Zheng W., Rao M., Chen G. A cost-effective and efficient reprogramming platform for large-scale production of integration-free human induced pluripotent stem cells in chemically defined culture. Sci. Rep. 2015;5:11319. - PMC - PubMed
    1. Bolger A.M., Lohse M., Usadel B. Trimmomatic: a flexible trimmer for Illumina sequence data. Bioinformatics. 2014;30:2114–2120. - PMC - PubMed

Publication types