

Adverse effects on growth performance and bone development in nursery pigs fed diets marginally deficient in phosphorus with increasing calcium to available phosphorus ratios
- PMID: 33011771
- PMCID: PMC7751169
- DOI: 10.1093/jas/skaa325
Adverse effects on growth performance and bone development in nursery pigs fed diets marginally deficient in phosphorus with increasing calcium to available phosphorus ratios
Abstract
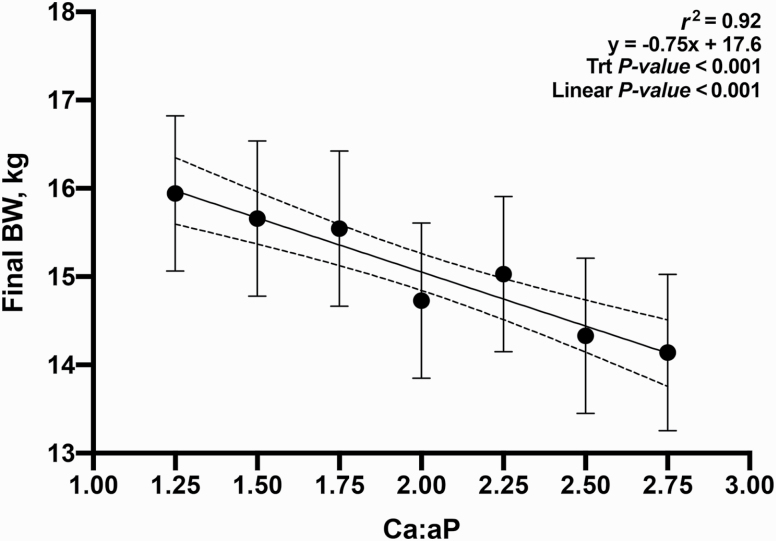
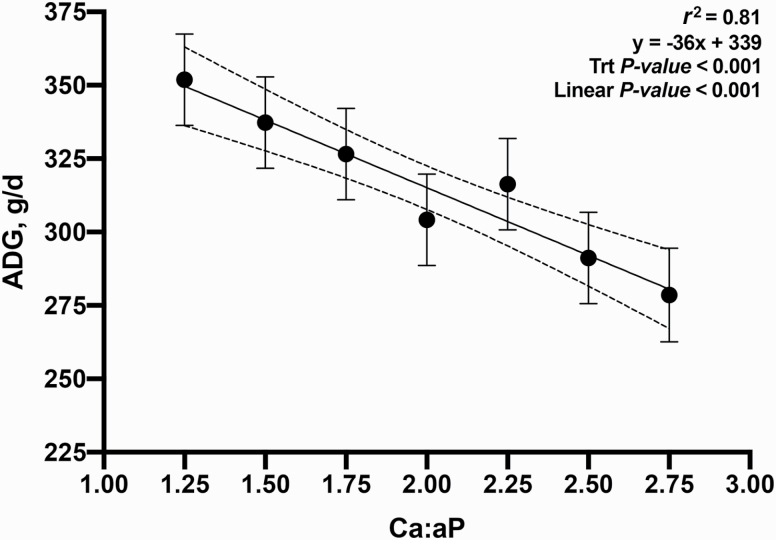
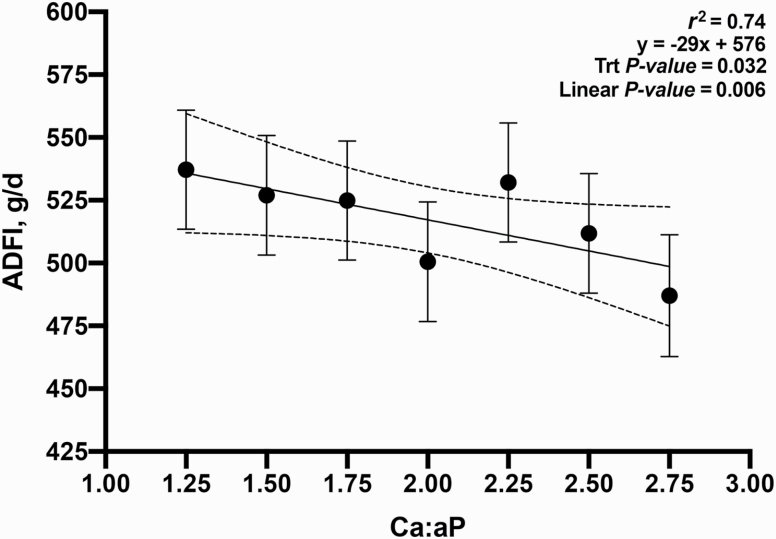
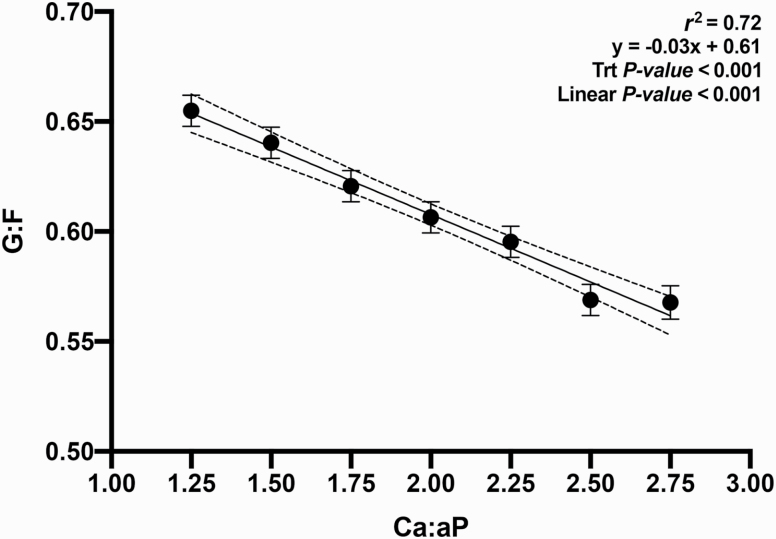
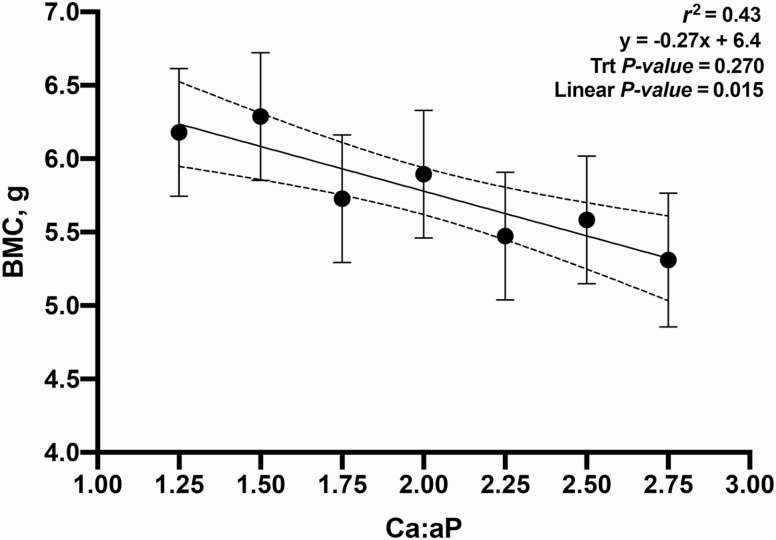
The objective of this experiment was to evaluate the growth performance and bone mineral content (BMC) of nursery pigs in response to increasing total calcium (Ca) to available phosphorus (aP) ratios in diets containing phytase (250 FTU/kg; Natuphos E, BASF, Florham Park, NJ). A total of 480 nursery pigs (body weight (BW) = 5.7 ± 0.6 kg) with 10 pigs per pen and 7 pens per treatment (6 pens fed 2.75:1 diet) were allotted to seven treatments consisting of increasing ratios of calcium to available phosphorus (Ca:aP): 1.25, 1.50, 1.75, 2.00, 2.25, 2.50, and 2.75. From day -7 to 0, pigs were fed a common diet. They were then fed the treatment diets during two experimental phases from day 1 to 14 and 15 to 28, respectively. Available P was formulated to 0.33% and 0.27% (approximately 90% of requirement) in dietary phases 1 and 2, respectively. BW, average daily gain (ADG), average daily feed intake (ADFI), and gain-to-feed ratio (G:F) were determined. BMC of the femur was measured on day 28 on one pig per pen using dual x-ray absorptiometry. Data were analyzed as a linear mixed model using PROC MIXED (SAS, 9.3). Orthogonal polynomial contrasts were used to determine the linear and quadratic effects of increasing the Ca:aP. Over the 28-d experimental period, increasing Ca:aP resulted in a linear decrease in ADG (353, 338, 328, 304, 317, 291, and 280 g/d; P < 0.01), ADFI (539, 528, 528, 500, 533, 512, and 489 g/d; P < 0.05), and G:F (0.68, 0.66, 0.64, 0.62, 0.61, 0.59, and 0.58; P < 0.01). Increasing Ca:aP also resulted in decreased BW on days 14 and 28 (P < 0.01). The BMC of the femur decreased with increasing Ca:aP (6.2, 6.3, 5.7, 5.9, 5.5, 5.6, and 5.3 g; P < 0.05). Regression analysis explained the impact of Ca:aP as follows on ADG (ADG [g/d] = 339 - 36x; r2 = 0.81), G:F (G:F = 0.61 - 0.03x; r2 = 0.72), and BMC (BMC [g] = 6.4 - 0.27x; r2 = 0.43), where x is the Ca:aP. In conclusion, all outcomes indicated that any level of calcium above the minimum used in this experiment impaired growth performance and skeletal development. Further research using even lower levels of dietary Ca is warranted.
Keywords: bone mineral content; dual x-ray absorptiometry; swine.
© The Author(s) 2020. Published by Oxford University Press on behalf of the American Society of Animal Science.
Figures
References
-
- AAFCO. 2000. Official publication 2000. Atlanta (GA): Association of American Feed Control Officials Incorporated.
-
- Akter M M, Graham H, and Iji P A. . 2018. Influence of different levels of calcium, non-phytate phosphorus and phytase on apparent metabolizable energy, nutrient utilization, plasma mineral concentration and digestive enzyme activities of broiler chickens. J. Appl. Anim. Res. 46:278–286. doi: 10.1080/09712119.2017.1295972 - DOI
-
- Bridges T C, Turner L W, Cromwell G L, and Pierce J L. . 1995. Modeling the effects of diet formulation on nitrogen and phosphorus excretion in swine waste. Appl. Eng. Agric. 11:731–739. doi: 10.13031/2013.25797 - DOI
-
- Crenshaw T D. 2001. Calcium, phosphorus, vitamin D, and vitamin K in swine nutrition. In: Lewis A., and Southern L L, editors. Swine nutrition. 2nd ed. Boca Raton (FL): CRC Press; p. 196–221.
MeSH terms
Substances
LinkOut - more resources
Full Text Sources
