Review
. 2020 Dec;42(6):1499-1525.
doi: 10.1007/s11357-020-00252-7. Epub 2020 Oct 4.

Retinal biomarkers for Alzheimer's disease and vascular cognitive impairment and dementia (VCID): implication for early diagnosis and prognosis

Affiliations
Review

Retinal biomarkers for Alzheimer's disease and vascular cognitive impairment and dementia (VCID): implication for early diagnosis and prognosis

Cecilia Czakó et al. Geroscience. 2020 Dec.

Abstract

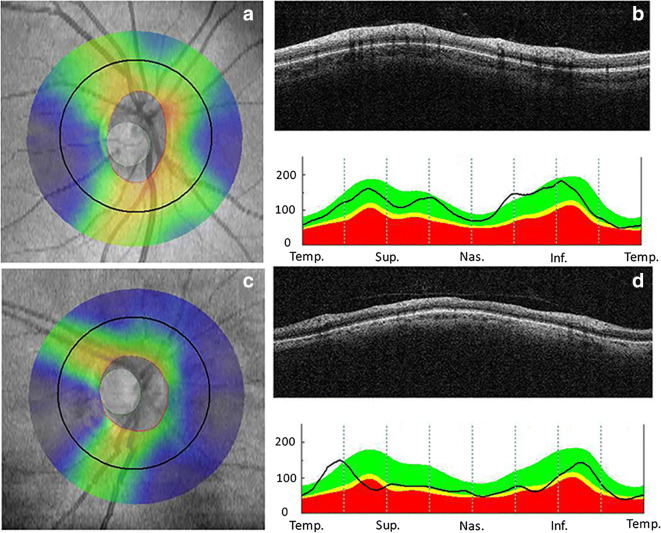
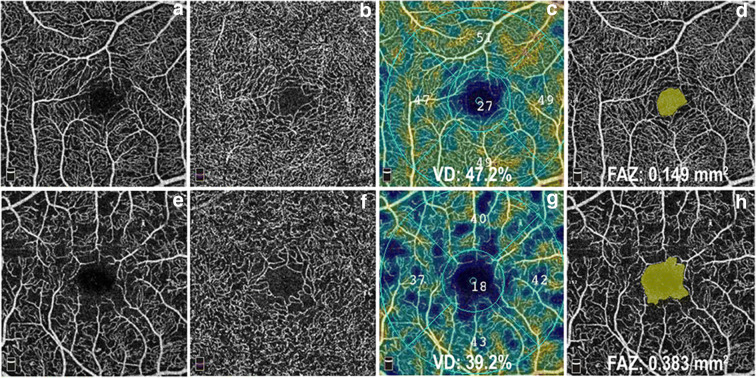
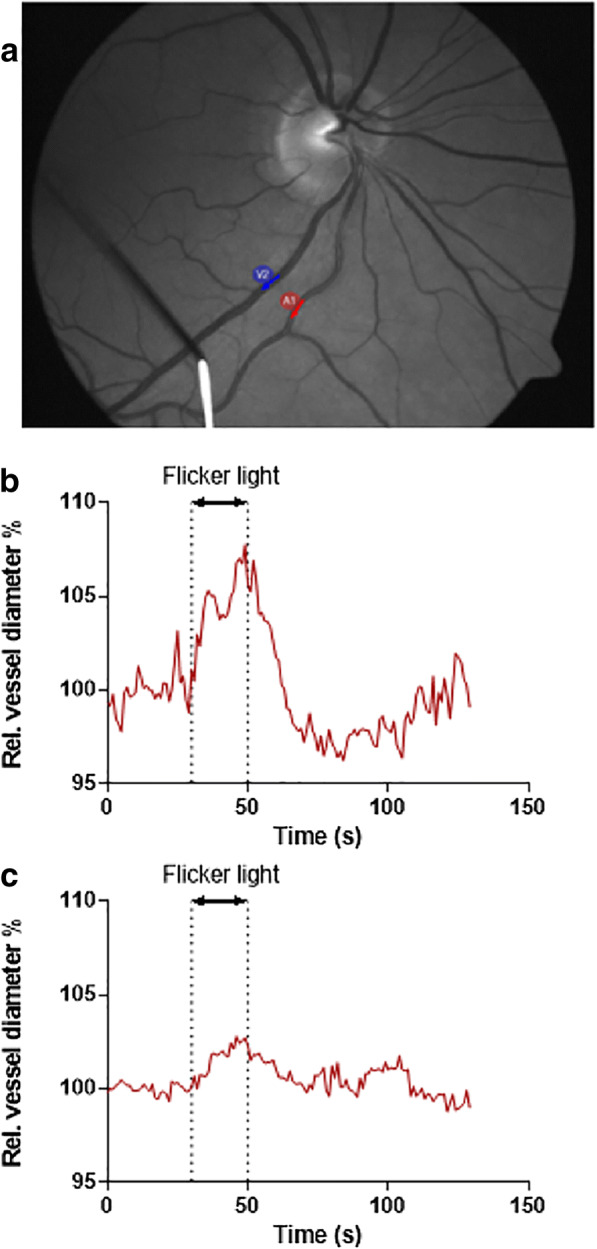
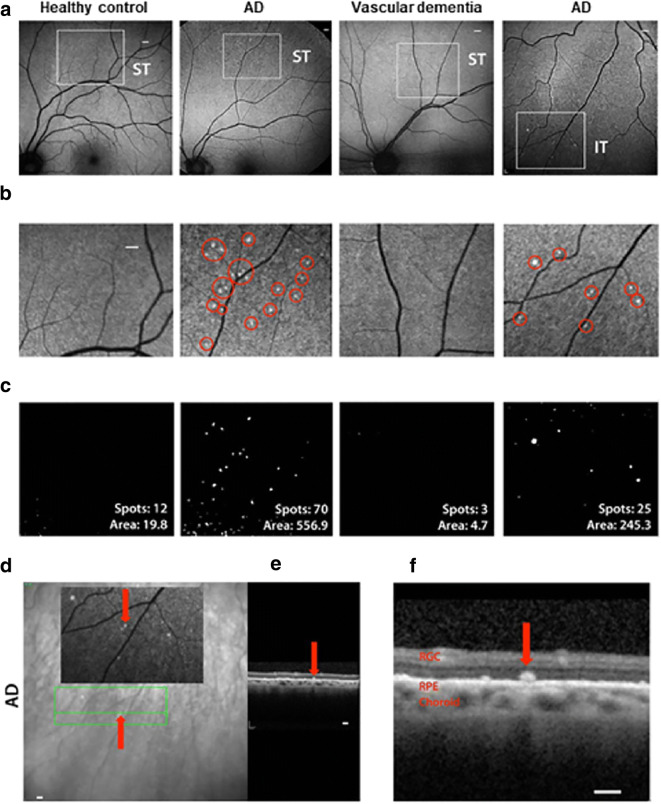
Cognitive impairment and dementia are major medical, social, and economic public health issues worldwide with significant implications for life quality in older adults. The leading causes are Alzheimer's disease (AD) and vascular cognitive impairment/dementia (VCID). In both conditions, pathological alterations of the cerebral microcirculation play a critical pathogenic role. Currently, the main pathological biomarkers of AD-β-amyloid peptide and hyperphosphorylated tau proteins-are detected either through cerebrospinal fluid (CSF) or PET examination. Nevertheless, given that they are invasive and expensive procedures, their availability is limited. Being part of the central nervous system, the retina offers a unique and easy method to study both neurodegenerative disorders and cerebral small vessel diseases in vivo. Over the past few decades, a number of novel approaches in retinal imaging have been developed that may allow physicians and researchers to gain insights into the genesis and progression of cerebromicrovascular pathologies. Optical coherence tomography (OCT), OCT angiography, fundus photography, and dynamic vessel analyzer (DVA) are new imaging methods providing quantitative assessment of retinal structural and vascular indicators-such as thickness of the inner retinal layers, retinal vessel density, foveal avascular zone area, tortuosity and fractal dimension of retinal vessels, and microvascular dysfunction-for cognitive impairment and dementia. Should further studies need to be conducted, these retinal alterations may prove to be useful biomarkers for screening and monitoring dementia progression in clinical routine. In this review, we seek to highlight recent findings and current knowledge regarding the application of retinal biomarkers in dementia assessment.

Keywords: Alzheimer’s disease; Dementia; OCT angiography; Retinal biomarkers; Retinal imaging.


Conflict of interest statement

The authors declare that they have no competing interests.

Figures

Fig. 1
Fig. 1
Neuropathological changes in AD. a, e β-amyloid immunohistochemistry, antibody 6F/3D, Dako (Denmark), 1:200, hematoxylin counterstaining. bd Hyperphosphorylated tau immunohistochemistry, antibody AT8 (Invitrogen/Thermo Fisher, USA), 1:100, hematoxylin counterstaining. a Amyloid plaques in the cingulate cortex. β-amyloid deposition around penetrating cortical vessels (asterisks) are shown by arrows. Bar represents 200 μm. b Neurofibrillary tangles (arrows) and abundant neuropil threads in the cingulate cortex in AD. Bar represents 50 μm. c Hippocampal pyramidal neuron with granular positivity in its cytoplasm in initial stage of NFT formation (pre-tangle neuron). Bar represents 50 μm. d Hippocampal pyramidal neuron with granular and filamental positivity in its cytoplasm (arrow) and dystrophic neurites around a senile plaque (empty arrow). Bar represents 50 μm. e Classical β-amyloid plaque in the cingulate cortex with high magnification showing the ring-with-core appearance. Bar represents 50 μm
Fig. 2
Fig. 2
Retinal vessel analysis: fundus photography (a) and skeletonized image of retinal vascular network for fractal analysis (b). The retinal fractal dimension (FD) is a measure of vasculature branching pattern complexity. Identification and measurement of retinal arteriole and venule caliber (c). The red and blue shadings indicate the selected arteriole and venule area, respectively. Measurement of retinal vascular tortuosity (d) that is derived from the integral of the curvature square along the vessel tracings, normalized by the total path length measured in a specified area
Fig. 3
Fig. 3
Visualization of retinal vasculature on intravenous fluorescein angiography (a) and using OCT angiography (be) in a normal eye. The dye in the vessels appears white against the darker background (a), while OCTA provides separate analysis of the superficial (b), deep (c), outer retinal (d), and choriocapillary (e) layers in the central 6 × 6 mm macular area (yellow square area in a)
Fig. 4
Fig. 4
OCT visualizes the different retinal layers on cross-sectional SD-OCT (a). Normal central subfield thickness (CST) and total macular volume (TMV) in a healthy subject (b, 16-year-old), and decreased CST and TMV in an aged person (c, 84-year-old). ILM, internal limiting membrane; RNFL, retinal nerve fiber layer; GCL, ganglion cell layer; IPL, inner plexiform layer; INL, inner nuclear layer; OPL, outer plexiform layer; ONL, outer nuclear layer; ELM, external limiting membrane; IS/OS, photoreceptor inner segment/outer segment junction; RPE, retinal pigment epithelium; SD-OCT, spectral-domain optical coherence tomography
Fig. 5
Fig. 5
Optical coherence tomography of the optic nerve head and retinal nerve fiber layer (RNFL) analysis showing normal (ac) and decreased (df) peripapillary RNFL thickness. The numbers refer to RNFL thickness in micrometers. RNFL thicknesses are shown in Figure 5 b and e. Note: green: p>5%: within normal; yellow: p<5%: borderline; red: p<1%: outside normal
Fig. 6
Fig. 6
En face OCT angiograms of the 3 × 3 mm macular region from a healthy subject (ad) and from a patient with decreased retinal blood flow (eh). OCT angiograms at the level of the superficial (a) and the deep retinal vascular plexus (b) using the OptoVue AngioVue system. The AngioAnalytics software provides quantitative measurements of retinal blood flow including the retinal capillary vessel density map (c, g) and the foveal avascular zone (FAZ) area (d, h)
Fig. 7
Fig. 7
a Representative fundus image showing a retinal arteriole (red arrow) and a retinal venule (blue arrow), in which flicker light stimulus–induced changes in diameter were recorded using the dynamic vessel analysis (DVA) approach. (b, c) Time course of changes in diameter of retinal arterioles in response to flicker light stimulation in a 59-year-old healthy male (b) and a 65-year-old male with a major cardiovascular risk factor present (insulin-dependent diabetes mellitus) (c)
Fig. 8
Fig. 8
A proof-of-concept study [189] demonstrating the possibility of detecting retinal amyloid deposits in human subjects in vivo. Retina of subjects was imaged with a modified scanning-laser ophthalmoscope prior to and following curcumin (Longvida®) intake. a Fundus images of two AD patients, a patient with vascular dementia and a healthy control. Regions of interest are indicated by white squares for superior temporal (ST) and inferior temporal (IT) region. Retinal curcumin spots are seen in AD patients in contrast with minimal spots seen in a healthy control and a patient with vascular dementia. Curcumin fluorescence fundography detected amyloid deposits frequently concentrated in the superior temporal region (ST) in AD patients. b Magnified images of the above regions of interest, red circles highlighting curcumin fluorescence positive retinal spots. c Spot number and fluorescent area (μm [2]) post-image processing proposed by the study. d, e OCT image of curcumin fluorescence positive plaque in an AD patient with no maculopathy present. d Curcumin fluorescence positive amyloid plaque (red arrows). Green lines delineate region of OCT segmentation. e Retinal cross-section by OCT reveals amyloid plaque in outer retinal layers. f Magnified OCT image of curcumin fluorescence positive deposit located above the retinal pigment epithelium (RPE), along with intact RPE and Bruch’s membrane. Images are modified, reprinted from Koronyo et al. [189], with permission of original publisher

Similar articles

Cited by

References

    1. WHO. https://www.who.int/news-room/fact-sheets/detail/dementia. 2019
    1. 2020 Alzheimer’s disease facts and figures. Alzheimers Dement. 2020. - PubMed
    1. Liesz A. The vascular side of Alzheimer’s disease. Science. 2019;365:223–224. - PubMed
    1. Dubois B, Feldman HH, Jacova C, Hampel H, Molinuevo JL, Blennow K, DeKosky ST, Gauthier S, Selkoe D, Bateman R, Cappa S, Crutch S, Engelborghs S, Frisoni GB, Fox NC, Galasko D, Habert MO, Jicha GA, Nordberg A, Pasquier F, Rabinovici G, Robert P, Rowe C, Salloway S, Sarazin M, Epelbaum S, de Souza LC, Vellas B, Visser PJ, Schneider L, Stern Y, Scheltens P, Cummings JL. Advancing research diagnostic criteria for Alzheimer’s disease: the IWG-2 criteria. Lancet Neurol. 2014;13:614–629. - PubMed
    1. Budson AE, Solomon PR. New diagnostic criteria for Alzheimer’s disease and mild cognitive impairment for the practical neurologist. Pract Neurol. 2012;12:88–96. - PubMed

Publication types