. 2021 Feb;250(2):274-294.
doi: 10.1002/dvdy.258. Epub 2020 Oct 22.

Knockout of the gene encoding the extracellular matrix protein SNED1 results in early neonatal lethality and craniofacial malformations

Affiliations

Knockout of the gene encoding the extracellular matrix protein SNED1 results in early neonatal lethality and craniofacial malformations

Anna Barqué et al. Dev Dyn. 2021 Feb.

Abstract

Background: The extracellular matrix (ECM) is a fundamental component of multicellular organisms that orchestrates developmental processes and controls cell and tissue organization. We previously identified the novel ECM protein SNED1 as a promoter of breast cancer metastasis and showed that its level of expression negatively correlated with breast cancer patient survival. Here, we sought to identify the roles of SNED1 during murine development.

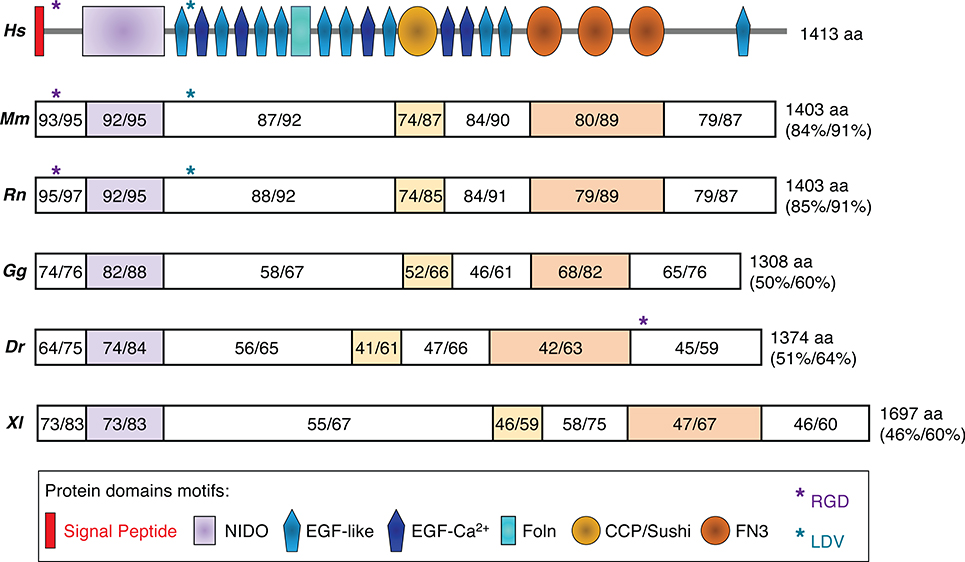
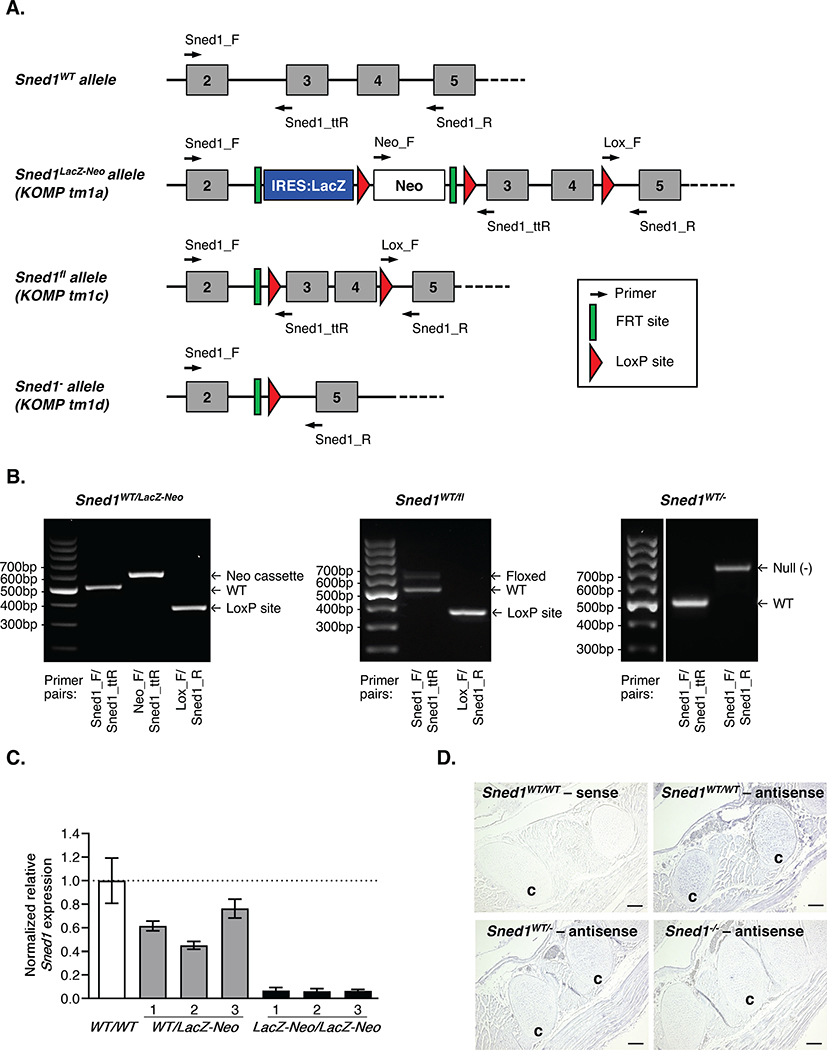
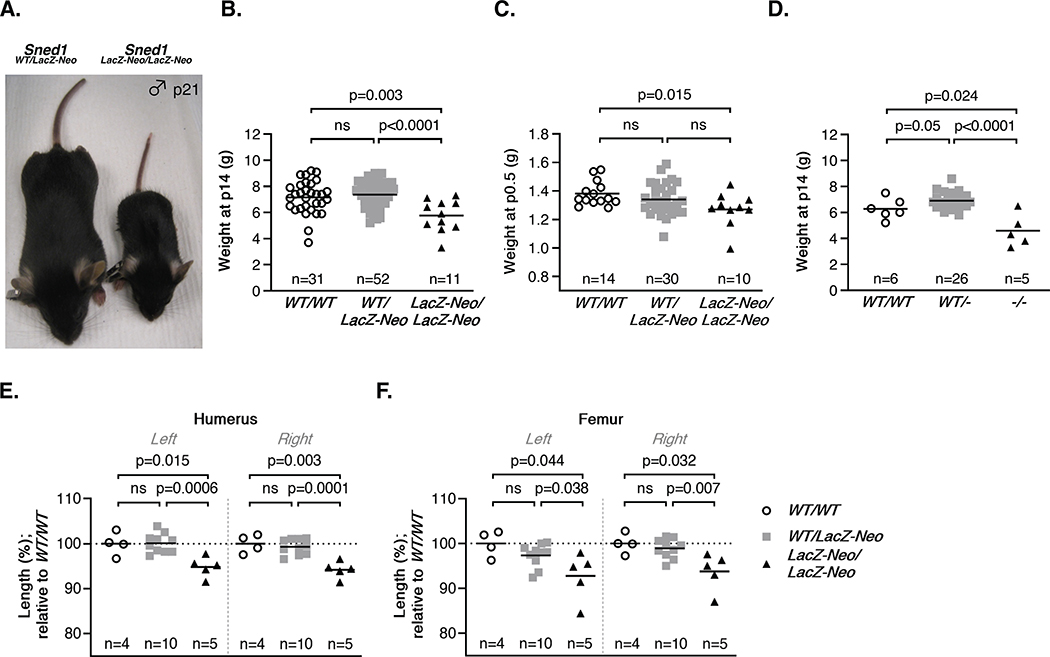
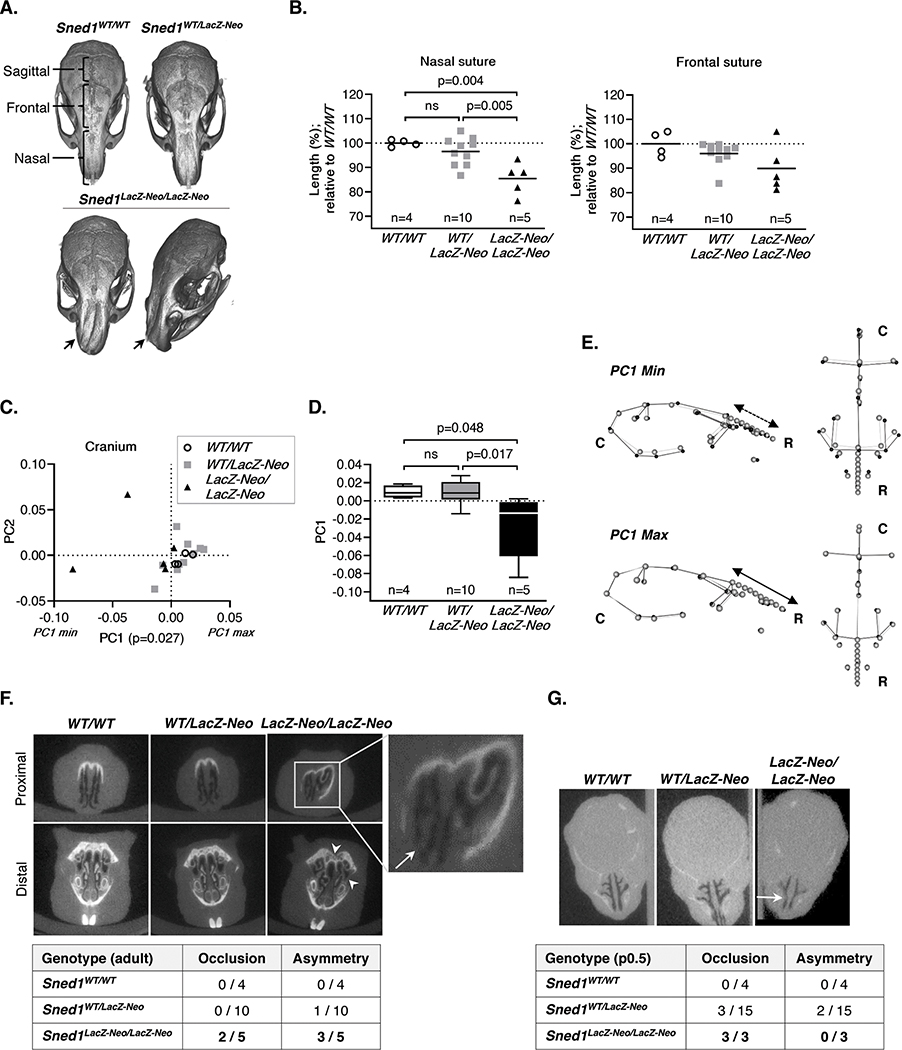
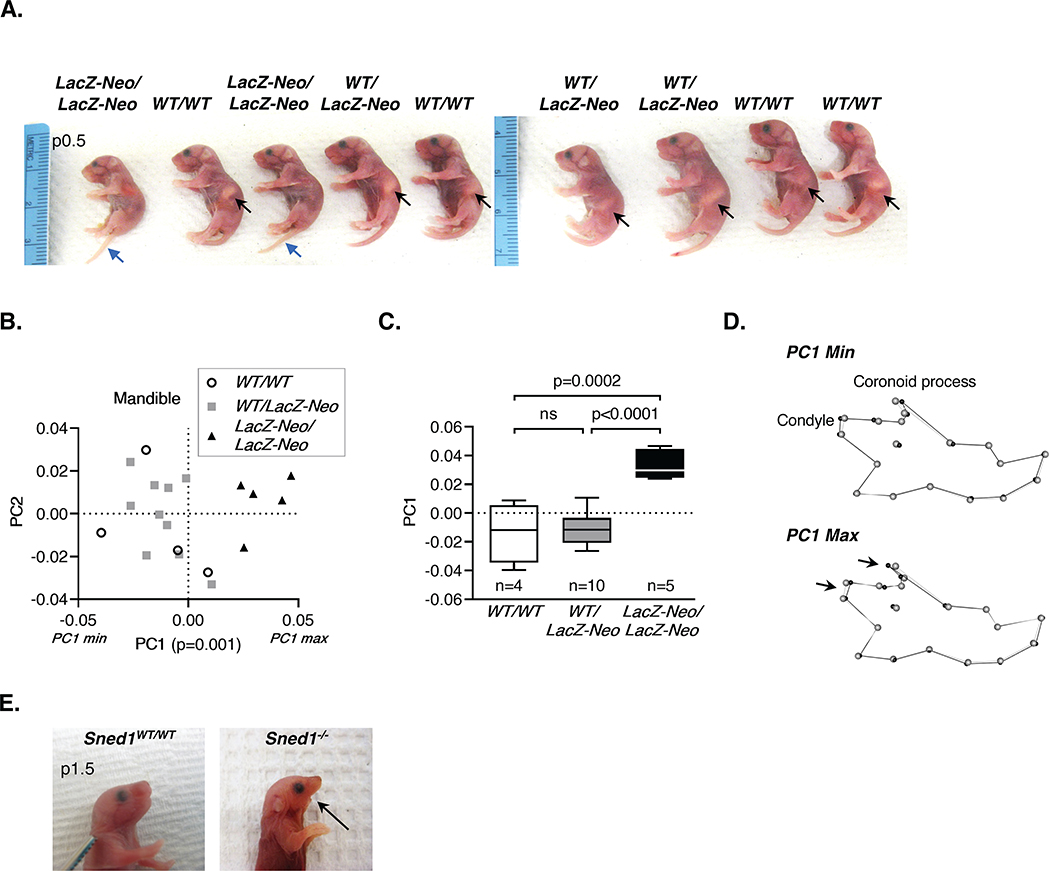
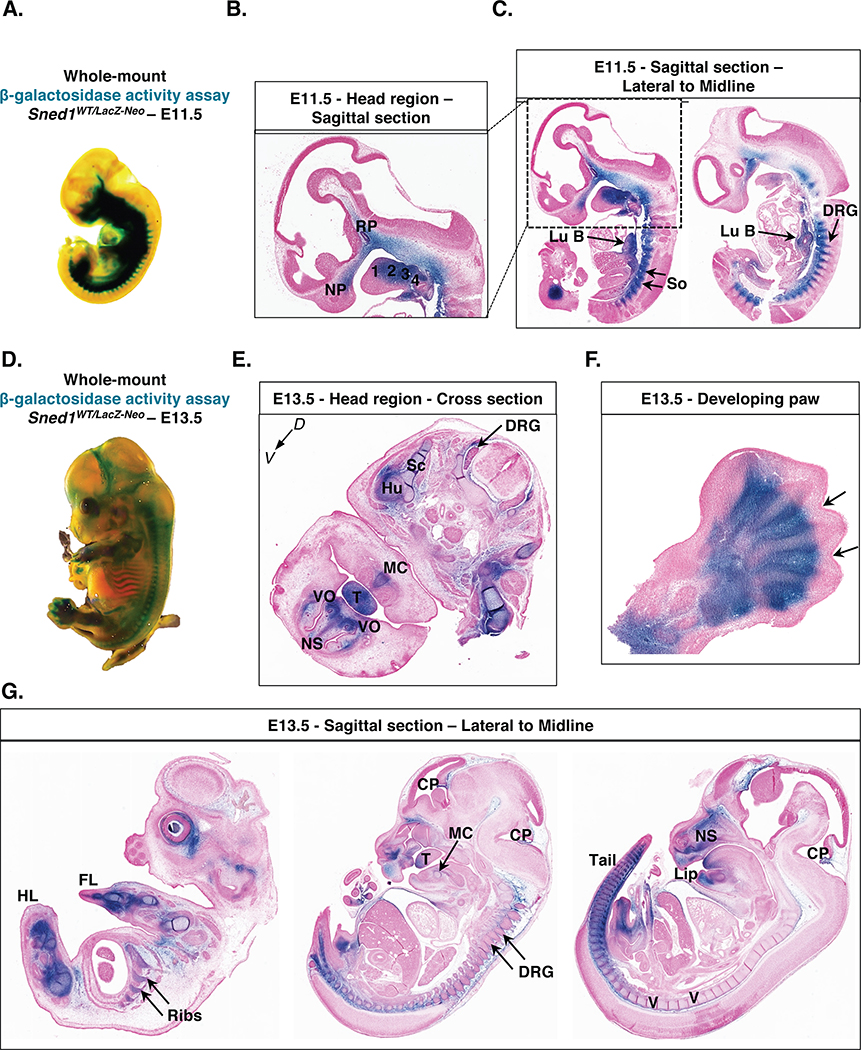
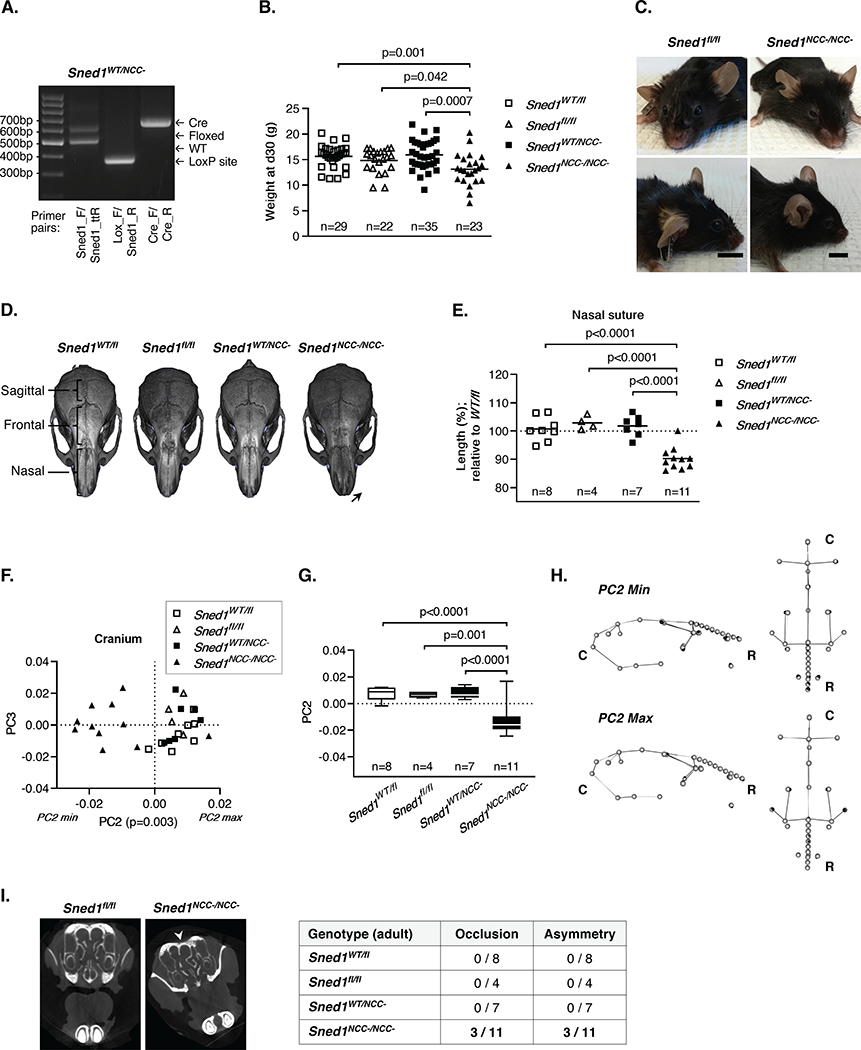
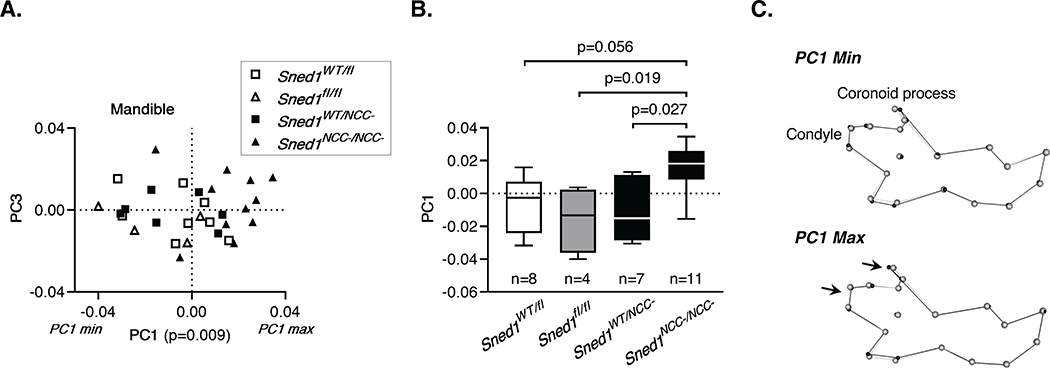
Results: We generated two novel Sned1 knockout mouse strains and showed that Sned1 is essential since homozygous ablation of the gene led to early neonatal lethality. Phenotypic analysis of the surviving knockout mice revealed a role for SNED1 in the development of craniofacial and skeletal structures since Sned1 knockout resulted in growth defects, nasal cavity occlusion, and craniofacial malformations. Sned1 is widely expressed in embryos, notably by cell populations undergoing epithelial-to-mesenchymal transition, such as the neural crest cells. We further show that mice with a neural-crest-cell-specific deletion of Sned1 survive, but display facial anomalies partly phenocopying the global knockout mice.

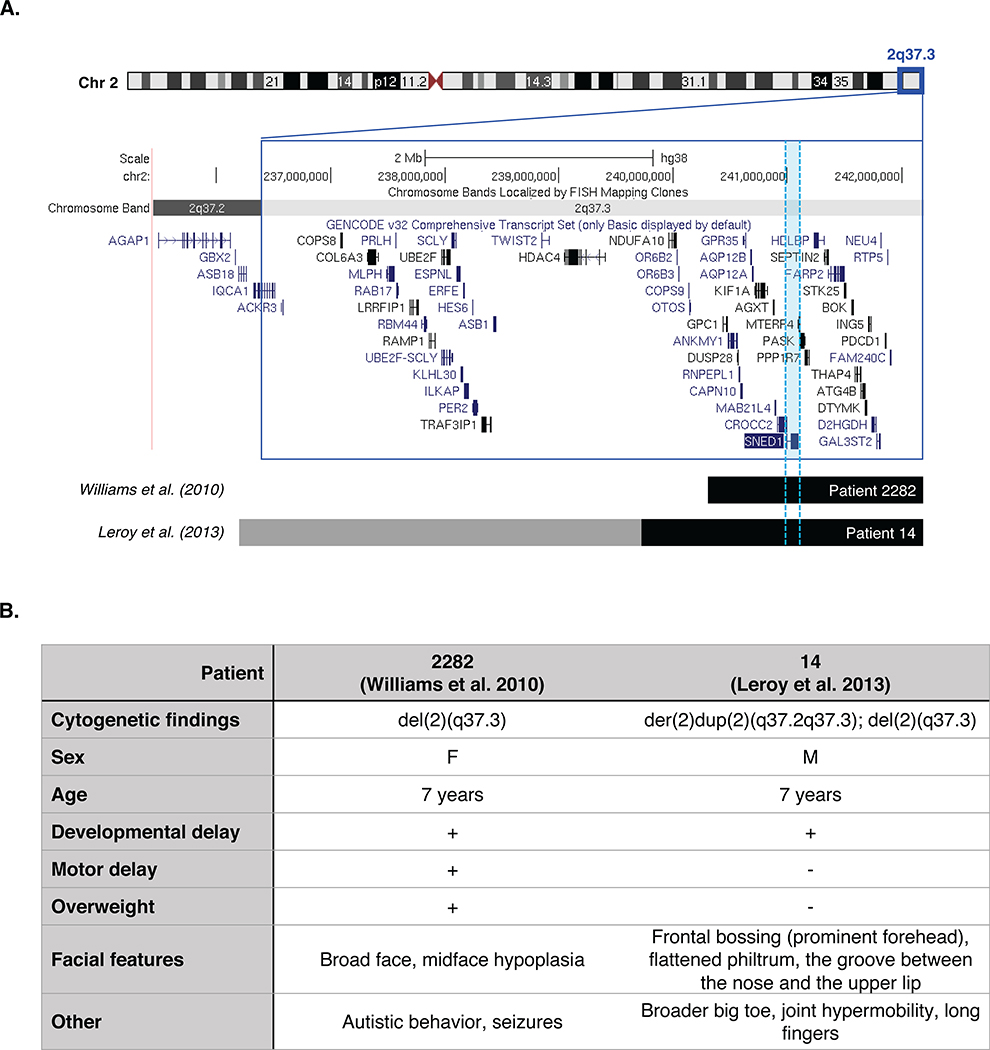
Conclusions: Our results demonstrate requisite roles for SNED1 during development and neonatal survival. Importantly, the deletion of 2q37.3 in humans, a region that includes the SNED1 locus, has been associated with facial dysmorphism and short stature.

Keywords: craniofacial features; geometric morphometrics; knockout mouse; mandible; neural crest cells.


Figures

Figure 1.
Figure 1.. SNED1 phylogeny
Schematic representation of the protein domains of SNED1 and alignment between the human (Hs) sequence of SNED1 (UniProt accession Q8TER0) and orthologs found in mouse (M. musculus, Mm; UniProt accession Q70E20); rat (R. Norvegicus, Rn; UniProt accession Q5ZQU0); chicken (G. gallus, Gg; UniProt accession A0A1D5P671); zebrafish (D. rerio, Dr; UniProt accession E7F2S5); and frog (X. laevis, Xl; UniProt accession A0A1L8GAZ2). Alignment was performed using Protein BLAST (https://blast.ncbi.nlm.nih.gov/Blast.cgi?PAGE=Proteins). Percent identity and percent homology are indicated for each domain or fragment of SNED1 and for the full-length proteins. Protein length in amino acid (aa) is also indicated.
Figure 2.
Figure 2.. Sned1 knockout strategies and genotyping
A. Schematics of the different alleles Sned1WT, Sned1LacZ-Neo (KOMP tm1a), Sned1fl (KOMP tm1c), and Sned1 (KOMP tm1d). Arrows indicate primers used for genotyping. B. PCR genotyping of genomic DNA isolated from tail samples of Sned1WT/LacZ-Neo (left panel), Sned1WT/fl (middle panel), and Sned1WT/- (right panel) mice. C. RT-qPCR was used to monitor the level of expression of Sned1 in mouse embryonic fibroblasts isolated from Sned1WT/WT (n=1), Sned1WT/LacZ-Neo (n=3), or Sned1LacZ-Neo/LacZ-Neo (n=3) embryos. Bar charts represent normalized expression of Sned1 relative to wild-type cells. Actin expression level was used to normalize RT-qPCR data. Data are presented as means ± S.E.M. D. In-situ hybridization with digoxigenin-labeled Sned1 sense riboprobe (negative control) or antisense riboprobe of sagittal sections from Sned1WT/WT, Sned1WT/-, or Sned1−/− E18.5 mouse embryos. Scale bar represents 100 μm. c: costal cartilage.
Figure 3.
Figure 3.. Surviving Sned1 knockout mice present growth defects
A. Representative pictures of heterozygous (left) and knockout (right) 21-day-old mice illustrate the smaller size of surviving knockout mice. B. Dotplots represent the weight of 14-day-old pups of the LacZ-Neo transgenic line. Numbers of mice per genotype are indicated. Line represents average weight of the genotype group. Statistical analysis was performed using an unpaired t-test. C. Dotplots represent the weight of p0.5 neonates of the LacZ-Neo transgenic line. Numbers of mice per genotype are indicated. Line represents average weight of the genotype group. Statistical analysis was performed using an unpaired t-test. D. Dotplots represent the weight of 14-day-old pups of the null transgenic line. Numbers of mice per genotype are indicated. Line represents average weight of the genotype group. Statistical analysis was performed using an unpaired t-test. E-F. Dotplots represent the length of the humerus (E) and femur (F) of 19 adult (6-month-old) mice of the LacZ-Neo transgenic line. Numbers of mice per genotype are indicated. Line represents average weight of the genotype group. Statistical analysis was performed using an unpaired t-test.
Figure 4.
Figure 4.. Sned1 knockout results in craniofacial malformations
A-F. Examination of the skull of a cohort of 19 adult (6-month-old) of the LacZ-Neo transgenic line. A. μCT scans showing variation in skull morphology based upon genotype. Note the nasal bridge collapse in Sned1LacZ-Neo/LacZ-Neo mouse (arrow). B. Nasal (left panel) and frontal (right panel) suture length. Numbers of mice per genotype are indicated. Line represents average length of the genotype group. Statistical analysis was performed using an unpaired t-test. C. Scatterplot of PC1 and PC2 for variation in the mouse cranial morphology. Statistical analysis was performed using a one-way non-parametric Kruskal-Wallis ANOVA. D. Boxplot of cranial PC1 data by mouse genotype. Numbers of mice per genotype are indicated. Statistical analysis was performed using a Tukey’s HSD test. E. Wireframes depicting mouse cranium side (left) and top (right) views and variation of the shape as a function of genotypes. Grey dots represent the consensus cranium shape, black dots represent the shape depicted by minimum (upper panel; representative of most Sned1LacZ-Neo/LacZ-Neo mice) and maximum (lower panel; representative of most Sned1WT/WT and Sned1WT/LacZ-Neo mice) PC1 range. C: caudal; R: rostral. F. Occlusion and asymmetry assessment of the nasal cavity of adult mice. Arrow indicates occlusion and arrowheads indicate asymmetries. See also Supplementary Files 1–3. G. Occlusion and asymmetry assessment of the nasal cavity of 22 p0.5 neonates. Arrow indicates occlusion. See also Supplementary Files 4–6.
Figure 5.
Figure 5.. Sned1 knockout results in under-developed mandible
A. Representative litter of p0.5 neonates. Black arrows indicate the presence of milk the stomach of wild-type and heterozygous mice. Note the absence of milk in the stomach of Sned1LacZ-Neo/LacZ-Neo neonates. Blue arrow points to the tails of knockout neonates which fail to curl, perhaps related to the strong expression in tail-bud somites and mesoderm (Figure 6). B-D. Examination of the mandible of a cohort of 19 adult (6-month-old) global Sned1 knockout animals and control littermates. B. Scatterplot of PC1 and PC2 for variation in the mouse mandibular morphology. Statistical analysis was performed using a one-way non-parametric Kruskal-Wallis ANOVA. C. Boxplot of mandibular PC1 data by mouse genotype. Numbers of mice per genotype are indicated. Statistical analysis was performed using a Tukey’s HSD test. D. Wireframes depicting mouse mandible side view and variations as a function of genotypes. Grey dots represent the consensus cranium shape, and black dots represent the shape depicted by minimum (upper panel; representative of most Sned1WT/WT and Sned1WT/LacZ-Neo mice) and maximum (lower panel; representative of most Sned1LacZ-Neo/LacZ-Neo mice) PC1 range. E. Pictures of a p1.5 wild-type (left panel) and age-matched dead Sned1−/− (right panel) neonates showing the absence of the lower jaw in the knockout pup.
Figure 6.
Figure 6.. Patterns of expression of Sned1 gene during embryogenesis
A. Whole-mount β-galactosidase assay (LacZ staining) performed on heterozygous E11.5 Sned1WT/LacZ-Neo embryo. B. Sagittal section of the head region of LacZ-stained E11.5 LacZ Sned1WT/LacZ-Neo embryo. 1, 2, 3, and 4 represent the branchial arches; NP: nasal process; RP: Rathke’s pouch. C. Sagittal sections of LacZ-stained E11.5 LacZ Sned1WT/LacZ-Neo embryo (left panel: lateral section; right panel: across the midline). Lu B, lung bud; So, somites; DRG, dorsal root ganglia. D. Whole-mount β-galactosidase assay (LacZ staining) performed on heterozygous E13.5 Sned1WT/LacZ-Neo embryo. E. Transverse section of the head region of LacZ-stained E13.5 LacZ Sned1WT/LacZ-Neo embryo. DRG, dorsal root ganglia; Hu: humerus; MC: site of apposition in the midline of Meckel’s cartilages; NS, cartilage primordium of nasal septum; Sc: blade of scapula; T, tongue; VO, vomeronasal organ. F. Section of paw from LacZ-stained E13.5 LacZ Sned1WT/LacZ-Neo embryo. Arrows indicate interdigital spaces. G. Sagittal sections of Lac-Z-stained E13.5 LacZ Sned1WT/LacZ-Neo embryo (from left to right: lateral to the midline). CP, choroid plexus; DRG, dorsal root ganglia; FL, forelimb; HL, hindlimb; NS, cartilage primordium of nasal septum; T, tongue; V, cartilage primordium of the vertebrae.
Figure 7.
Figure 7.. NCC-specific Sned1 knockout results in craniofacial malformations
A. PCR genotyping of genomic DNA isolated from tail samples of Sned1WT/NCC- mice. B. Dotplots represent the weight of one-month-old mice of the Sned1NCC- transgenic line. Numbers of mice per genotype are indicated. Lines represent the average weight of the genotype group. Statistical analysis was performed using an unpaired t-test. C. Representative pictures of 9-month-old control (Sned1fl/fl, left panels) and knockout (Sned1NCC-/NCC, right panels) mice. D. μCT scans of 9-month-old mice show examples of variation in skull morphology based upon genotype. E-I. Examination of the skull of a cohort of 30 adult (7 to 15-month-old) mice of the Sned1NCC- transgenic line. E. Nasal suture length. Numbers of mice per genotype are indicated. Lines represent average length of the genotype group. Statistical analysis was performed using an unpaired t-test. F. Scatterplot of PC2 and PC3 for variation in the mouse cranial morphology of the Sned1NCC- transgenic line. Statistical analysis was performed using a one-way non-parametric Kruskal-Wallis ANOVA. G. Boxplot of cranial PC2 data by mouse genotype. Numbers of mice per genotype are indicated. Statistical analysis was performed using a Tukey’s HSD test. H. Wireframes depicting mouse cranium side (left) and top (right) views and variation of the shape as a function of genotypes. Grey dots represent the consensus cranium shape, black dots represent the shape depicted by minimum (upper panel; representative of most Sned1NCC-/NCC- mice) and maximum (lower panel; representative of most Sned1WT/fl, Sned1fl/fl and Sned1WT/NCC- mice) PC2 range. C: caudal; R: rostral. I. Occlusion and asymmetry assessment of the nasal cavity. Arrowhead indicates asymmetry. See also Supplementary Files 7–10.
Figure 8.
Figure 8.. NCC-specific Sned1 knockout results in under-developed mandible
A-C. Examination of the mandible of a cohort of 30 adult (7 to 15-month old) mice of the Sned1NCC- transgenic line. A. Scatterplot of PC1 and PC3 for variation in the mouse mandibular morphology. Statistical analysis was performed using a one-way non-parametric Kruskal-Wallis ANOVA. B. Boxplot of mandibular PC1 data by mouse genotype. Numbers of mice per genotype are indicated. Statistical analysis was performed using a Tukey’s HSD test. C. Wireframes depicting mouse mandible side view and variations as a function of genotypes. Grey dots represent the consensus cranium shape, and black dots represent the shape depicted by minimum (upper panel; representative of most Sned1WT/fl, Sned1fl/fl and Sned1WT/NCC- mice) and maximum (lower panel; representative of most Sned1NCC-/NCC- mice) PC1 range.
Figure 9.
Figure 9.. Map of 2q37.3 deletions in two patients with facial dysmorphic features
A. Schematic representation of the human 2q37 chromosome region (dark blue box) showing two patients carrying a terminal deletion that includes the SNED1 locus (highlighted in light blue) but not HDAC4. Deleted regions are indicated by horizontal black bars and gray bar indicates duplicated region in patient 14 from the Leroy at al, 2013 study. Source: UCSC genome browser: http://genome.ucsc.edu, GRCh38/hg38 Assembly. B. Clinical features of two patients with 2q37.3 deletion including SNED1 but not HDAC4.

References

    1. Hynes RO, Naba A. Overview of the matrisome - An inventory of extracellular matrix constituents and functions. Cold Spring Harb Perspect Biol. 2012;4(1):a004903. doi:10.1101/cshperspect.a004903 - DOI - PMC - PubMed
    1. Rozario T, DeSimone DW. The Extracellular Matrix In Development and Morphogenesis: A Dynamic View. Dev Biol. 2010;341(1):126–140. doi:10.1016/j.ydbio.2009.10.026 - DOI - PMC - PubMed
    1. Bonnans C, Chou J, Werb Z. Remodelling the extracellular matrix in development and disease. Nat Rev Mol Cell Biol. 2014;15(12):786–801. doi:10.1038/nrm3904 - DOI - PMC - PubMed
    1. Bateman JF, Boot-Handford RP, Lamandé SR. Genetic diseases of connective tissues: cellular and extracellular effects of ECM mutations. Nat Rev Genet. 2009;10(3):173–183. doi:10.1038/nrg2520 - DOI - PubMed
    1. Naba A, Clauser KR, Lamar JM, Carr SA, Hynes RO. Extracellular matrix signatures of human mammary carcinoma identify novel metastasis promoters. eLife. 2014;3. doi:10.7554/eLife.01308 - DOI - PMC - PubMed

Publication types

Substances