

SARS-CoV-2 outbreak investigation in a German meat processing plant
- PMID: 33012091
- PMCID: PMC7646008
- DOI: 10.15252/emmm.202013296
SARS-CoV-2 outbreak investigation in a German meat processing plant
Abstract
We describe a multifactorial investigation of a SARS-CoV-2 outbreak in a large meat processing complex in Germany. Infection event timing, spatial, climate and ventilation conditions in the processing plant, sharing of living quarters and transport, and viral genome sequences were analyzed. Our results suggest that a single index case transmitted SARS-CoV-2 to co-workers over distances of more than 8 m, within a confined work area in which air is constantly recirculated and cooled. Viral genome sequencing shows that all cases share a set of mutations representing a novel sub-branch in the SARS-CoV-2 C20 clade. We identified the same set of mutations in samples collected in the time period between this initial infection cluster and a subsequent outbreak within the same factory, with the largest number of confirmed SARS-CoV-2 cases in a German meat processing facility reported so far. Our results indicate climate conditions, fresh air exchange rates, and airflow as factors that can promote efficient spread of SARS-CoV-2 via long distances and provide insights into possible requirements for pandemic mitigation strategies in industrial workplace settings.
Keywords: SARS-CoV-2 super spreading event; aerosol transmission; meat processing plant outbreak; viral genome sequencing.
© 2020 The Authors Published under the terms of the CC BY 4.0 license.
Conflict of interest statement
The authors declare that they have no conflict of interest.
Figures
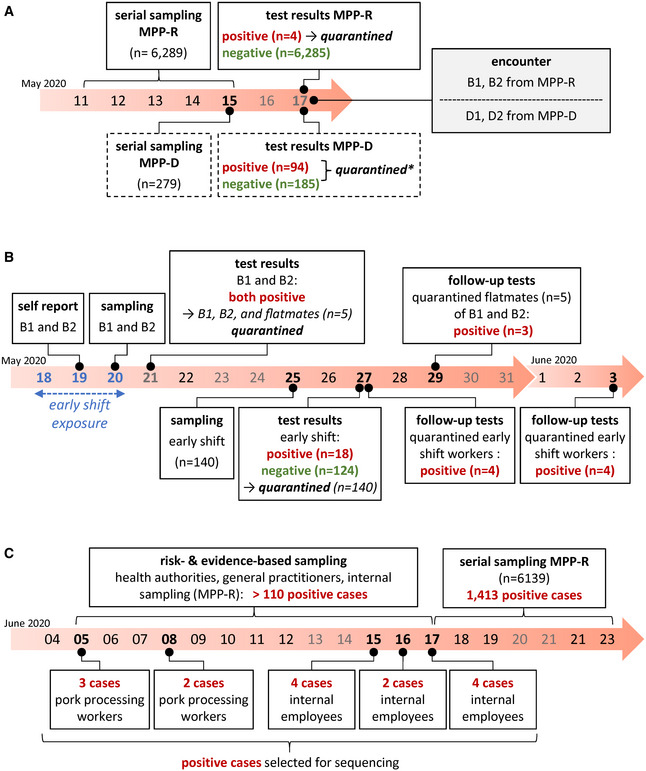
- A
Series of events in MPP‐R and MPP‐D (boxes with solid and dashed outline, respectively) preceding the outbreak in MPP‐R. The encounter between MPP‐R and MPP‐D workers which may have initiated the outbreak in MPP‐R is shown in the gray box to the right. * quarantine in MPP‐D involved all positive cases (n = 94) as well as those among the 185 workers with negative test results who had been directly employed in meat processing. Negatively tested employees with other roles (e.g., administrative or security staff) were not quarantined.
- B
Events in MPP‐R during the outbreak in late May. The three consecutive days during which the index case B1 worked in the early shift and thus the time period during which work‐related exposure may have occurred is highlighted in blue.
- C
Events in MPP‐R during June. Risk‐ and evidence‐based sampling during early June was performed by health authorities, general practitioners, as well as the internal test center from MPP‐R. While we do not have exact information regarding the total number of positive cases for this time period, we have indicated a minimum incidence number above the timeline (110) based on publicly available reports from the local health authorities (
https://www.kreis-guetersloh.de/aktuelles/corona/pressemitteilungen-coronavirus/ ). Boxes below the timeline mark positive cases from internal MPP‐R testing that were subjected to viral genotyping. Cases designated as pork processing workers were directly associated with meat processing (deboning, shearing, packaging), while internal employees denote individuals working in areas such as the convenience food section, technical operation, or occupational safety.
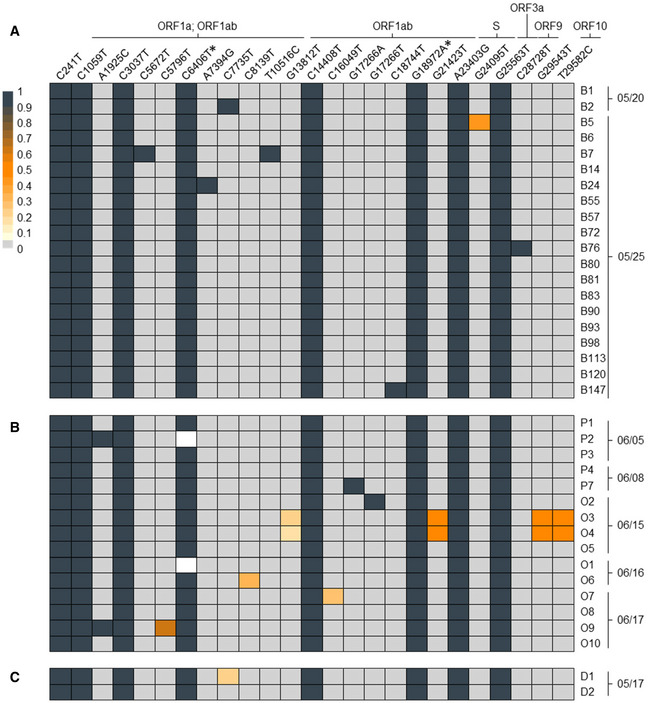
- A–C
The heat map shows the position (left to right), identity (top row), and frequency (color code) of variant nucleotide positions detected by SARS‐CoV-2 full genome amplicon sequencing in (A) 20 samples of MPP‐R workers tested positive on May 20 or 25, (B) 15 samples of MPP‐R workers tested positive between June 5 and 17, and (C) two workers from MPP‐D who may have transmitted the virus to cases B1 and/or B2. Individual collection dates are shown to the right of each sample. Variant sequences are given relative to the Wuhan reference strain NC_045512. The two silent mutations which define the prototype of the investigated outbreak are marked with an asterisk. Frequencies below 100% mean that only a fraction of viral genomes shows nucleotide variations, indicating the presence of viral intra‐host sub‐populations. White rectangles denote nucleotide positions which were not covered by amplicon‐seq reads within the respective sample. For nucleotide positions in coding regions, the corresponding viral ORF(s) are shown above the variant position. Variants without such information are located in non‐coding regions. Absolute values for variant frequencies and amino acid changes associated with nucleotide variants, along with identifiers of entries which were submitted to GISAID are provided in Appendix Table S1.
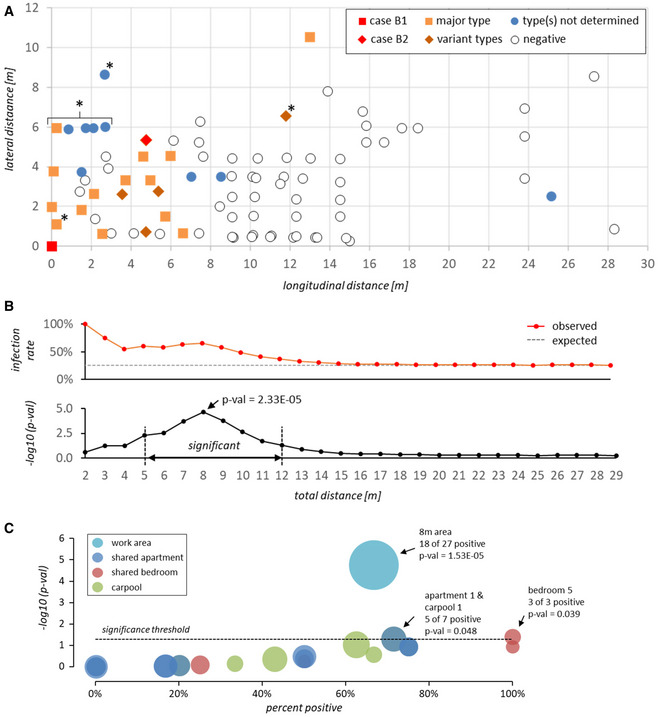
- A
Distance (in meters) of PCR‐tested workers from the suspected index case B1 at the workplace. For workers without fixed position in the beef processing plant (marked with an asterisk), coordinates indicate estimated average location during the early shift. Squares and diamonds denote prototype or variant SARS‐CoV-2 genotypes, respectively. Filled blue circles denote cases for which viral genomes were not sequenced (i.e., workers tested positive after 5/25/2020). Positive test dates and genotypes are given in Appendix Table S1.
- B
Top panel: Observed accumulated percentage of positive cases (red line) within the indicated distance from the suspected index case. The gray dashed line shows the average infection rate that would be expected for a random spatial distribution of positive cases. Bottom panel: −log10 P‐value for the frequency of accumulated positive cases within the given distance being significantly higher than expected based on a random spatial distribution of positive cases (see Materials and Methods and Appendix Table S2 for numeric values and further information on P‐value calculation). Only employees with fixed work positions were included in the calculation.
- C
Values on the x‐axis show infection rates among members of shared apartments, bedrooms, or carpools. Values on the y‐axis reflect −log10 P‐values for the hypothesis that the infection rate within a given unit is higher than expected based on a random distribution of positive cases among all workers sharing one or more unit (see Materials and Methods and Appendix Table S3 for numeric values and further information on P‐value calculation). Infection rates and P‐values associated with the 8 m work area around the index case (see panels A and B) are shown for comparison. Bubble sizes indicate the total number of individuals within each unit or area. All data points with significant P‐values (≤ 0.05) are labeled with unit or area id, positive and total number of associated individuals, and P‐value.
References
-
- Dyal JW, Grant MP, Broadwater K, Bjork A, Waltenburg MA, Gibbins JD, Hale C, Silver M, Fischer M, Steinberg J et al (2020) COVID‐19 among workers in meat and poultry processing facilities – 19 States, April 2020. MMWR Morb Mortal Wkly Rep 69: 557–561 - PubMed
Publication types
MeSH terms
Substances
Grants and funding
LinkOut - more resources
Full Text Sources
Medical
Miscellaneous
