. 2020 Nov;113(11):444-453.
doi: 10.1177/0141076820962447. Epub 2020 Oct 4.

Impact of COVID-19 on accident and emergency attendances and emergency and planned hospital admissions in Scotland: an interrupted time-series analysis

Affiliations

Impact of COVID-19 on accident and emergency attendances and emergency and planned hospital admissions in Scotland: an interrupted time-series analysis

Rachel H Mulholland et al. J R Soc Med. 2020 Nov.

Abstract

Objectives: Following the outbreak of the severe acute respiratory syndrome coronavirus 2 (SARS-CoV-2) virus and the subsequent global spread of the 2019 novel coronavirus disease (COVID-19), health systems and the populations who use them have faced unprecedented challenges. We aimed to measure the impact of COVID-19 on the uptake of hospital-based care at a national level.

Design: The study period (weeks ending 5 January to 28 June 2020) encompassed the pandemic announcement by the World Health Organization and the initiation of the UK lockdown. We undertook an interrupted time-series analysis to evaluate the impact of these events on hospital services at a national level and across demographics, clinical specialties and National Health Service Health Boards.

Setting: Scotland, UK.

Participants: Patients receiving hospital care from National Health Service Scotland.

Main outcome measures: Accident and emergency (A&E) attendances, and emergency and planned hospital admissions measured using the relative change of weekly counts in 2020 to the averaged counts for equivalent weeks in 2018 and 2019.

Results: Before the pandemic announcement, the uptake of hospital care was largely consistent with historical levels. This was followed by sharp drops in all outcomes until UK lockdown, where activity began to steadily increase. This time-period saw an average reduction of -40.7% (95% confidence interval [CI]: -47.7 to -33.7) in A&E attendances, -25.8% (95% CI: -31.1 to -20.4) in emergency hospital admissions and -60.9% (95% CI: -66.1 to -55.7) in planned hospital admissions, in comparison to the 2018-2019 averages. All subgroup trends were broadly consistent within outcomes, but with notable variations across age groups, specialties and geography.

Conclusions: COVID-19 has had a profoundly disruptive impact on hospital-based care across National Health Service Scotland. This has likely led to an adverse effect on non-COVID-19-related illnesses, increasing the possibility of potentially avoidable morbidity and mortality. Further research is required to elucidate these impacts.

Keywords: A&E attendances; COVID-19; SARS-CoV-2; hospital admissions; secondary care; uptake.


Conflict of interest statement

Competing Interests: AS is a member of the Editorial Board of the Journal of Royal Society of Medicine and a member of the Scottish Government’s COVID-19 Chief Medical Officer’s Advisory Group. CRS reports grants from the UK National Institute for Health Research, Medical Research Council and New Zealand Health Research Council, and The Ministry of Business, Innovation and Employment during the conduct of (and related to) the study. Remaining authors do not declare competing interests.

Figures

Figure 1.
Figure 1.
Timeline of time-periods and change-points. Before indicates weeks before pandemic announcement (weeks ending 5 January to 8 March 2020); Between indicates weeks between change-points (weeks ending 15 and 22 March 2020); After indicates weeks after UK lockdown (weeks ending 29 March to 28 June 2020).
Figure 2.
Figure 2.
Fitted lines of segmented regression models for A&E attendances and emergency and planned hospital admissions across Scotland. Points represent weekly percentage changes between 2020 and 2018–2019 average weeks ending 5 January to 28 June 2020 for A&E attendances, emergency and planned hospital admissions. Vertical lines represent change-point 1 (WHO announcing pandemic on 11 March) and change-point 2 (UK lockdown on 23 March). Horizontal line is the 2018–2019 average at 0. Fitted lines represent segmented regression models of the interaction between the number of days since 5 January and the two change-points for each outcome. Shaded areas around lines represent 95% confidence intervals.
Figure 3.
Figure 3.
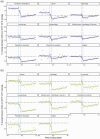
Fitted lines of segmented regression models by age group for (a) A&E attendances, (b) emergency and (c) planned hospital admissions. Points represent weekly percentage changes between 2020 and 2018–2019 average weeks ending 5 January to 28 June 2020 by age group for (a) A&E attendances, (b) emergency and (c) planned hospital admissions. Vertical lines represent change-point 1 (WHO announcing pandemic on 11 March) and change-point 2 (UK lockdown on 23 March). Horizontal line is the 2018–2019 average at 0. Fitted lines represent segmented regression models of the baseline model (the number of days since 5 January and the two change-points) and the interaction between age and the change-points for each outcome. Shaded areas around lines represent 95% confidence intervals.
Figure 4.
Figure 4.
Fitted lines of segmented regression models by specialty for (a) emergency and (b) planned hospital admissions. Points represent weekly percentage changes between 2020 and 2018–2019 average weeks ending 5 January to 28 June 2020 by specialty for (a) emergency and (b) planned hospital admissions. Vertical lines represent change-point 1 (WHO announcing pandemic on 11 March) and change-point 2 (UK lockdown on 23 March). Horizontal line is the 2018–2019 average at 0. Fitted lines represent segmented regression models of the baseline model (the number of days since 5 January and the two change-points) and the interaction between specialty and change-points for each outcome. Shaded areas around lines represent 95% confidence intervals.
Figure 5.
Figure 5.
Map of differences in mean percentage changes before pandemic announcement and after UK lockdown by NHS Scotland Health Board. The difference in the mean percentage changes before the pandemic announcement (weeks ending 5 January to 8 March 2020) and mean percentage changes after UK lockdown (weeks ending 29 March to 28 June 2020) for (a) A&E attendances, (b) emergency and (c) planned hospital admissions. Note: Orkney, Shetland and Western Isles excluded for planned hospital admissions due to small numbers. Forth Valley excluded for emergency and planned hospital admission due to data issues. Shapefile for map found on Scottish Government SpatialData.gov.scot (https://data.gov.uk/dataset/27d0fe5f-79bb-4116-aec9-a8e565ff756a/nhs-health-boards).

Comment in

Similar articles

Cited by

References

    1. Kelly E and Firth Z. The Health Foundation. How Is COVID-19 Changing the Use of Emergency Care? 15 May 2020. See https://www.health.org.uk/news-and-comment/charts-and-infographics/how-i... (last checked 30 June 2020).
    1. NHS England. A&E Attendances and Emergency Admissions. March 2020 Statistical Commentary. See https://www.england.nhs.uk/statistics/wp-content/uploads/sites/2/2020/04... (last checked 10 July 2020).
    1. Marijon E, Karam N, Jost D, Perrot D, Frattini B, Derkenne C, et al. Out-of-hospital cardiac arrest during the COVID-19 pandemic in Paris, France: a population-based, observational study. Lancet Public Health 2020. DOI: 10.1016/S2468-2667(20)30117-1. - PMC - PubMed
    1. Patriti A, Baiocchi GL, Catena F, Marini P, Catarci M. FACS on behalf of the Associazione Chirurghi Ospedalieri Italiani (ACOI). Emergency general surgery in Italy during the COVID-19 outbreak: first survey from the real life. World J Emerg Surg 2020; 15: article number 36–article number 36. - PMC - PubMed
    1. Metzler B, Siostrzonek P, Binder RK, Bauer A, Reinstadler SJ. Decline of acute coronary syndrome admissions in Austria since the outbreak of COVID-19: the pandemic response causes cardiac collateral damage. Eur Heart J 2020; 41: 19–19. 2020. - PMC - PubMed