

Excess Out-of-Hospital Mortality and Declining Oxygen Saturation: The Sentinel Role of Emergency Medical Services Data in the COVID-19 Crisis in Tijuana, Mexico
- PMID: 33012377
- PMCID: PMC7377712
- DOI: 10.1016/j.annemergmed.2020.07.035
Excess Out-of-Hospital Mortality and Declining Oxygen Saturation: The Sentinel Role of Emergency Medical Services Data in the COVID-19 Crisis in Tijuana, Mexico
Abstract
Study objective: Emergency medical services (EMS) may serve as a key source of real-time data about the evolving health of coronavirus disease 2019 (COVID-19)-affected populations, especially in low- and middle-income countries with less rapid and reliable vital statistics registration systems. Although official COVID-19 statistics in Mexico report almost exclusively inhospital mortality events, excess out-of-hospital mortality has been identified in other countries, including 1 EMS study in Italy that showed a 58% increase. Additionally, EMS and hospital reports from several countries have suggested that silent hypoxemia-low Spo2 in the absence of dyspnea-is associated with COVID-19. It is unclear, however, how these phenomena can be generalized to low- and middle-income countries. We assess how EMS data can be used in a sentinel capacity in Tijuana, a city on the Mexico-United States border with earlier exposure to COVID-19 than many low- and middle-income country settings.
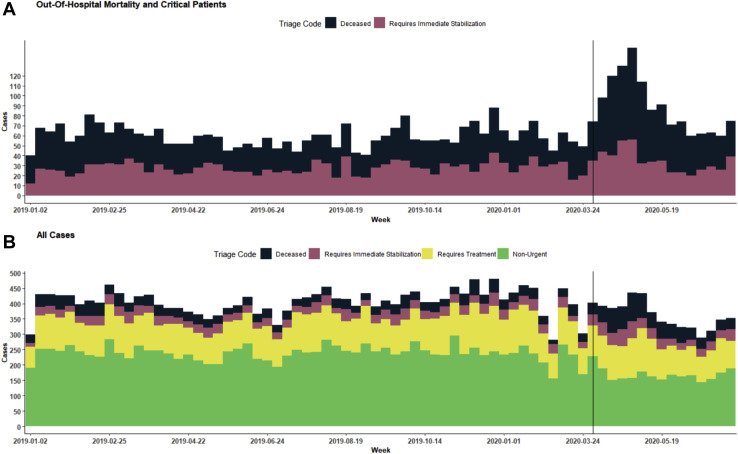
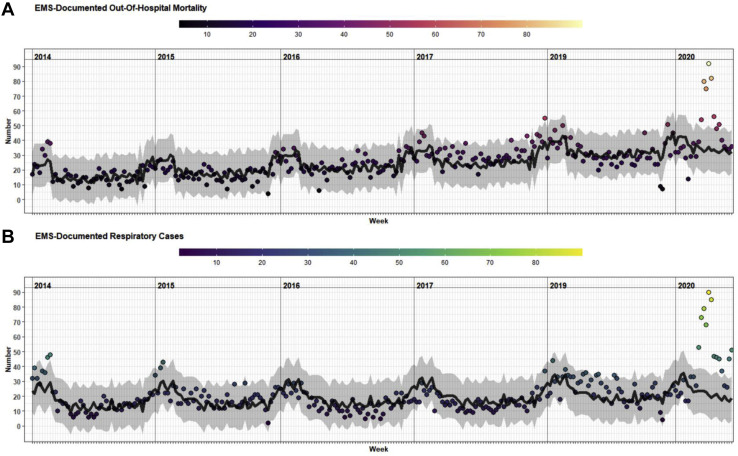
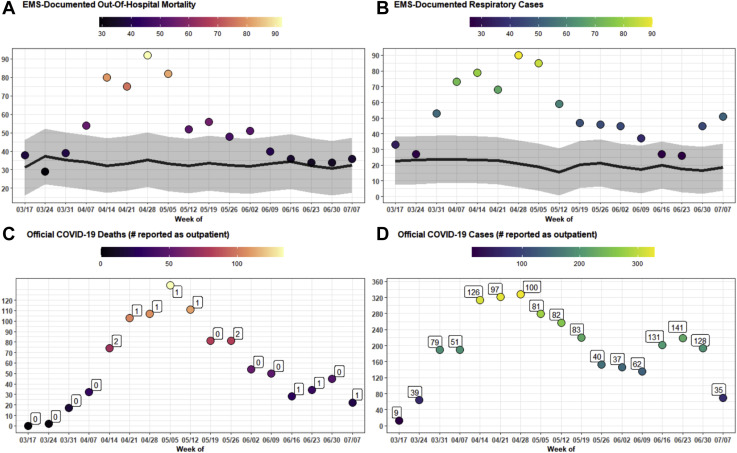
Methods: In this observational study, we calculated numbers of weekly out-of-hospital deaths and respiratory cases handled by EMS in Tijuana, and estimated the difference between peak epidemic rates and expected trends based on data from 2014 to 2019. Results were compared with official COVID-19 statistics, stratified by neighborhood socioeconomic status, and examined for changing demographic or clinical features, including mean Spo2.
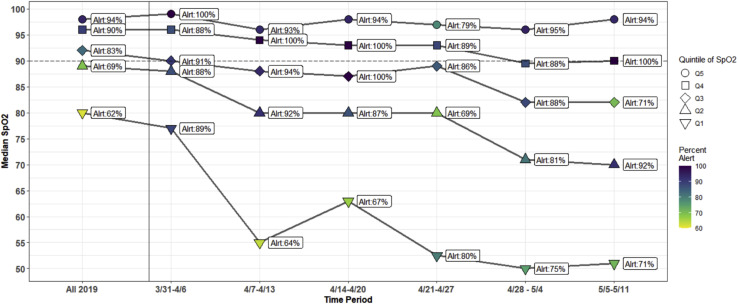
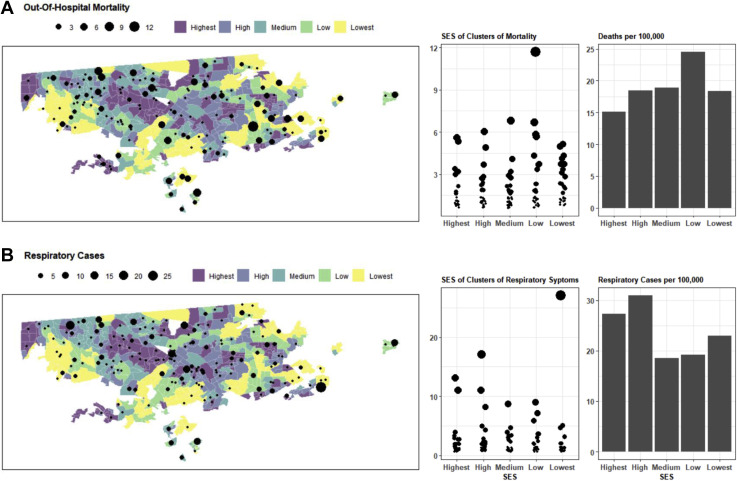
Results: An estimated 194.7 excess out-of-hospital deaths (95% confidence interval 135.5 to 253.9 deaths) occurred during the peak window (April 14 to May 11), representing an increase of 145% (95% CI 70% to 338%) compared with expected levels. During the same window, only 5 COVID-19-related out-of-hospital deaths were reported in official statistics. This corresponded with an increase in respiratory cases of 236.5% (95% CI 100.7% to 940.0%) and a decrease in mean Spo2 to 77.7% from 90.2% at baseline. The highest out-of-hospital death rates were observed in low-socioeconomic-status areas, although respiratory cases were more concentrated in high-socioeconomic-status areas.
Conclusion: EMS systems may play an important sentinel role in monitoring excess out-of-hospital mortality and other trends during the COVID-19 crisis in low- and middle-income countries. Using EMS data, we observed increases in out-of-hospital deaths in Tijuana that were nearly 3-fold greater than increases reported in EMS data in Italy. Increased testing in out-of-hospital settings may be required to determine whether excess mortality is being driven by COVID-19 infection, health system saturation, or patient avoidance of health care. We also found evidence of worsening rates of hypoxemia among respiratory patients treated by EMS, suggesting a possible increase in silent hypoxemia, which should be met with increased detection and clinical management efforts. Finally, we observed social disparities in out-of-hospital death that warrant monitoring and amelioration.
Copyright © 2020 American College of Emergency Physicians. Published by Elsevier Inc. All rights reserved.
Figures
Update of
-
Excess Out-Of-Hospital Mortality and Declining Oxygen Saturation: The Sentinel Role of EMS Data in the COVID-19 Crisis in Tijuana, Mexico.medRxiv [Preprint]. 2020 May 18:2020.05.13.20098186. doi: 10.1101/2020.05.13.20098186. medRxiv. 2020. Update in: Ann Emerg Med. 2020 Oct;76(4):413-426. doi: 10.1016/j.annemergmed.2020.07.035. PMID: 32511518 Free PMC article. Updated. Preprint.
References
-
- Danel I. An assessment of LAC’s vital statistics system: the foundation of maternal and infant mortality monitoring. http://documents.worldbank.org/curated/en/206651468177844686/pdf/448620W... Available at:
-
- Civil Registration and Vital Statistics Knowledge Center Estimating census and death registration completeness (census completeness, death registration coverage) https://unstats.un.org/unsd/vitalstatkb/KnowledgebaseArticle50331.aspx Available at:
-
- Mikkelsen L., Phillips D.E., AbouZahr C. A global assessment of civil registration and vital statistics systems: monitoring data quality and progress. Lancet. 2015;386:1395–1406. - PubMed
-
- Híjar M., Chandran A., Pérez-Núñez R. Quantifying the underestimated burden of road traffic mortality in Mexico: a comparison of three approaches. Traffic Inj Prev. 2012;13(suppl 1):5–10. - PubMed
Publication types
MeSH terms
Grants and funding
LinkOut - more resources
Full Text Sources
Medical
Miscellaneous
