

Development and Validation of the Quick COVID-19 Severity Index: A Prognostic Tool for Early Clinical Decompensation
- PMID: 33012378
- PMCID: PMC7373004
- DOI: 10.1016/j.annemergmed.2020.07.022
Development and Validation of the Quick COVID-19 Severity Index: A Prognostic Tool for Early Clinical Decompensation
Abstract
Study objective: The goal of this study is to create a predictive, interpretable model of early hospital respiratory failure among emergency department (ED) patients admitted with coronavirus disease 2019 (COVID-19).
Methods: This was an observational, retrospective, cohort study from a 9-ED health system of admitted adult patients with severe acute respiratory syndrome coronavirus 2 (COVID-19) and an oxygen requirement less than or equal to 6 L/min. We sought to predict respiratory failure within 24 hours of admission as defined by oxygen requirement of greater than 10 L/min by low-flow device, high-flow device, noninvasive or invasive ventilation, or death. Predictive models were compared with the Elixhauser Comorbidity Index, quick Sequential [Sepsis-related] Organ Failure Assessment, and the CURB-65 pneumonia severity score.
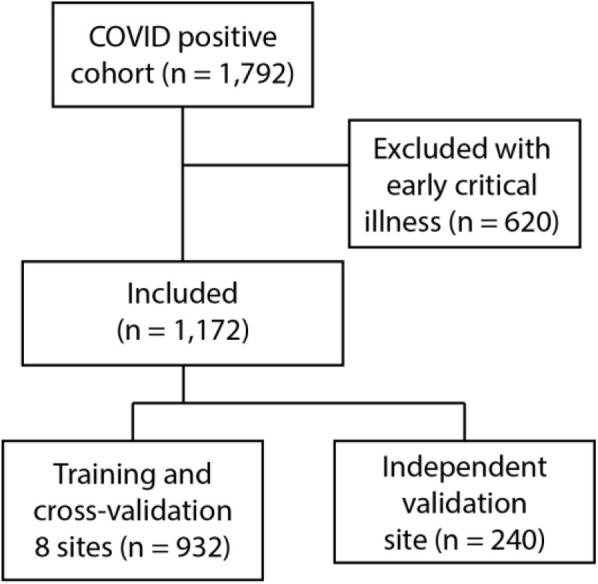
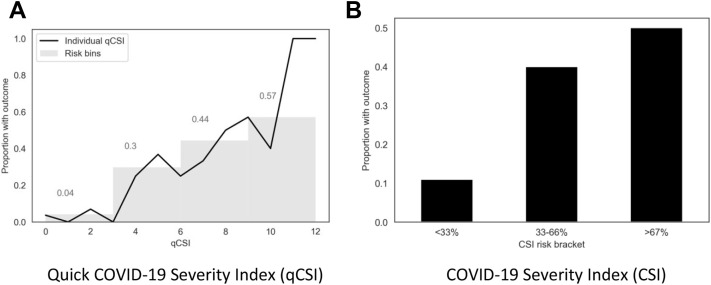
Results: During the study period, from March 1 to April 27, 2020, 1,792 patients were admitted with COVID-19, 620 (35%) of whom had respiratory failure in the ED. Of the remaining 1,172 admitted patients, 144 (12.3%) met the composite endpoint within the first 24 hours of hospitalization. On the independent test cohort, both a novel bedside scoring system, the quick COVID-19 Severity Index (area under receiver operating characteristic curve mean 0.81 [95% confidence interval {CI} 0.73 to 0.89]), and a machine-learning model, the COVID-19 Severity Index (mean 0.76 [95% CI 0.65 to 0.86]), outperformed the Elixhauser mortality index (mean 0.61 [95% CI 0.51 to 0.70]), CURB-65 (0.50 [95% CI 0.40 to 0.60]), and quick Sequential [Sepsis-related] Organ Failure Assessment (0.59 [95% CI 0.50 to 0.68]). A low quick COVID-19 Severity Index score was associated with a less than 5% risk of respiratory decompensation in the validation cohort.
Conclusion: A significant proportion of admitted COVID-19 patients progress to respiratory failure within 24 hours of admission. These events are accurately predicted with bedside respiratory examination findings within a simple scoring system.
Copyright © 2020 American College of Emergency Physicians. Published by Elsevier Inc. All rights reserved.
Figures
Comment in
-
In adults hospitalized with COVID-19, the quick COVID-19 Severity Index predicted 24-h respiratory decompensation.Ann Intern Med. 2021 Feb;174(2):JC23. doi: 10.7326/ACPJ202102160-023. Epub 2021 Feb 2. Ann Intern Med. 2021. PMID: 33524288
References
-
- World Health Organization Novel coronavirus (2019-nCoV) situation reports; 2020. https://www.who.int/emergencies/diseases/novel-coronavirus-2019/situatio... Available at:
-
- CDC U Coronavirus disease 2019 (COVID-19) cases in US; 2020. https://www.cdc.gov/coronavirus/2019-ncov/cases-updates/cases-in-us.html Available at:
-
- Haimovich A., Warner F., Young H.P. Patient factors associated with SARS-CoV-2 in an admitted emergency department population. https://onlinelibrary.wiley.com/doi/abs/ 10.1002/emp2.12145 Available at: - PMC - PubMed
-
- Chan P.S., Jain R., Nallmothu B.K. Rapid response teams: a systematic review and meta- analysis. Arch Intern Med. 2010;170:18–26. - PubMed
Publication types
MeSH terms
Grants and funding
LinkOut - more resources
Full Text Sources
Medical
Miscellaneous
