. 2021 Jan;124(2):437-446.
doi: 10.1038/s41416-020-01102-1. Epub 2020 Oct 5.

Clinically and biologically relevant subgroups of Wilms tumour defined by genomic and epigenomic analyses

Affiliations

Clinically and biologically relevant subgroups of Wilms tumour defined by genomic and epigenomic analyses

Jack Brzezinski et al. Br J Cancer. 2021 Jan.

Abstract

Background: Although cure rates for Wilms tumours (WT) are high, many patients receive therapy with attendant long-term complications. Our goal was to stratify WT using genome-wide analyses to identify candidate molecular features for patients who would benefit from a reduction in therapy.

Methods: We generated DNA methylation and exome sequencing data on WT-kidney pairs (n = 57) and unpaired tumours (n = 27) collected either at our centre or by the Children's Oncology Group. Samples were divided into a discovery set (n = 32) and validation set (n = 52).

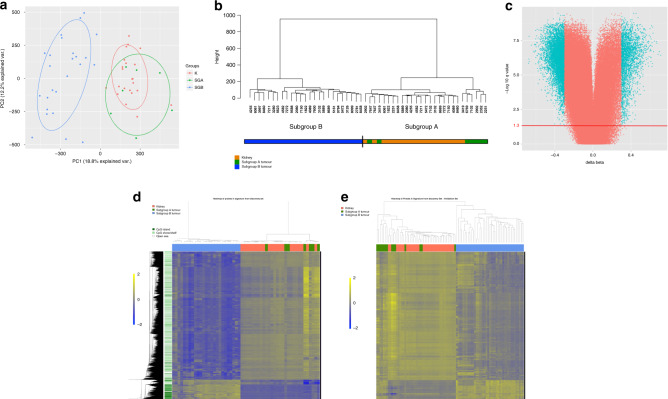
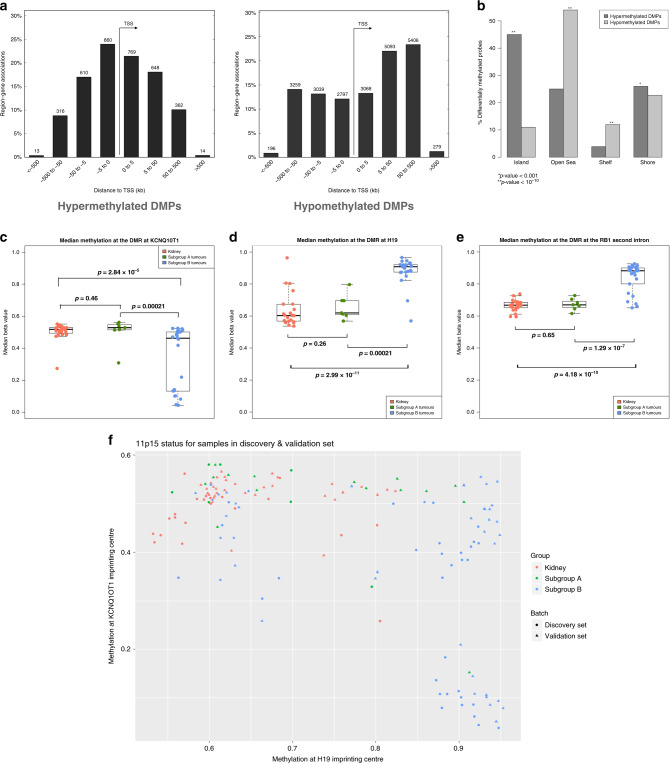
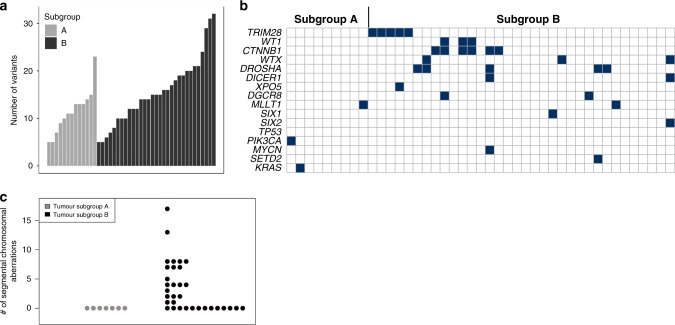
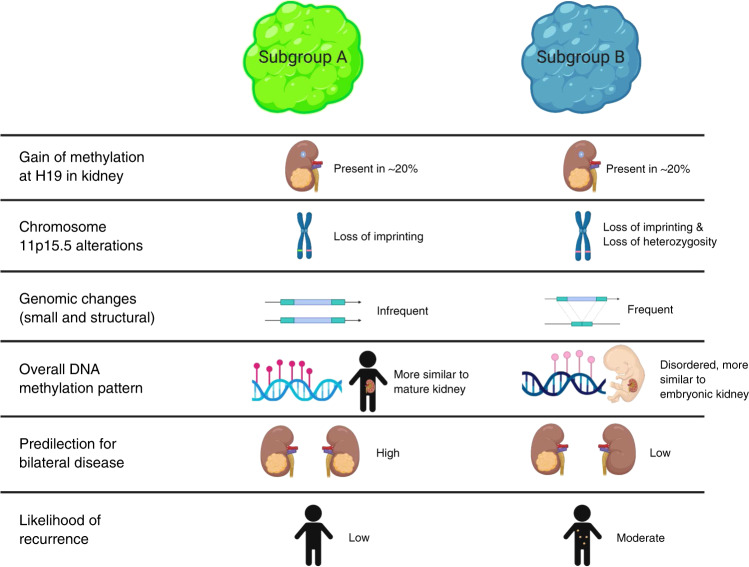
Results: Analysis of DNA methylation revealed two subgroups of WT with distinct features. Subgroup A has a similar DNA methylation profile to mature kidney, while Subgroup B has genome-wide dysregulation of DNA methylation. The rate of non-synonymous missense mutations and segmental chromosomal aberrations was higher in Subgroup B tumours, suggesting that this group has genome instability related to its epigenetic state. Subgroup A had a higher proportion of cases of bilateral disease. Tumours with high-risk histology or from patients who relapsed were only found in Subgroup B.

Conclusion: We have identified subgroup-specific molecular events that could inform future work supporting more targeted therapeutic approaches and patient stratification. We propose a novel developmental tumour model based on these findings.


Conflict of interest statement

The authors declare no competing interests.

Figures

Fig. 1
Fig. 1. Clustering of tumour and kidney samples into two subgroups.
a Principal component analysis of all tumour and kidney samples in the discovery set. First two principal components account for 31% of the variance in all probes on the 450K array. b Unsupervised hierarchical clustering of all tumour and kidney samples in the discovery set utilising data from all probes on the 450K array that passed QI steps. Distances are calculated on Euclidean coordinates and relationships are determined by Ward’s minimum variance method. c Volcano plot showing methylation difference between Subgroup B tumours and Subgroup A tumours at each CpG probe (Subgroup B–Subgroup A). Probes with FDR-corrected p values ≤0.05 (−log 10 q value = 1.3—red line) and a difference in methylation (beta value) ≥0.3 are coloured blue. d Heatmap of significantly different CpGs between Subgroup B tumours and Subgroup A tumours for all tumour and kidney samples in the discovery set. Each row represents a differentially methylated probe and each column represents a sample. Distances calculated on Euclidean coordinates and relationships are represented by the UPGMA average linkage method. Regional CpG density is annotated for each probe. Beta values are mean-centred. e Heatmap of the significantly different CpGs defined in the discovery set (c, d) for all tumours and kidneys in the validation set. Each row represents a differentially methylated probe and each column represents a sample. Distances calculated on Euclidean coordinates and relationships are determined by the UPGMA average linkage method. Beta values are mean-centred.
Fig. 2
Fig. 2. Characteristics of differentially methylated probes and imprinting control regions in Wilms tumour subgroups.
a Relationship of differentially methylated probes (DMPs) between Subgroup B tumours and Subgroup A tumours to the transition start site (TSS) of the nearest gene. Left: DMPs hypermethylated in Subgroup B. Right: DMPs hypomethylated in Subgroup B. b Relationship of DMPs to CpG Islands. P values calculated by hypergeometric test compared to what would be expected by chance if probes were randomly sampled from all those represented on the array. c–e DNA methylation at selected imprinting control regions for all kidney and tumour samples in the discovery set. Each dot represents the median beta value for each sample at all probes within the imprinting control region. P values between groups of samples are calculated by two-tailed t tests. For each boxplot, the central line represents the median. The box extends to the 1st and 3rd quartiles of the data and the whiskers extend to the furthest data point within 1.5 times the length of the box. c KCNQ1OT1 imprinting control region (chromosome 11p15.5). d H19 imprinting control region (chromosome 11p15.5). e RB1 imprinting control region (chromosome 13q14.2). f Mean DNA methylation at the H19 and KCNQ1OT1 imprinting control region at chromosome 11p15.5 for each sample.
Fig. 3
Fig. 3. Patterns of genomic variants in tumours in each subgroup.
a Number of small non-synonymous exonic variants in each tumour sample in the validation set analysed by whole-exome sequencing. b Pathogenic variants in selected Wilms tumour-related genes in the validation set analysed by whole-exome sequencing. Each column represents one tumour. Black boxes indicate a pathogenic mutation in the denoted gene in that tumour. c Number of segmental chromosomal aberrations per tumour sample in the discovery set.
Fig. 4
Fig. 4
Summary of the similarities and differences between Subgroup A tumours and Subgroup B tumours.

Similar articles

Cited by

References

    1. Dome JS, Graf N, Geller JI, Fernandez CV, Mullen EA, Spreafico F, et al. Advances in Wilms tumor treatment and biology: progress through international collaboration. J. Clin. Oncol. 2015;33:2999–3007. doi: 10.1200/JCO.2015.62.1888. - DOI - PMC - PubMed
    1. Gratias EJ, Dome JS, Jennings LJ, Chi Y-Y, Tian J, Anderson J, et al. Association of chromosome 1q gain with inferior survival in favorable-histology Wilms tumor: a report from the Children’s Oncology Group. J. Clin. Oncol. 2016;34:3189–3194. doi: 10.1200/JCO.2015.66.1140. - DOI - PMC - PubMed
    1. Chagtai T, Zill C, Dainese L, Wegert J, Savola S, Popov S, et al. Gain of 1q as a prognostic biomarker in Wilms tumors (WTs) treated with preoperative chemotherapy in the International Society of Paediatric Oncology (SIOP) WT 2001 Trial: a SIOP Renal Tumours Biology Consortium Study. J. Clin. Oncol. 2016;34:3195–3203. doi: 10.1200/JCO.2015.66.0001. - DOI - PMC - PubMed
    1. Fernandez CV, Perlman EJ, Mullen EA, Chi Y-Y, Hamilton TE, Gow KW, et al. Clinical outcome and biological predictors of relapse after nephrectomy only for very low-risk Wilms tumor: a report from Children’s Oncology Group AREN0532. Ann. Surg. 2016;265:835–840. doi: 10.1097/SLA.0000000000001716. - DOI - PMC - PubMed
    1. Wegert J, Ishaque N, Vardapour R, Geörg C, Gu Z, Bieg M, et al. Mutations in the SIX1/2 pathway and the DROSHA/DGCR8 miRNA microprocessor complex underlie high-risk blastemal type Wilms tumors. Cancer Cell. 2015;27:298–311. doi: 10.1016/j.ccell.2015.01.002. - DOI - PubMed

Publication types