

doi: 10.1063/5.0021842.
Enhancing sensitivity of lateral flow assay with application to SARS-CoV-2
Affiliations
- PMID: 33012808
- PMCID: PMC7518548
- DOI: 10.1063/5.0021842
Item in Clipboard
Enhancing sensitivity of lateral flow assay with application to SARS-CoV-2
Appl Phys Lett.
.
Abstract
Lateral flow assay (LFA) has long been used as a biomarker detection technique. It has advantages such as low cost, rapid readout, portability, and ease of use. However, its qualitative readout process and lack of sensitivity are limiting factors. We report a photon-counting approach to accurately quantify LFAs while enhancing sensitivity. In particular, we demonstrate that the density of SARS-CoV-2 antibodies can be quantified and measured with an enhanced sensitivity using this simple laser optical analysis.
Copyright © 2020 Author(s).
Figures
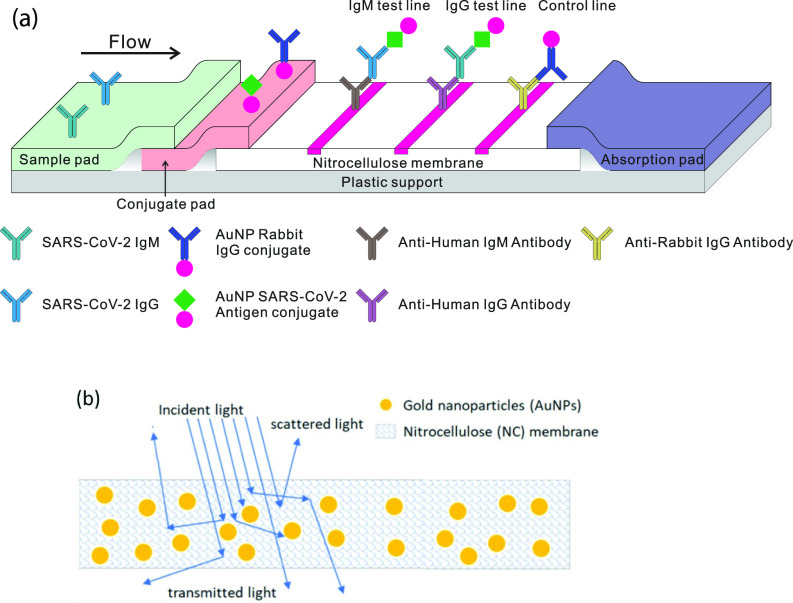
(a) Schematic illustration of a LFA showing the wicking membrane with AuNPs coated with SARS-CoV-2 spike protein. (b) Light scattering and absorption processes inside test strips with AuNPs (not to scale). The nitrocellulose membrane scatters light, and AuNPs absorb and scatter light.
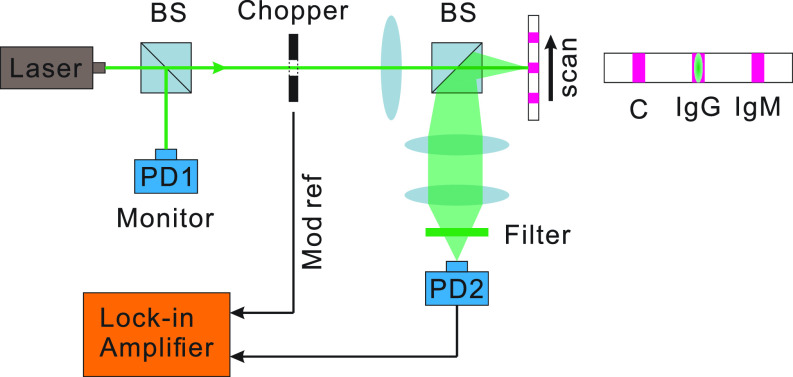
Schematic of the experiment. The 532 nm laser is split into two parts for the AuNP detection and laser power monitor. The laser vertically hits the test strip and is then collected by a photon detector through a two-lens image system.
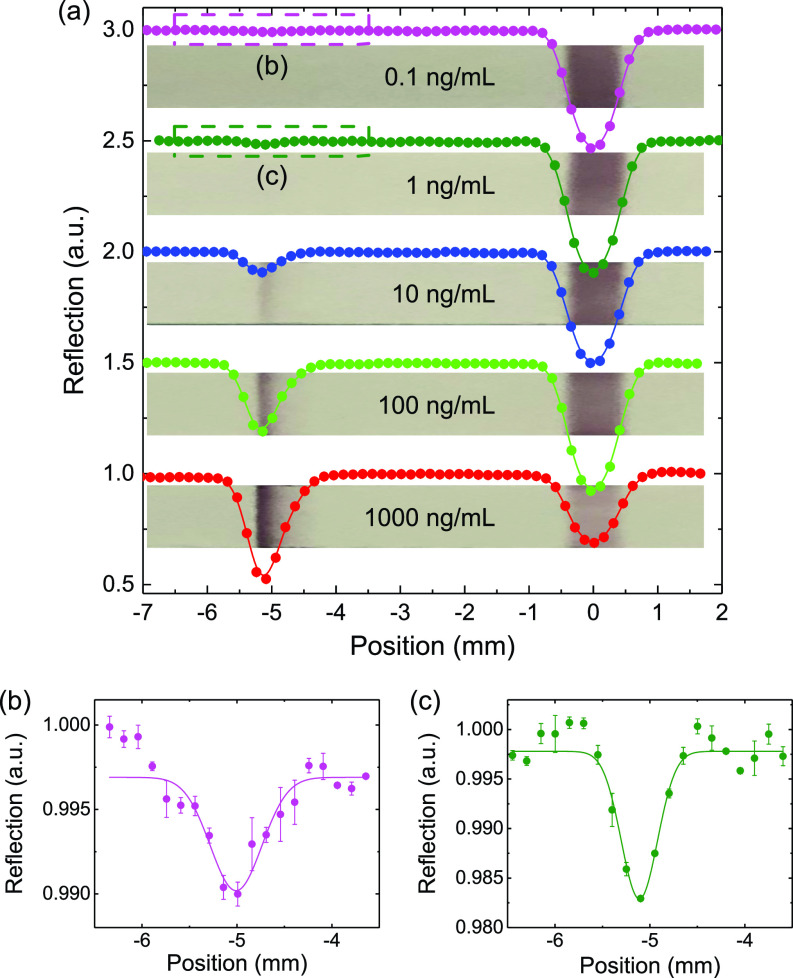
(a) Measurements on test strips with IgG concentrations from 1000 to 0.1 ng/ml, bottom to top. Three scans are taken for each sample within 5 min. Dips at ∼ −5 mm correspond to the IgG test lines, and at ∼0 mm, they are control lines. (b) and (c) correspond to densities of 0.1 ng/ml and 1 ng/ml. The solid lines are Gaussian fittings.
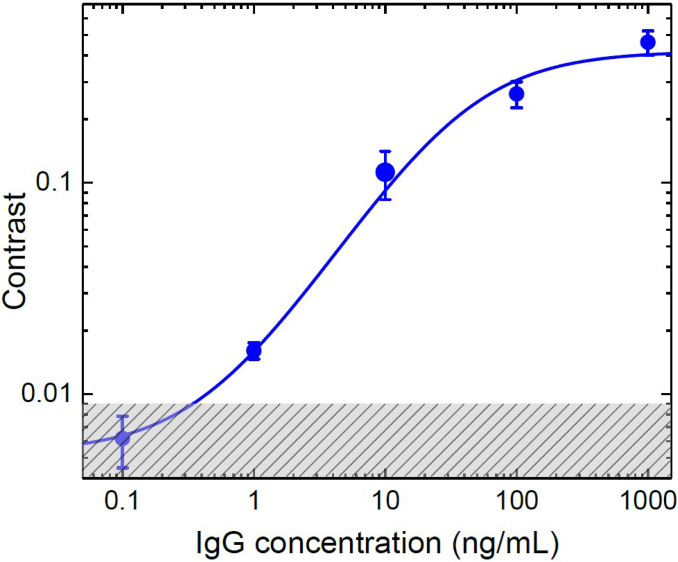
Contrasts for different IgG concentrations. 20 μl solution is used for each sample. In total, four sets of samples are measured.
References
-
- Zhang W., Du R.-H., Li B., Zheng X.-S., Yang X.-L., Hu B., Wang Y.-Y., Xiao G.-F., Yan B., Shi Z.-L. et al. , “ Molecular and serological investigation of 2019-nCoV infected patients: Implication of multiple shedding routes,” Emerging Microbes Infect. 9, 386–389 (2020). 10.1080/22221751.2020.1729071 - DOI - PMC - PubMed
-
- Folegatti P. M., Ewer K. J., Aley P. K., Angus B., Becker S., Belij-Rammerstorfer S., Bellamy D., Bibi S., Bittaye M., Clutterbuck E. A. et al. , “ Safety and immunogenicity of the chadox1 ncov-19 vaccine against SARS-CoV-2: A preliminary report of a phase 1/2, single-blind, randomised controlled trial,” Lancet 396, 467 (2020). 10.1016/S0140-6736(20)31604-4 - DOI - PMC - PubMed
LinkOut - more resources
Full Text Sources
Other Literature Sources
Miscellaneous