

Evaluation of Significance Maps and the Analysis of the Longitudinal Time Course of the Macular Ganglion Cell Complex Thicknesses in Acquired Occipital Homonymous Hemianopia Using Spectral-domain Optical Coherence Tomography
- PMID: 33012909
- PMCID: PMC7518317
- DOI: 10.1080/01658107.2019.1686764
Evaluation of Significance Maps and the Analysis of the Longitudinal Time Course of the Macular Ganglion Cell Complex Thicknesses in Acquired Occipital Homonymous Hemianopia Using Spectral-domain Optical Coherence Tomography
Abstract
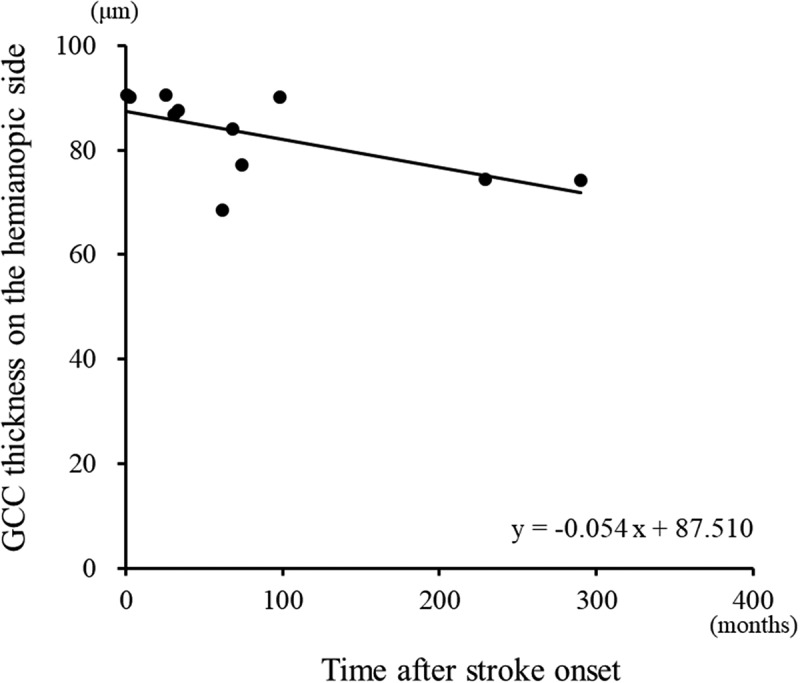
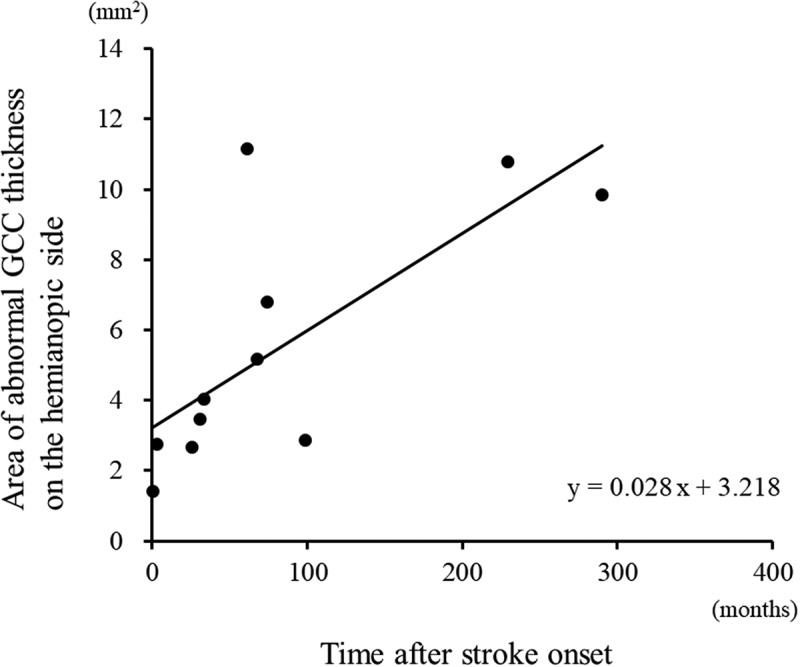
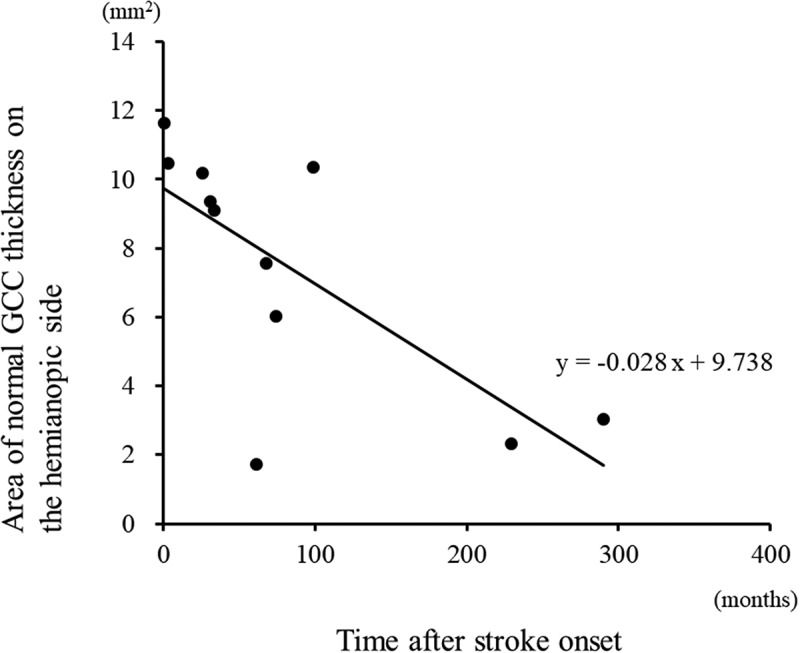
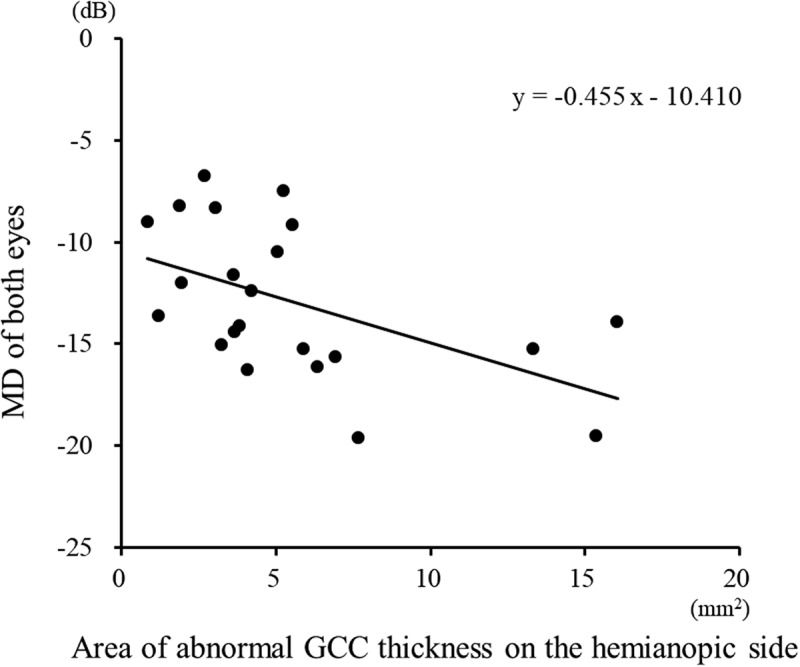
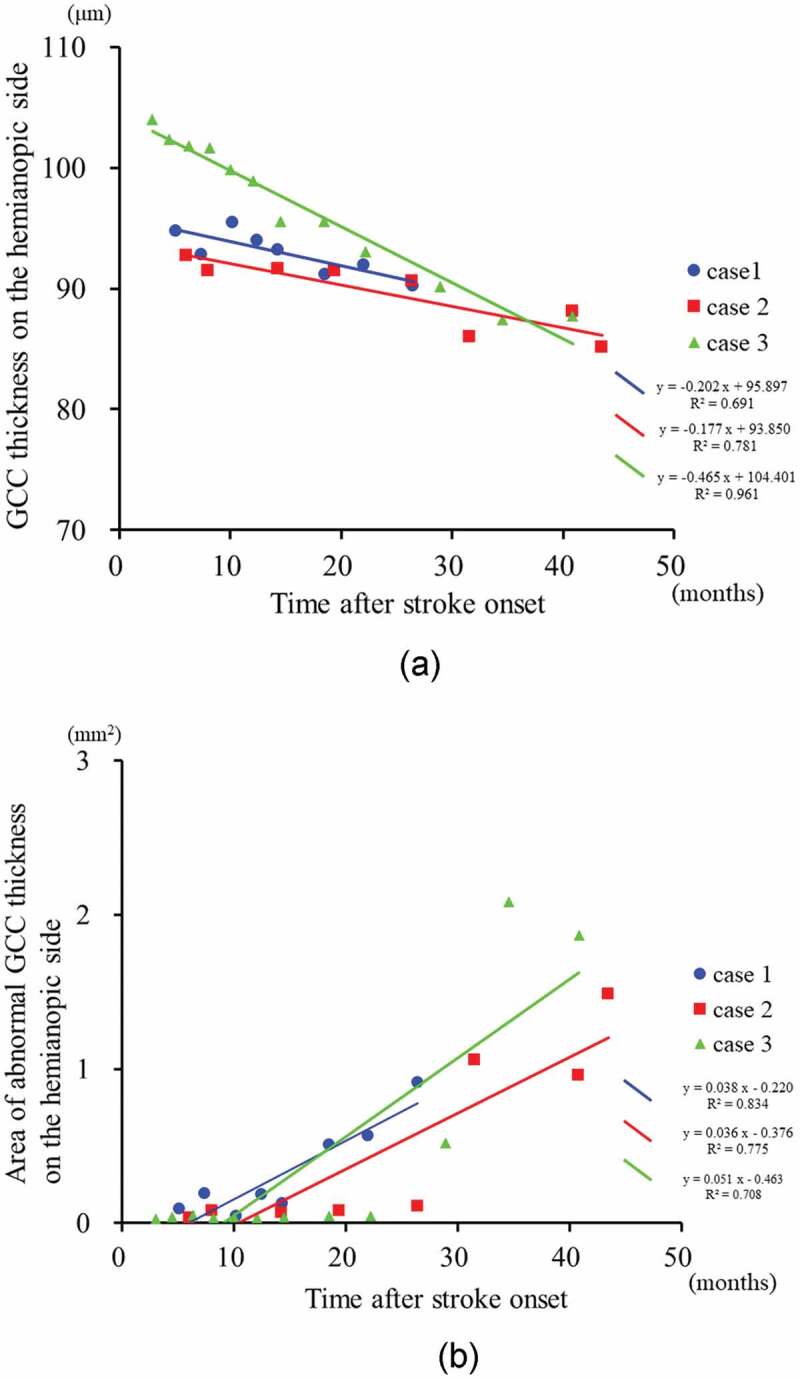
The present study was performed to evaluate the ganglion cell complex (GCC) thickness as well as the significance map and analyse the time course of the change in GCC thickness in patients with homonymous hemianopia due to posterior cerebral artery (PCA) territory stroke using spectral-domain optical coherence tomography. This study included 40 control subjects and 11 patients with unilateral PCA territory stroke. The GCC parameters were quantified using a custom-built software programme. The GCC data, centred on the macula, was divided vertically into hemianopic and unaffected sides. GCC parameters were calculated using an average of those from both eyes. The relationship between the GCC parameters and the time after stroke was determined by regression analyses. The GCC parameters in the hemi-retinae corresponding to the affected hemifields significantly differed between the hemianopes and the control group. The area under the receiver operating characteristics curve of the GCC significance map areas was significantly high. A regression analysis revealed a significant relationship between the time after stroke and both the GCC significance map areas (r = 0.791, p = .004) and GCC thickness (r = -0.736, p = .010) on the hemianopic side. The GCC parameters on the hemianopic side were reduced in patients with acquired occipital homonymous hemianopia, and the reduction was slowly progressive probably due to transsynaptic retrograde degeneration of the retinal ganglion cells. A significance map analysis provides additional OCT parameters that could be used to investigate the effect of retrogeniculate lesions on the inner retina of patients.
Keywords: Transsynaptic retrograde degeneration; abnormal ganglion cell complex area; homonymous hemianopia; retinal ganglion cell; spectral-domain optical coherence tomography.
© 2019 The Author(s). Published with license by Taylor & Francis Group, LLC.
Figures
References
-
- Weller RE, Kaas JH.. Parameters affecting the loss of ganglion cells of the retina following ablations of striate cortex in primates. Vis Neurosci. 1989;3:327–349. - PubMed
-
- Niida T, Mukuno K, Ishikawa S, Iwai E. Transneuronal retrograde degeneration in adult monkey retina following ablation of the striate cortex. In: Iwai E, Mishkin M, eds. Vision, Memory, and the Temporal Lobe. New York: Elsevier; 1990:369–375.
-
- Cowey A, Stoerig P, Williams C. Variance in transneuronal retrograde ganglion cell degeneration in monkeys after removal of striate cortex: effects of size of the cortical lesion. Vision Res. 1999;39:3642–3652. - PubMed
LinkOut - more resources
Full Text Sources