

How can process safety and a risk management approach guide pandemic risk management?
- PMID: 33013002
- PMCID: PMC7525359
- DOI: 10.1016/j.jlp.2020.104310
How can process safety and a risk management approach guide pandemic risk management?
Abstract
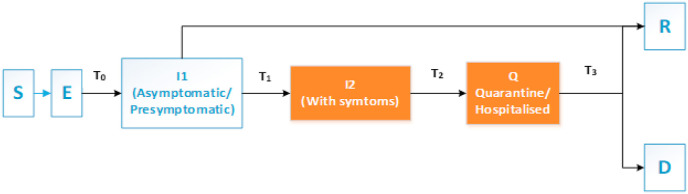
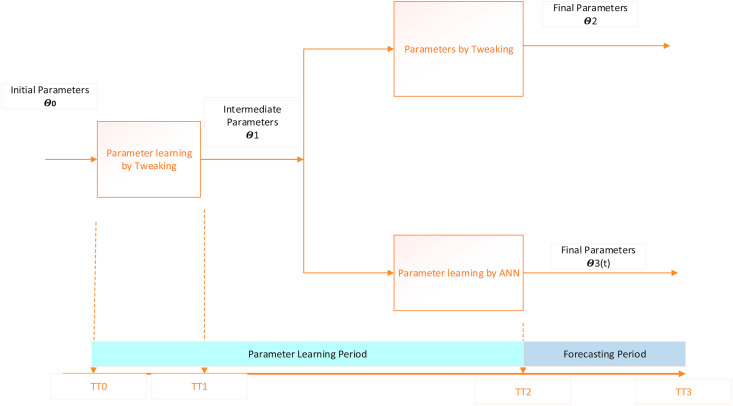
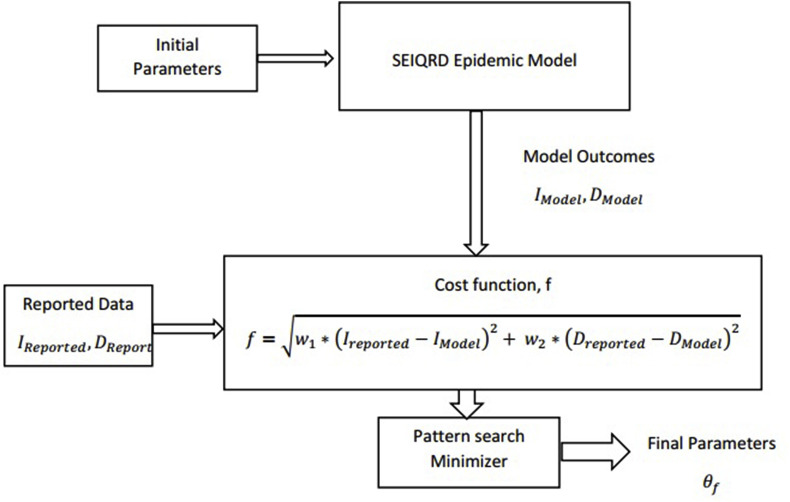
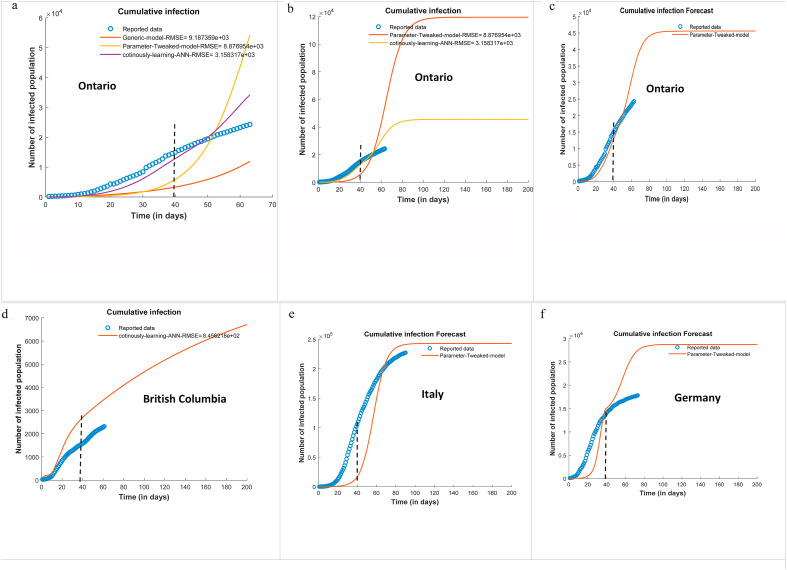
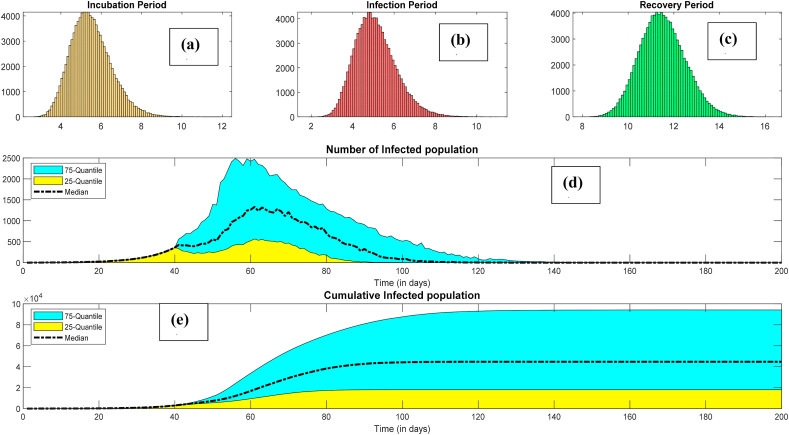
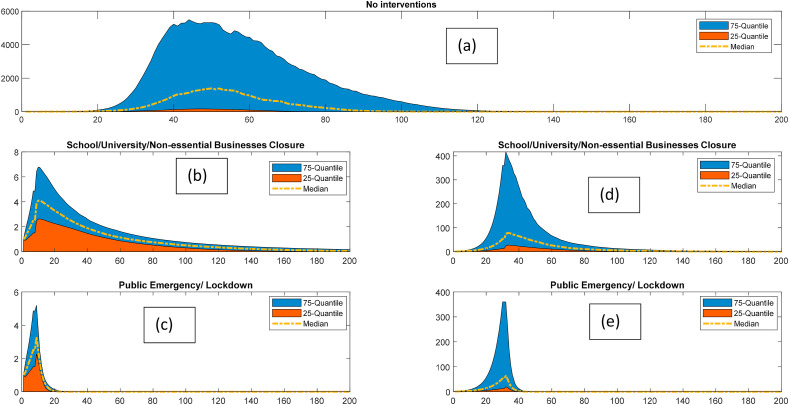
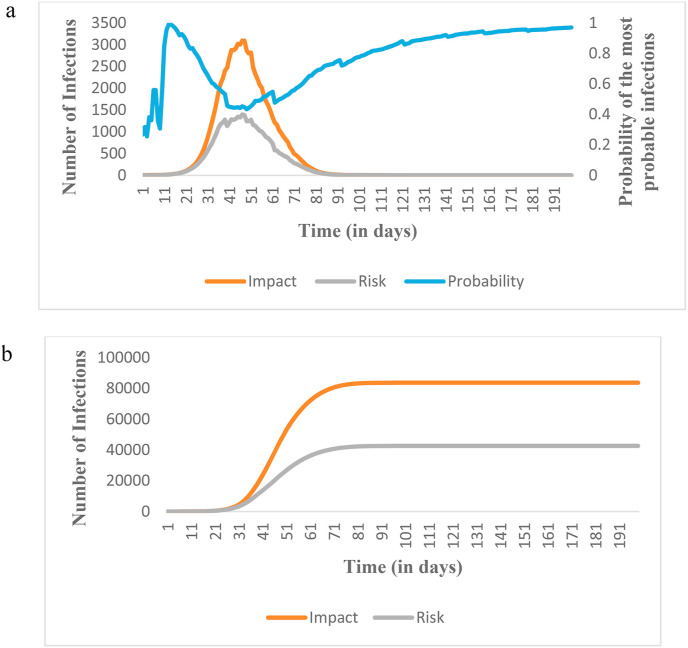
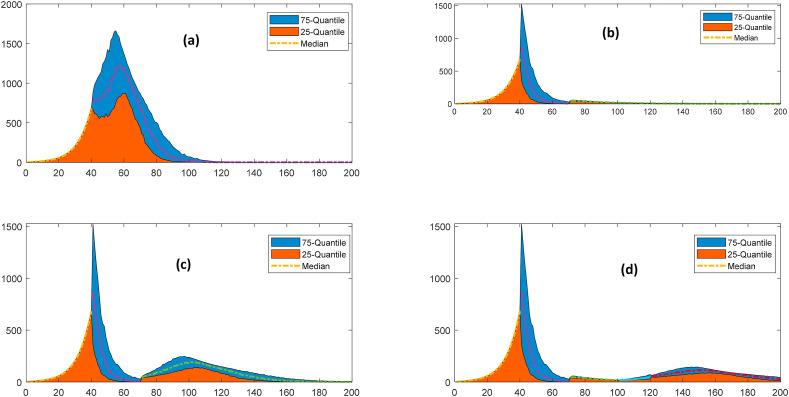
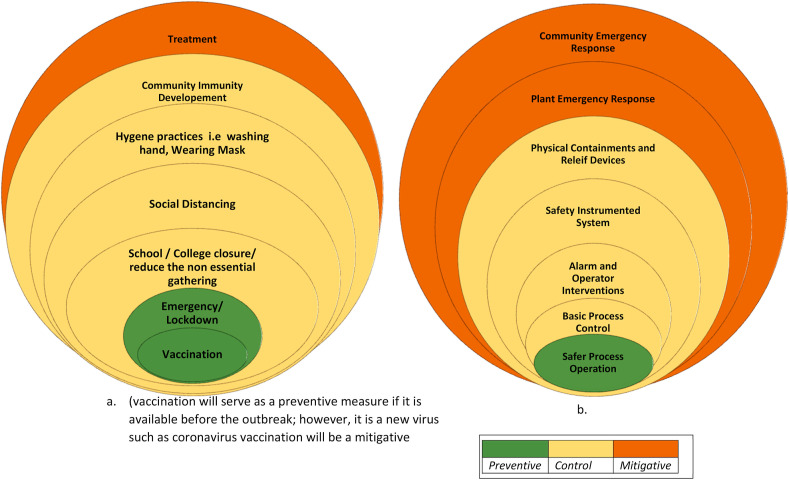
The coronavirus disease (COVID-19) brought the world to a halt in March 2020. Various prediction and risk management approaches are being explored worldwide for decision making. This work adopts an advanced mechanistic model and utilizes tools for process safety to propose a framework for risk management for the current pandemic. A parameter tweaking and an artificial neural network-based parameter learning model have been developed for effective forecasting of the dynamic risk. Monte Carlo simulation was used to capture the randomness of the model parameters. A comparative analysis of the proposed methodologies has been carried out by using the susceptible, exposed, infected, quarantined, recovered, deceased (SEIQRD) model. A SEIQRD model was developed for four distinct locations: Italy, Germany, Ontario, and British Columbia. The learning-based approach resulted in better outcomes among the models tested in the present study. The layer of protection analysis is a useful framework to analyze the effect of different safety measures. This framework is used in this work to study the effect of non-pharmaceutical interventions on pandemic risk. The risk profiles suggest that a stage-wise releasing scenario is the most suitable approach with negligible resurgence. The case study provides valuable insights to practitioners in both the health sector and the process industries to implement advanced strategies for risk assessment and management. Both sectors can benefit from each other by using the mathematical models and the management tools used in each, and, more importantly, the lessons learned from crises.
Keywords: Layers of protection; Neural network; Non-pharmaceutical interventions; Pandemic; Process monitoring; Risk.
© 2020 Elsevier Ltd. All rights reserved.
Conflict of interest statement
The authors declare that they have no known competing financial interests or personal relationships that could have appeared to influence the work reported in this paper.
Figures
References
-
- Aylward Bruce, (WHO) Liang W., (PRC) 2020. Report of the WHO-China Joint Mission on Coronavirus Disease 2019 (COVID-19). The WHO-China Joint Mission on Coronavirus Disease 2019, 2019(February), 16–24. Retrieved from.https://www.who.int/docs/default-source/coronaviruse/who-china-joint-mis...
-
- Bermingham S.K., Kramer H.J.M., van Rosmalen G.M. Towards on-scale crystalliser design using compartmental models. Comput. Chem. Eng. 1998;22(Suppl. 1):S355–S362. doi: 10.1016/S0098-1354(98)00075-1. - DOI
LinkOut - more resources
Full Text Sources
Other Literature Sources