Does Large-Scale Neighborhood Reinvestment Work? Effects of Public-Private Real Estate Investment on Local Sales Prices, Rental Prices, and Crime Rates
- PMID: 33013148
- PMCID: PMC7531196
- DOI: 10.1080/10511482.2019.1655468
Does Large-Scale Neighborhood Reinvestment Work? Effects of Public-Private Real Estate Investment on Local Sales Prices, Rental Prices, and Crime Rates
Abstract
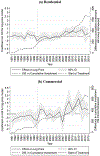
During the 1990s, the U.S. Department of Housing and Urban Development awarded more than $6 billion in competitive grants called HOPE VI to spur neighborhood redevelopment. We add to HOPE VI research by examining the impacts of a large set of public-private real estate investments, including HOPE VI, made over a 16-year period in a distressed Pittsburgh neighborhood called the Hill District. Specifically, we estimate the effects of the $468 million additional public-private investments that Hill District received compared to a demographically similar neighborhood on sale prices, rental prices, and crime. We find large and statistically significant impacts of the public-private investments on residential sales prices, commercial sales prices, and on rental prices, but only a marginally significant yet meaningful decline in non-violent arrests. For each additional $10 million of public-private investment, we find a 0.95 percent increase in residential sales prices, 2.7 percent increase in commercial sales prices, and 0.55 percent increase in rental prices. Because there was an accumulated difference over 16 years of $468 million in the amount of public-private investment across the two neighborhoods we examine, these percentage increases amount to large changes in real estate prices over that time. Commercial real estate investors and homeowners benefited the most, followed by residential landlords. Our analyses imply cities should anticipate the potential impacts of major neighborhood investment on low-income households, especially unsubsidized renters that most directly experience the brunt of rising rents.
Keywords: HOPE VI; community development; public housing; real estate.
Conflict of interest statement
Disclosure Statement No potential conflict of interest was reported by the authors.
Figures


References
-
- Bair E, & Fitzgerald JM (2005). Hedonic estimation and policy significance of the impact of HOPE VI on neighborhood property values. Review of Policy Research, 22(6), 771–786.
-
- Brophy Paul C., and Smith Rhonda N.. 1997. “Mixed-Income Housing: Factors for Success,” Cityscape 3 (2): 3–31.
-
- Brown LN (2009). HOPE VI: An analysis to determine the HOPE VI program’s influence on home sales. Community Development, 40(1), 54–63.
-
- Castells N (2010). HOPE VI Neighborhood Spillover Effects in Baltimore. Cityscape, 12(1), 65–98. Retrieved from http://www.jstor.org/stable/20868733
-
- Chaskin Robert J., and Joseph Mark L.. 2015. Integrating the Inner City: The Promise and Perils of Mixed-Income Public Housing Transformation. Chicago: University of Chicago Press.
Grants and funding
LinkOut - more resources
Full Text Sources
