. 2020 Sep 8:14:909.
doi: 10.3389/fnins.2020.00909. eCollection 2020.

Chronic Timed Sleep Restriction Attenuates LepRb-Mediated Signaling Pathways and Circadian Clock Gene Expression in the Rat Hypothalamus

Affiliations

Chronic Timed Sleep Restriction Attenuates LepRb-Mediated Signaling Pathways and Circadian Clock Gene Expression in the Rat Hypothalamus

Qi Sun et al. Front Neurosci. .

Abstract

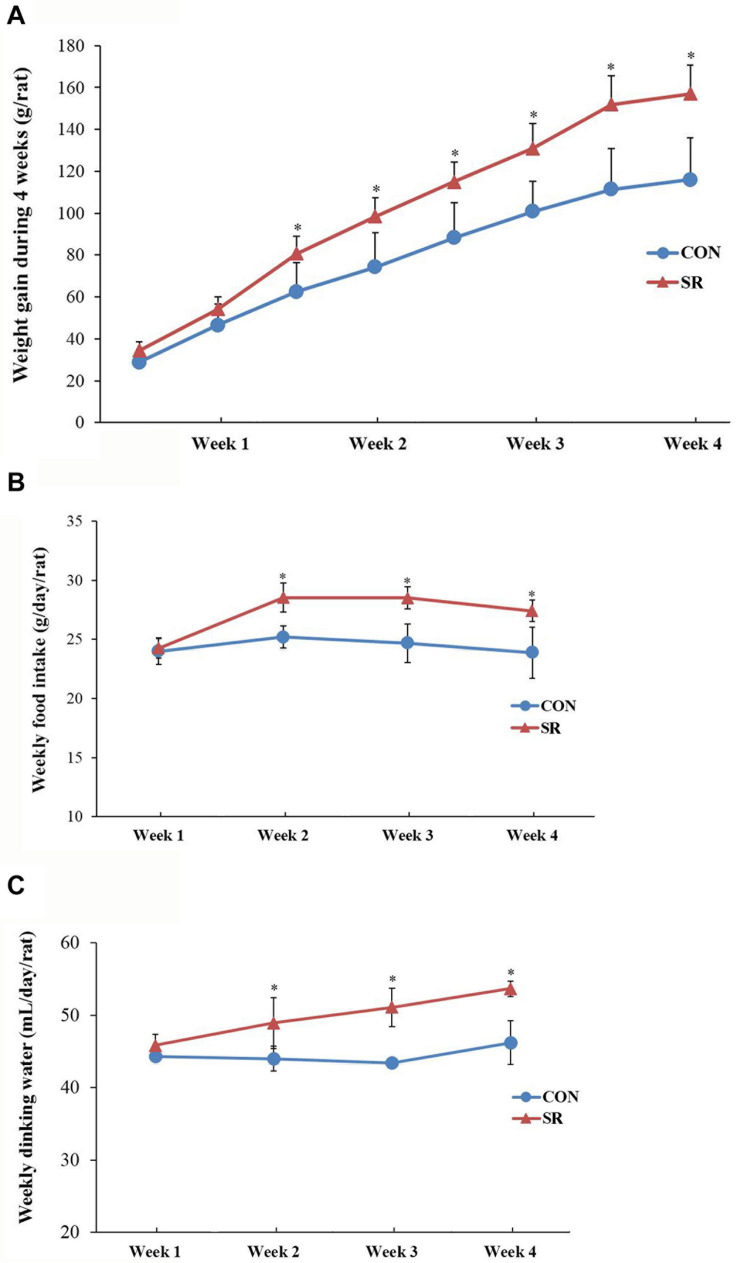
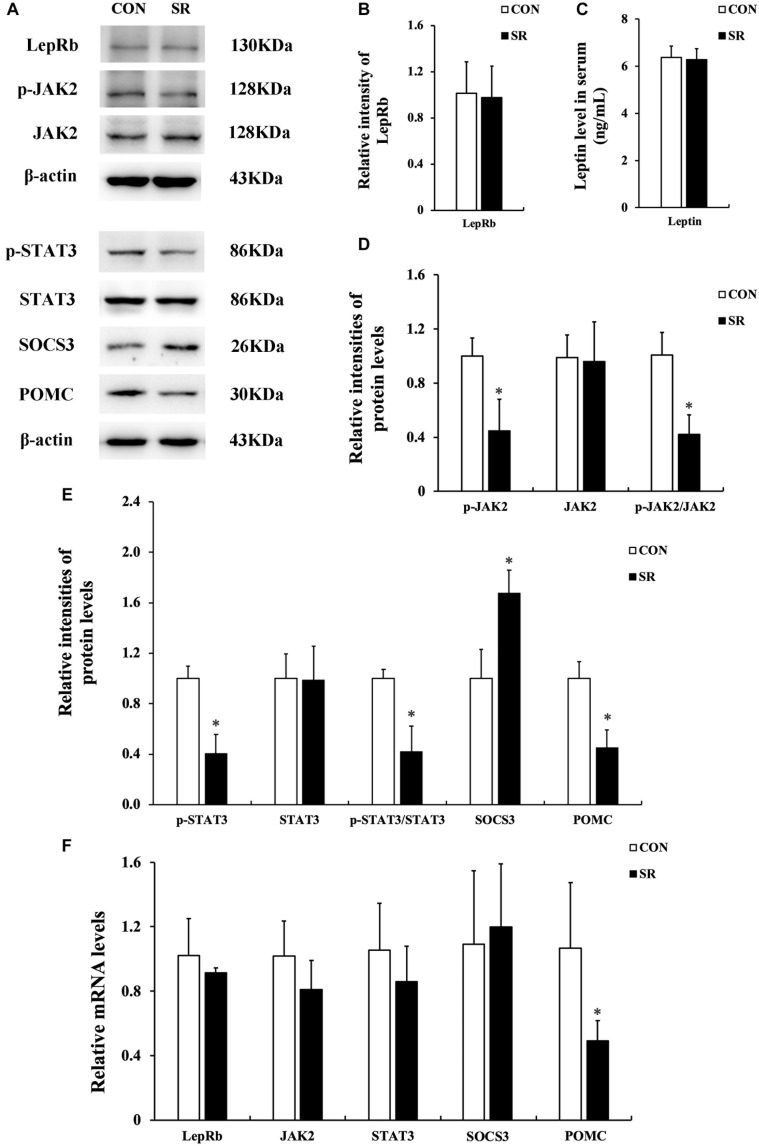
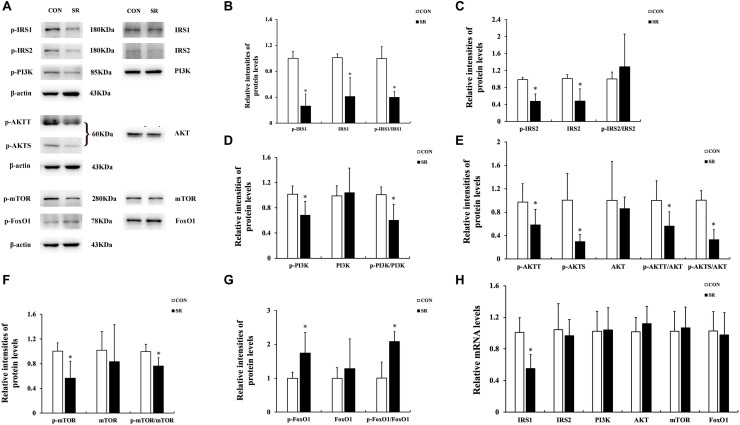
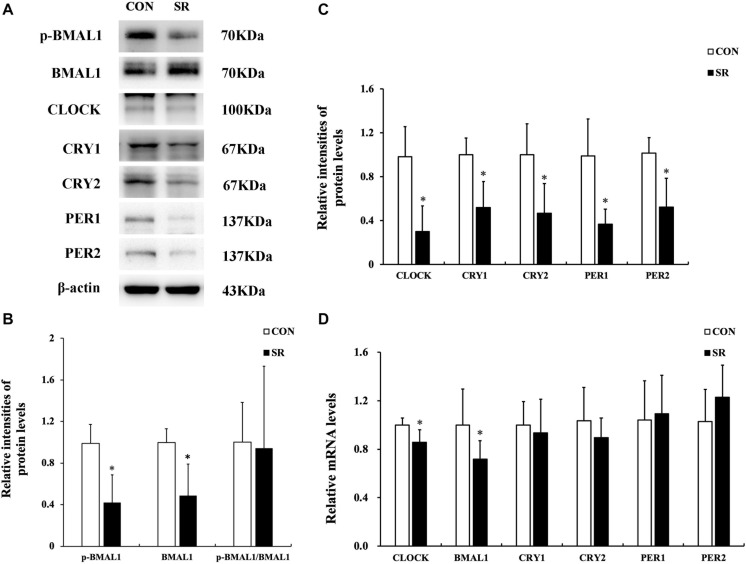
The sleep duration of adolescents has continued to decline over the past 20 years. Sleep insufficiency is one of the most important risk factors for obesity, but the mechanisms underlying the association are unclear. Therefore, the hypothalamic-regulated mechanisms of appetite and the circadian clock gene expression were examined in sleep-restricted rats. Rats aged 7 weeks were randomly divided into two groups: the control group and sleep restriction group (7 rats/group) rats were sleep-restricted for 4 weeks. Body weight gain and amount of food/water consumption were quantified. The expression of genes or proteins which regulated appetite and energy metabolism via leptin receptor signaling and the circadian clock in the hypothalamus were assessed. Chronic sleep restriction induced increased food intake and weight gain in adolescent and young adult rats from the second week of initiation of sleep restriction. Phosphorylation of Janus kinase 2 (JAK2)/signal transducer and activator of transcription 3 (STAT3) was decreased, although levels of circulating leptin or leptin receptor expression were unaltered. Furthermore, insulin receptor substrate (IRS)/phosphoinositide 3-kinase (PI3K)/AKT/mTOR and forkhead box O1 (FoxO1) signaling pathways were also compromised. Moreover, core circadian clock genes were also decreased in the sleep restriction group compared with the control. Chronic timed sleep restriction induced hyperphagic behaviors, attenuated leptin receptor-mediated signaling pathways, and depleted the expression of circadian clock gene in the hypothalamus of adolescent and young adult rats.

Keywords: appetite; circadian clock; hypothalamus; leprb signal pathway; sleep restriction.


Figures

FIGURE 1
FIGURE 1
Sleep-restricted rats displayed increased weight gain and food intake. (A) Differences in body weight gain between the two groups after sleep restriction for 4 weeks. (B) Differences in food intake between the two groups after sleep restriction for 4 weeks. (C) Differences in drinking water intake between the two groups after sleep restriction for 4 weeks. Data were expressed as the mean ± SD. Repeated-measures analysis of variance (ANOVA) was used to compare food intake and weight gain. Significant differences were defined as *p < 0.05; n = 7 rats/group vs. control group. SR, sleep restriction group; CON, control group.
FIGURE 2
FIGURE 2
Sleep restriction compromised leptin receptor signaling via JAK2/STAT3 in the hypothalamus. (A) Western blot analysis. Images were the representative results of five independent experiments for each group. (B) Densitometric analysis of Western blots for LepRb. (C) Leptin levels in the serum. (D) Densitometric analysis of Western blots for p-JAK2, JAK2, and the p-JAK2/JAK2 ratio. (E) Densitometric analysis of Western blots for p-STAT3, STAT3, the p-STAT3/STAT3 ratio, SOCS3, and POMC. The relative intensity in arbitrary units compared to β-actin and presented as fold change vs. control sample. (F) Quantitation of LepRb, JAK2, STAT3, SOCS3, and POMC mRNA by real-time RT-PCR. Gene expression was normalized to GAPDH and presented as a fold change vs. the control. Data were expressed as the mean ± SD of six experiments and analyzed by independent-sample t-test. Significant difference was defined as *p < 0.05 vs. control group. SR, sleep restriction group; CON, control group.
FIGURE 3
FIGURE 3
Sleep restriction attenuated IRS/PI3K/AKT signaling pathways. (A) Western blot analysis. Images are representative of five independent experiments for each group. (B) Densitometric analysis of Western blots for p-IRS1, IRS1, and the p-IRS1/IRS1 ratio. (C) Densitometric analysis of Western blots for p-IRS2, IRS2, and the p-IRS2/IRS2 ratio. (D) Densitometric analysis of Western blots for p-PI3K, PI3K, and the p-PI3K/PI3K ratio. (E) Densitometric analysis of Western blots for p-AKTT, p-AKTS, AKT, p-AKTT/AKT ratio, and the p-AKTS/AKT ratio. (F) Densitometric analysis of Western blots for p-mTOR, mTOR, and the p-mTOR/mTOR ratio. (G) Densitometric analysis of Western blots for p-FoxO1, FoxO1, and the p-FoxO1/FoxO1 ratio. The relative intensity in arbitrary units compared to β-actin and presented as fold change vs. control sample. (H) Quantitation of IRS1, IRS2, PI3K, AKT, mTOR, and FoxO1 mRNA by real-time RT-PCR. The gene expression was normalized to GAPDH and presented as fold change vs. the control. Data were expressed as the mean ± SD of six experiments and analyzed by independent-sample t-test. Significant differences were defined as *p < 0.05 vs. control group. SR, sleep restriction group; CON, control group.
FIGURE 4
FIGURE 4
Sleep restriction induced depletion of circadian clock expression. (A) Western blot analysis. Images are representative of five independent experiments for each group. (B) Densitometric analysis of Western blots for p-BMAL1, BMAL1, and the p-BMAL1/BMAL1 ratio. (C) Densitometric analysis of Western blots for CLOCK, CRY1, CRY2, PER1, and PER2. The relative intensity in arbitrary units compared to β-actin and presented as a fold change vs. control sample. (D) Quantitation of CLOCK, BMAL1, CRY1, CRY2, PER1, and PER2 mRNA by real-time RT-PCR. The gene expression was normalized to GAPDH and presented as a fold change vs. the control. Data were expressed as the mean ± SD of six experiments and analyzed by independent-samples t-test. Significant differences were defined as *p < 0.05 vs. control group. SR, sleep restriction group; CON, control group.

References

    1. Barrios-Correa A. A., Estrada J. A., Contreras I. (2018). Leptin signaling in the control of metabolism and appetite: lessons from animal models. J. Mol. Neurosci. 66 390–402. 10.1007/s12031-018-1185-0 - DOI - PubMed
    1. Bravo Santos R., Delgado J., Cubero J., Franco L., Ruiz-Moyano S., Mesa M., et al. (2016). Activity/inactivity circadian rhythm shows high similarities between young obesity-induced rats and old rats. Physiol. Int. 103 65–74. 10.1556/036.103.2016.1.6 - DOI - PubMed
    1. Carmo-Silva S., Cavadas C. (2017). Hypothalamic dysfunction in obesity and metabolic disorders. Adv. Neurobiol. 19 73–116. 10.1007/978-3-319-63260-5_4 - DOI - PubMed
    1. Cedernaes J., Osler M. E., Voisin S., Broman J. E., Vogel H., Dickson S. L., et al. (2015). Acute sleep loss induces tissue-specific epigenetic and transcriptional alterations to circadian clock genes in men. J. Clin. Endocrinol. Metab. 100 E1255–E1261. 10.1210/JC.2015-2284 - DOI - PubMed
    1. Cohen M. M., Jr. (2006). Role of leptin in regulating appetite, neuroendocrine function, and bone remodeling. Am. J. Med. Genet. A 140 515–524. 10.1002/ajmg.a.31099 - DOI - PubMed