. 2020 Sep 4:11:566938.
doi: 10.3389/fphar.2020.566938. eCollection 2020.

Effect of Triptolide on Temporal Expression of Cell Cycle Regulators During Cardiac Hypertrophy

Affiliations

Effect of Triptolide on Temporal Expression of Cell Cycle Regulators During Cardiac Hypertrophy

Jing-Mei Li et al. Front Pharmacol. .

Abstract

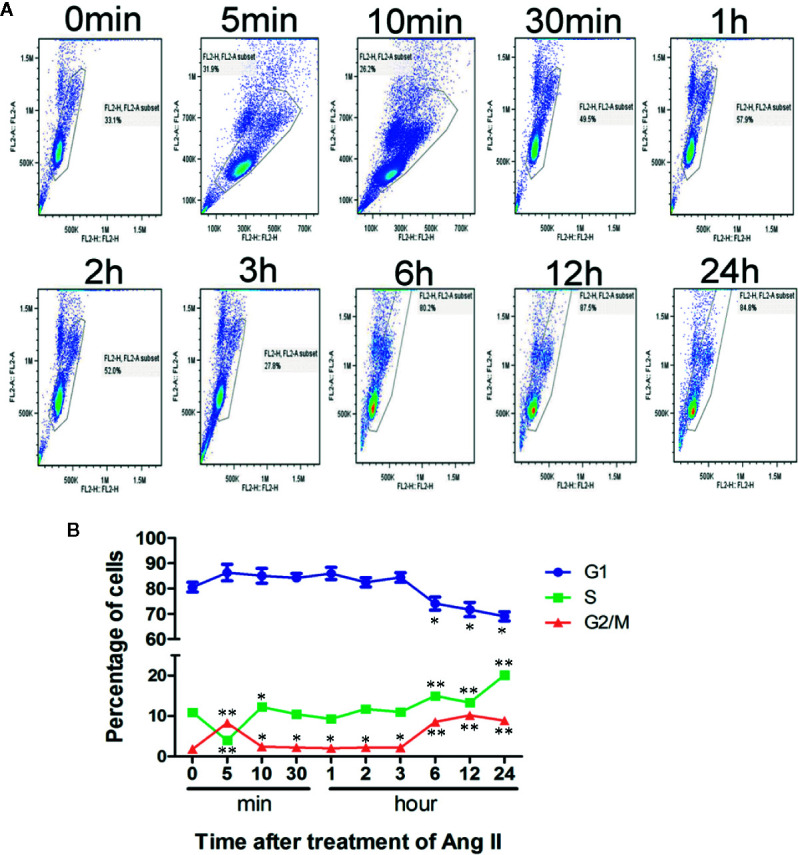
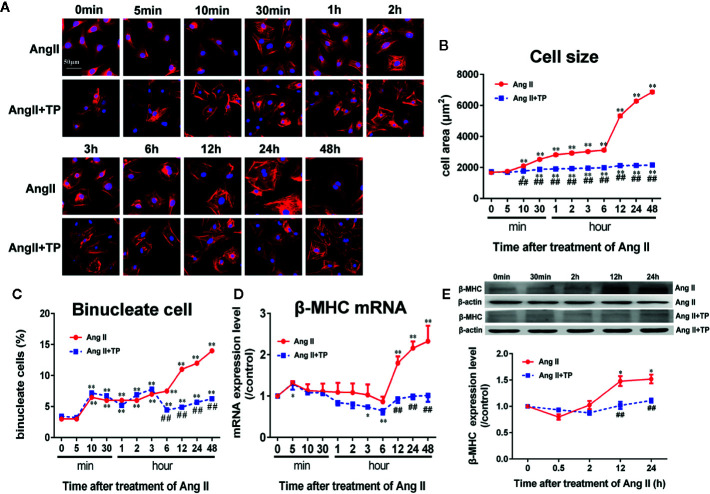
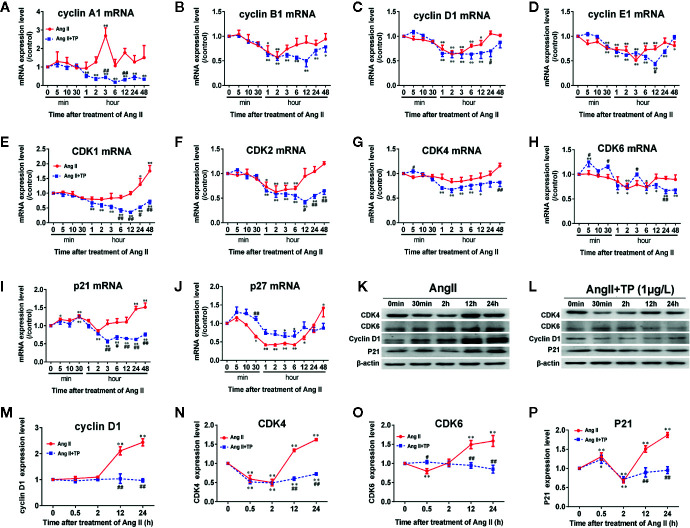
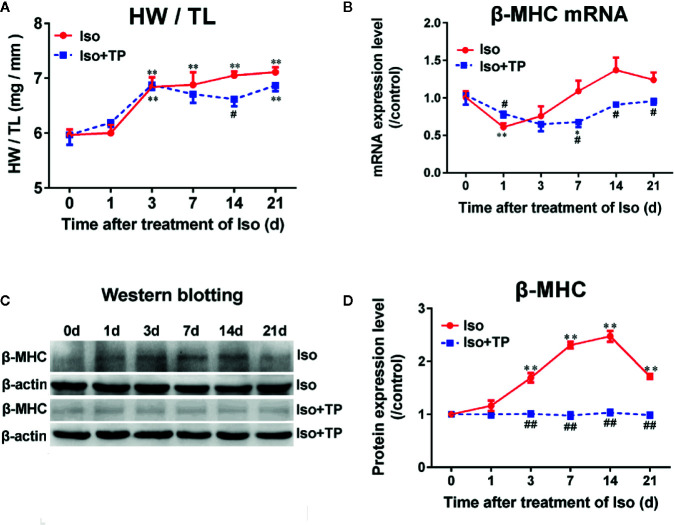
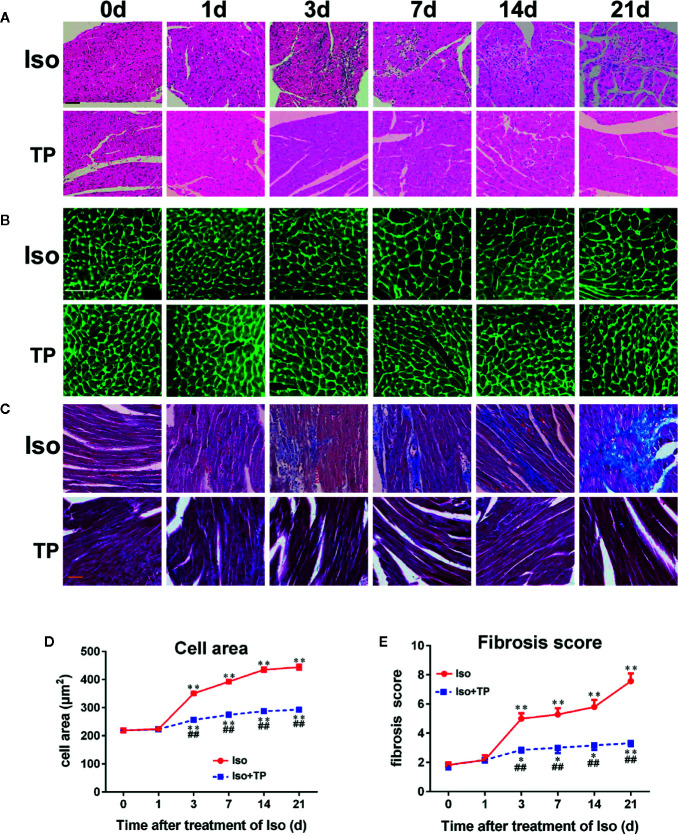
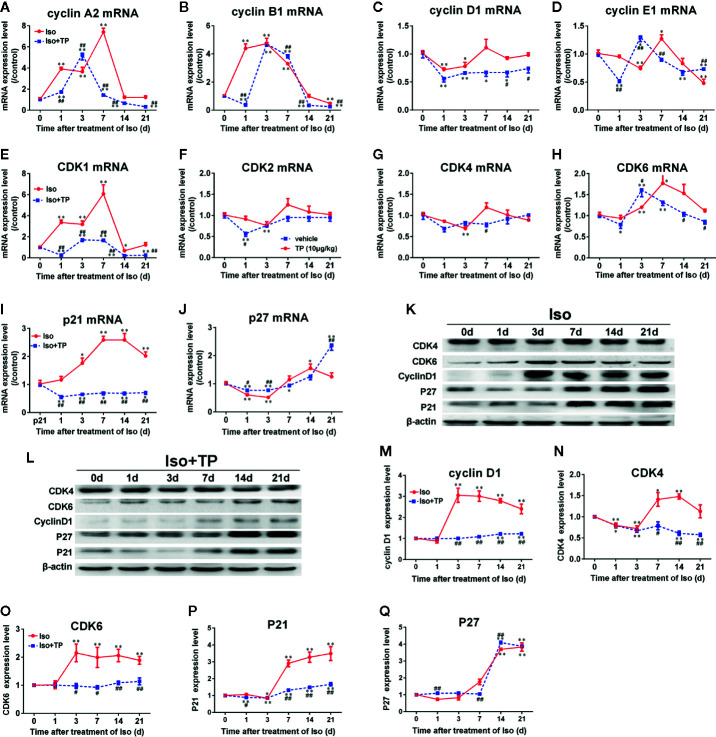
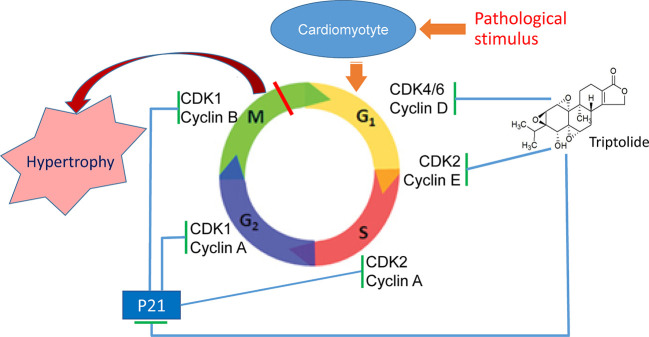
Adult mammalian cardiomyocytes may reenter the cell cycle and cause cardiac hypertrophy. Triptolide (TP) can regulate the expressions of various cell cycle regulators in cancer cells. However, its effects on cell cycle regulators during myocardial hypertrophy and mechanism are unclear. This study was designed to explore the profile of cell cycle of cardiomyocytes and the temporal expression of their regulators during cardiac hypertrophy, as well as the effects of TP. The hypertrophy models employed were neonatal rat ventricular myocytes (NRVMs) stimulated with angiotensin II (Ang II) for scheduled times (from 5 min to 48 h) in vitro and mice treated with isoprenaline (Iso) for from 1 to 21 days, respectively. TP was used in vitro at 1 μg/L and in vivo at 10 μg/kg. NRVMs were analyzed using flow cytometry to detect the cell cycle, and the expression levels of mRNA and protein of various cell cycle regulators were determined using real-time PCR and Western blot. It was found NRVM numbers in phases S and G2 increased, while that in the G1 phase decreased significantly after Ang II stimulation. The mRNA expression levels of p21 and p27 increased soon after stimulation, and thereafter, mRNA expression levels of all cell cycle factors showed a decreasing trend and reached their lowest levels in 1-3 h, except for cyclin-dependent kinase 1 (CDK1) and CDK4 mRNA. The mRNA expression levels of CDK1, p21, and p27 increased markedly after stimulation with Ang II for 24-48 h. In myocardium tissue, CDK and cyclin expression levels peaked in 3-7 days, followed by a decreasing trend, while those of p21 and p27 mRNA remained at a high level on day 21. Expression levels of all protein were consistent with the results of mRNA in NRVMs or mice. The influence of Ang II or Iso on protein expression was more obvious than that on mRNA. TP treatment effectively prevented the imbalance in the expression of cell cycle regulators in the hypertrophy model group. In Conclusion, an imbalance in the expression of cell cycle regulators occurs during cardiac hypertrophy, and triptolide corrects these abnormal expression levels and attenuates cardiac hypertrophy.

Keywords: cardiac hypertrophy; cardiomyocyte; cell cycle; cyclin; cyclin-dependent kinase; triptolide.


Figures

Figure 1
Figure 1
Cell cycle analysis after stimulation with Ang II. Neonatal rat ventricular myocytes (NRVMs) were treated with Ang II (1.0 µmol/L) for the scheduled times (0, 5, 10, and 30 min, and 1, 2, 3, 6, 12, and 24 h). (A) Flow cytometry analysis of cardiomyocytes stained with propidium iodide (PI). All experiments were conducted in duplicate and repeated three times (n = 3). (B) Data are presented as the mean ± SEM, *P < 0.05, **P < 0.01 compared with the controls (0 min), (one-way ANOVA).
Figure 2
Figure 2
Triptolide attenuated the hypertrophic response of neonatal rat ventricular myocytes. (A) NRVMs treated with Ang II (1.0 µmol/L) and 1.0 μg/L TP for the scheduled times and stained with rhodamine-phalloidin (bar = 50 µm). (B) Cell size (n = 50 cells in each group). (C) Binucleate cell percentage (n = 6 analysis and 150 cells for each analysis). (D) mRNA expression of β-MHC was determined using real-time PCR (n = 6). (E) β-MHC protein expression was determined using Western blotting (n = 4). The data are presented as the mean ± SEM, *P < 0.05, **P < 0.01 compared with the controls (0 min), ## P < 0.01 compared with the Ang II-treated group at the same time point (one-way ANOVA).
Figure 3
Figure 3
Expression of cell cycle regulators at the mRNA and protein levels in NRVMs. (A–J) The mRNA expression levels of cyclin, CDK, and CDKI were measured with real-time PCR (n = 6) and normalized to β-actin and the control group, respectively. (K, L) Cyclin D1, CDK4 and 6, and P21 protein levels as shown by Western blot analysis (n = 4). (M–P) The intensity of each band was quantified by densitometry and normalized to the β-actin and control groups. Data are shown as the mean ± SEM, *P < 0.05, **P < 0.01 compared with the controls (0 min), #P < 0.05, ##P < 0.01 compared with the Ang II-treated group at same time point (one-way ANOVA).
Figure 4
Figure 4
Triptolide attenuated cardiac hypertrophy in mice. (A) Heart weight (HW) index to tibia length (TL). (B) β-MHC mRNA expression level (n = 6). (C) β-MHC protein level as assessed by Western blot analysis (n = 4). (D) The intensity of each band was quantified by densitometry and normalized to β-actin and the control group. Data are shown as the mean ± SEM, *P < 0.05, **P < 0.01 compared with the controls (0 day); #P < 0.05, ##P < 0.01 compared with the Iso-treated group at the same time point (one-way ANOVA).
Figure 5
Figure 5
Myocardial histological changes after TP treatment. (A) Hematoxylin and eosin (HE) staining of myocardial LV tissue (bar = 50 µm). (B) Wheat germ agglutinin lectin staining (bar = 50 µm). (C) Masson’s trichome-stained left ventricular tissue (bar = 50 µm). (D) Cross-sectional area (n = 80). (E) Fibrosis score. Data are shown as the mean ± SEM (n = 6 in each group), *P < 0.05, **P < 0.01 compared with the controls (0 day); ##P < 0.01 compared with the Iso-treated group at the same time point (one-way ANOVA).
Figure 6
Figure 6
The effects of TP on the myocardial expression of cell cycle regulators in mice. (A–J) The mRNA expression levels of all cell cycle regulators. (K, L) cyclin D1, CDK4 and 6, P21, and P27 protein levels as shown by Western blot analysis (n = 4 per group). (M–Q) The intensity of each band was quantified by densitometry and normalized to β-actin and control group. The data are shown as the mean ± SEM (n = 5), *P < 0.05, **P < 0.01 compared with the controls (0 day); #P < 0.05, ##P < 0.01 compared with the Iso-treated group at the same time point (one-way ANOVA).
Figure 7
Figure 7
Triptolide (TP) ameliorates cardiac hypertrophy via correcting the abnormal expression of cell cycle regulators in cardiomyocytes.

Similar articles

Cited by

References

    1. Ahuja P., Sdek P., MacLellan W. R. (2007). Cardiac myocyte cell cycle control in development, disease, and regeneration. Physiol. Rev. 87, 521–544. 10.1152/physrev.00032.2006 - DOI - PMC - PubMed
    1. Aoki H., Richmond M., Izumo S., Sadoshima J. (2000). Specific role of the extracellular signal-regulated kinase pathway in angiotensin II-induced cardiac hypertrophy in vitro. Biochem. J. 347, 275–284. 10.1042/bj3470275 - DOI - PMC - PubMed
    1. Beltrami A. P., Urbanek K., Kajstura J., Yan S. M., Finato N., Bussani R., et al. (2001). Evidence that human cardiac myocytes divide after myocardial infarction. N. Engl. J. Med. 344, 1750–1757. 10.1056/NEJM200106073442303 - DOI - PubMed
    1. Bretones G., Delgado M. D., León J. (2015). Myc and cell cycle control. Biochim. Biophys. Acta 1849, 506–516. 10.1016/j.bbagrm.2014.03.013 - DOI - PubMed
    1. Cheng R. K., Asai T., Tang H., Dashoush N. H., Kara R. J., Costa K. D., et al. (2007). Cyclin A2 induces cardiac regeneration after myocardial infarction and prevents heart failure. Circ. Res. 100, 1741–1748. 10.1161/CIRCRESAHA.107.153544 - DOI - PubMed