. 2020 Sep 7:11:1048.
doi: 10.3389/fphys.2020.01048. eCollection 2020.

Alcohol and Liver Clock Disruption Increase Small Droplet Macrosteatosis, Alter Lipid Metabolism and Clock Gene mRNA Rhythms, and Remodel the Triglyceride Lipidome in Mouse Liver

Affiliations

Alcohol and Liver Clock Disruption Increase Small Droplet Macrosteatosis, Alter Lipid Metabolism and Clock Gene mRNA Rhythms, and Remodel the Triglyceride Lipidome in Mouse Liver

Jennifer A Valcin et al. Front Physiol. .

Abstract

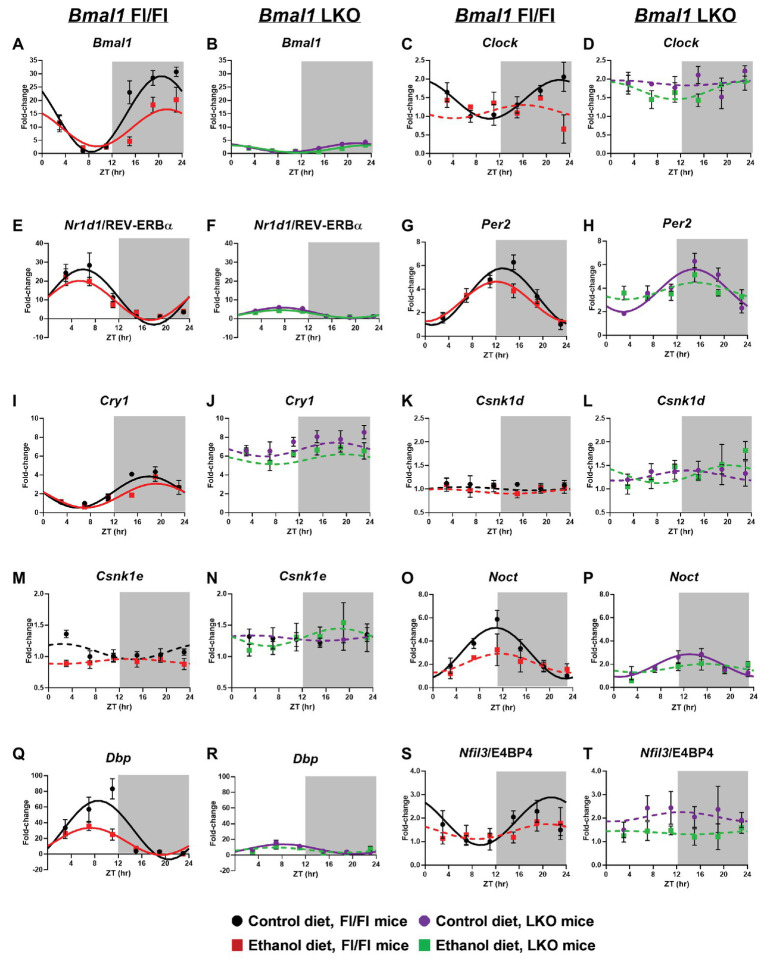
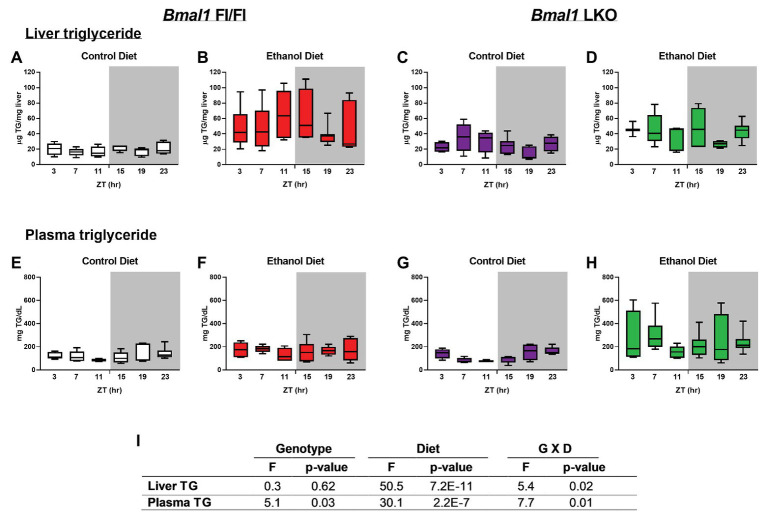
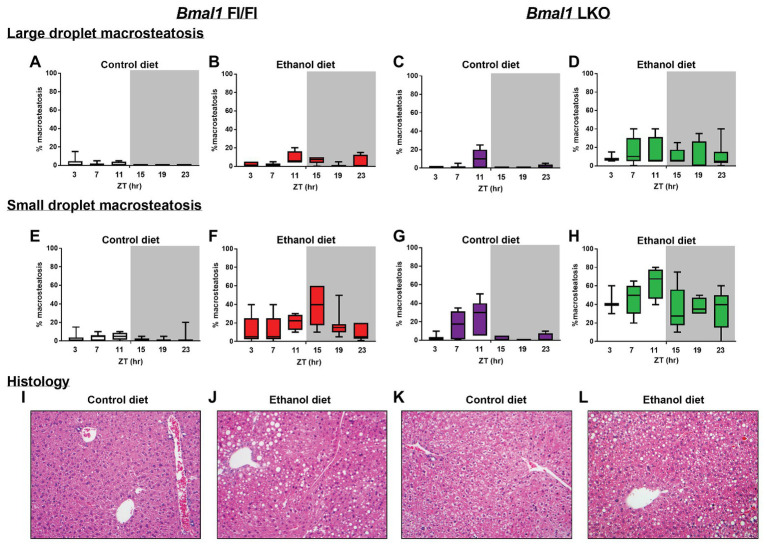
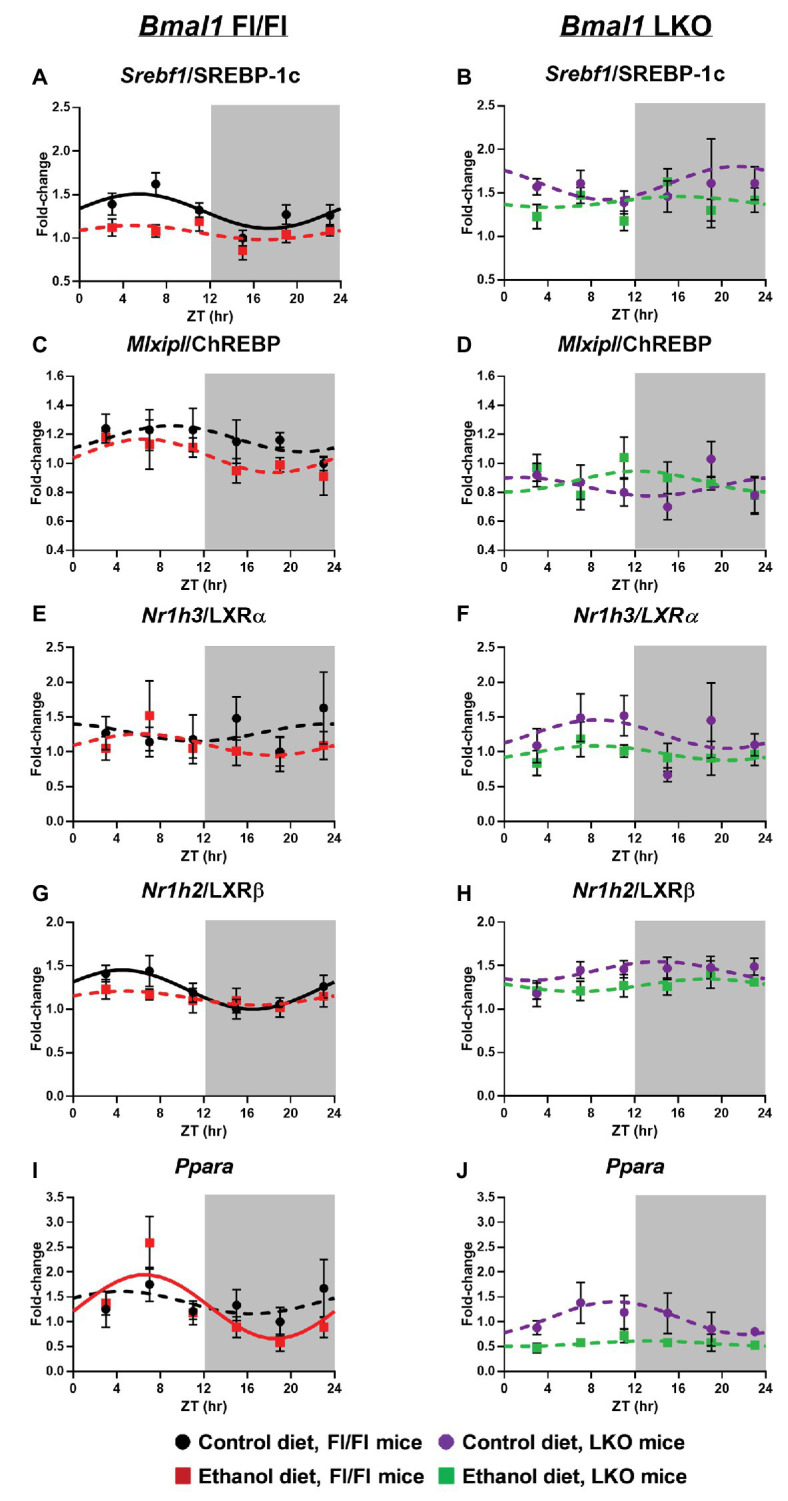
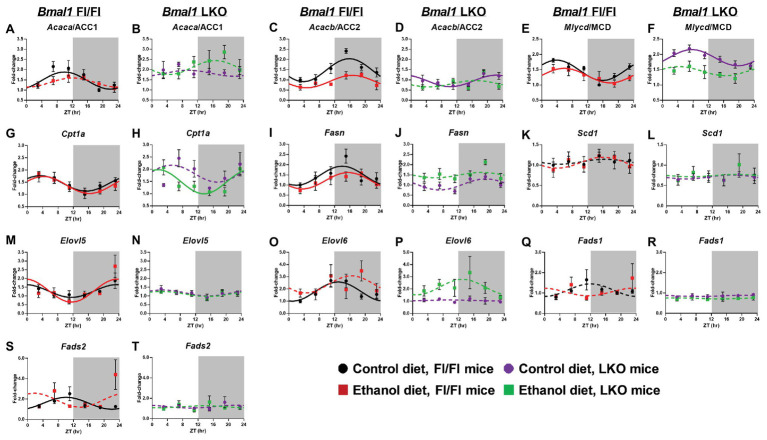
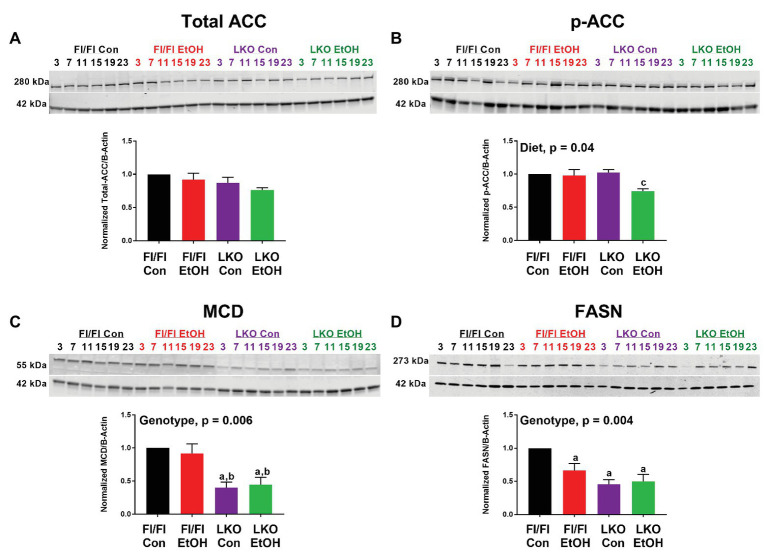
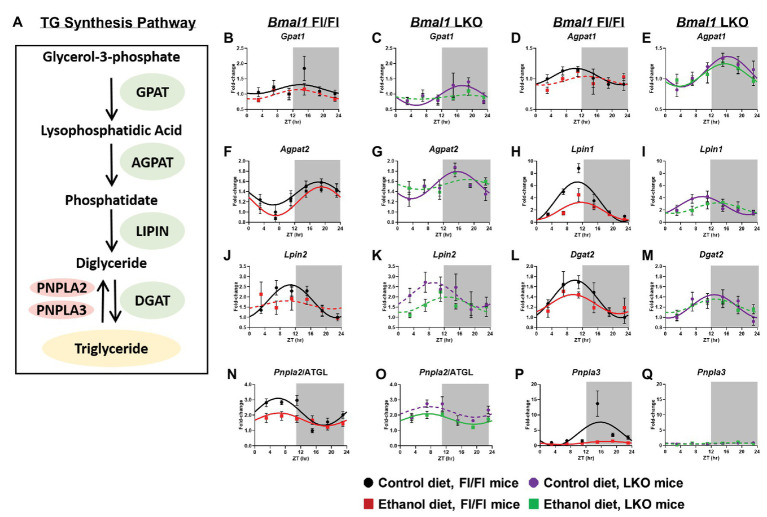
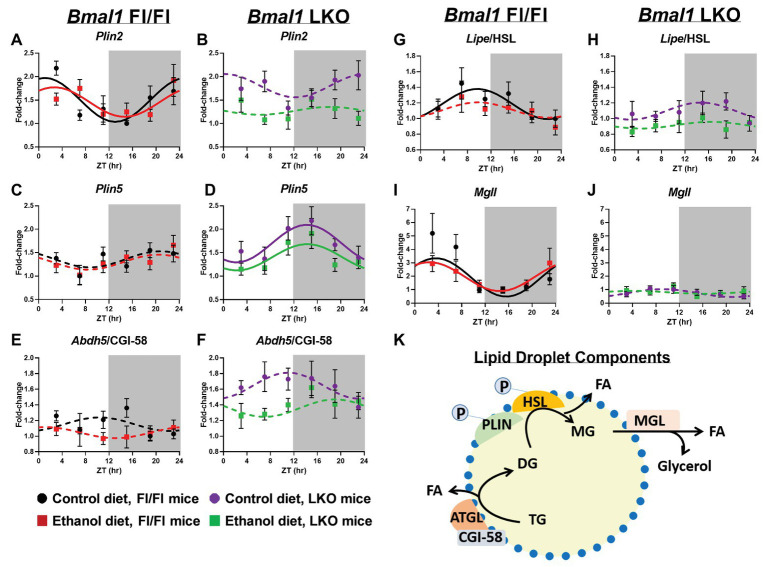
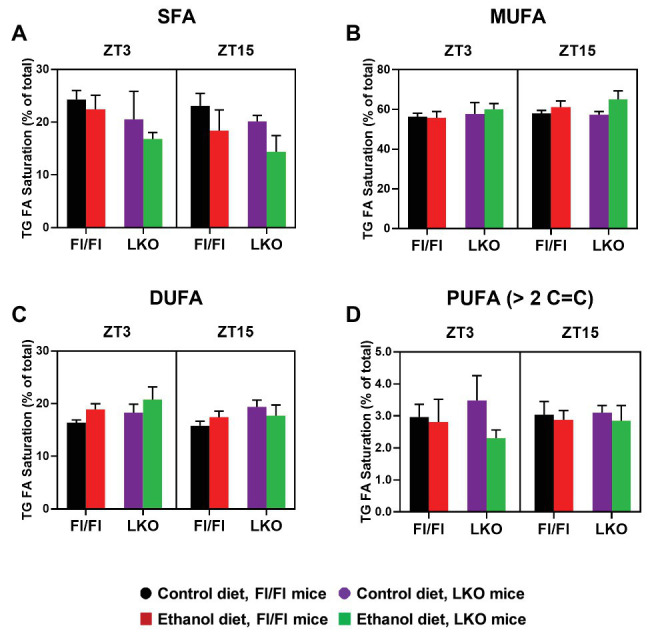
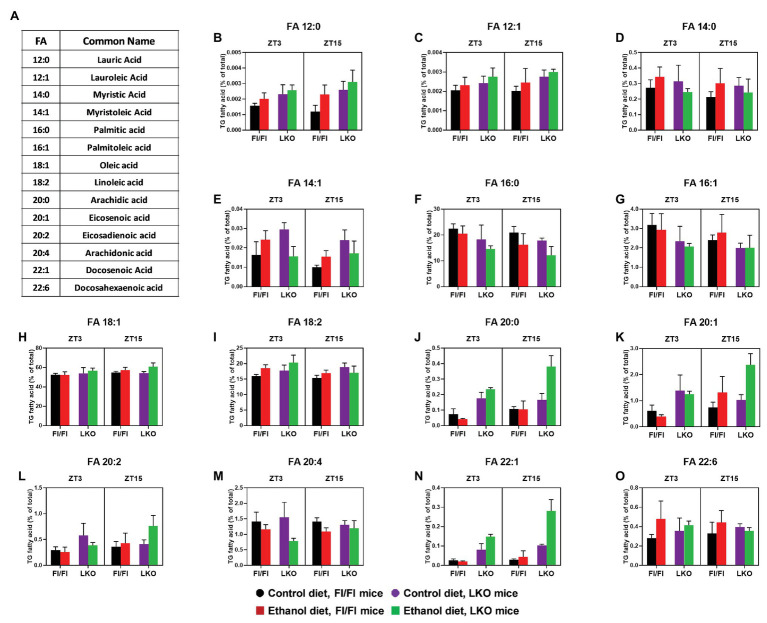
Heavy alcohol drinking dysregulates lipid metabolism, promoting hepatic steatosis - the first stage of alcohol-related liver disease (ALD). The molecular circadian clock plays a major role in synchronizing daily rhythms in behavior and metabolism and clock disruption can cause pathology, including liver disease. Previous studies indicate that alcohol consumption alters liver clock function, but the impact alcohol or clock disruption, or both have on the temporal control of hepatic lipid metabolism and injury remains unclear. Here, we undertook studies to determine whether genetic disruption of the liver clock exacerbates alterations in lipid metabolism and worsens steatosis in alcohol-fed mice. To address this question, male liver-specific Bmal1 knockout (LKO) and flox/flox (Fl/Fl) control mice were fed a control or alcohol-containing diet for 5 weeks. Alcohol significantly dampened diurnal rhythms of mRNA levels in clock genes Bmal1 and Dbp, phase advanced Nr1d1/REV-ERBα, and induced arrhythmicity in Clock, Noct, and Nfil3/E4BP4, with further disruption in livers of LKO mice. Alcohol-fed LKO mice exhibited higher plasma triglyceride (TG) and different time-of-day patterns of hepatic TG and macrosteatosis, with elevated levels of small droplet macrosteatosis compared to alcohol-fed Fl/Fl mice. Diurnal rhythms in mRNA levels of lipid metabolism transcription factors (Srebf1, Nr1h2, and Ppara) were significantly altered by alcohol and clock disruption. Alcohol and/or clock disruption significantly altered diurnal rhythms in mRNA levels of fatty acid (FA) synthesis and oxidation (Acaca/b, Mlycd, Cpt1a, Fasn, Elovl5/6, and Fads1/2), TG turnover (Gpat1, Agpat1/2, Lpin1/2, Dgat2, and Pnpla2/3), and lipid droplet (Plin2/5, Lipe, Mgll, and Abdh5) genes, along with protein abundances of p-ACC, MCD, and FASN. Lipidomics analyses showed that alcohol, clock disruption, or both significantly altered FA saturation and remodeled the FA composition of the hepatic TG pool, with higher percentages of several long and very long chain FA in livers of alcohol-fed LKO mice. In conclusion, these results show that the liver clock is important for maintaining temporal control of hepatic lipid metabolism and that disrupting the liver clock exacerbates alcohol-related hepatic steatosis.

Keywords: BMAL1; alcohol; circadian clock; fatty acid; lipidomics; liver; steatosis; triglyceride.


Figures

Figure 1
Figure 1
Chronic alcohol and liver clock disruption alter 24 h mRNA rhythms in molecular clock genes in the liver. Diurnal mRNA profiles of Brain and Muscle ARNT-like 1 (Bmal1; A,B), Circadian Locomotor Output Cycles Kaput (Clock; C,D), Nuclear Receptor Subfamily 1 Group D Member 1 (Nr1d1/Rev-Erbα; E,F), Period 2 (Per2; G,H), Cryptochrome 1 (Cry1; I,J), Casein Kinase 1 Delta (Csnk1d; K,L), Casein Kinase 1 Epsilon (Csnk1e; M,N), Nocturnin (Noct; O,P), D site of Albumin Promoter Binding Protein (Dbp; Q,R) and Nuclear Factor, Interleukin 3 Regulated (Nfil3/E4BP4; S,T) were measured in livers of control-fed (black) and alcohol-fed (red) Bmal1 Flox/Flox (Fl/Fl) and control-fed (purple) and alcohol-fed (green) Bmal1 liver-specific knockout (LKO) mice at ZT 3, 7, 11, 15, 19, and 23 (ZT 0: lights on/inactive period, ZT 12: lights off/active period, gray area) by real time (RT)-PCR. Data are presented as a fold-change to the Bmal1 Fl/Fl control diet trough time-point and normalized to Gapdh. Cosinor analysis was performed using a nonlinear regression module in SPSS. Data are expressed as mean ± SEM for n = 4–8 mice/genotype/diet/time-point. Solid lines indicate rhythmic mRNA levels and a significant cosine fit, whereas dashed lines indicate arrhythmicity and a non-significant cosine fit. Results for Cosinor and ANOVA analyses are provided in Supplementary Tables 1 and 2, respectively.
Figure 2
Figure 2
Chronic alcohol and liver clock disruption alter diurnal variations in liver and plasma triglyceride levels. Liver (A–D) and plasma (E–F) triglyceride (TG) were measured in samples collected from control-fed (A,E white) and alcohol-fed (B,F red) Bmal1 Flox/Flox (Fl/Fl) and control-fed (C,G purple) and alcohol-fed (D,H green) Bmal1 liver-specific knockout (LKO) mice at ZT 3, 7, 11, 15, 19, and 23 (ZT 0: lights on/inactive period, ZT 12: lights off/active period, gray area). Data are shown as min to max box and whisker plots for n = 3–8 mice/genotype/diet/time-point. Results from two-factor ANOVA are provided in (I).
Figure 3
Figure 3
Chronic alcohol and liver clock disruption enhance liver histopathology. Large droplet (A–D) and small droplet (E–H) macrosteatosis were assessed in H and E-stained liver sections prepared from control-fed (A,E white) and alcohol-fed (B,F red) Bmal1 Flox/Flox (Fl/Fl) and control-fed (C,G purple) and alcohol-fed (D,H green) Bmal1 liver-specific knockout (LKO) mice at ZT 3, 7, 11, 15, 19, and 23 (ZT 0: lights on/inactive period, ZT 12: lights off/active period, gray area). Liver sections were scored at multiple magnifications. Data represent the percentage of hepatocytes containing large and small droplet macrosteatosis per section. Results shown as min to max box and whisker plots for n = 3–8 mice/genotype/diet/time-point. (I–L) Representative H and E stained histology images from each group at ZT 15 (20X mag). Results for statistical analyses are provided in Table 1.
Figure 4
Figure 4
Chronic alcohol and liver clock disruption alter diurnal mRNA rhythms of lipid metabolism transcription factors in the liver. Diurnal mRNA profiles of Sterol regulatory element binding transcription factor 1 (Srebf1/SREBP-1C; A,B), MLX-interacting protein-like/Carbohydrate-responsive element-binding protein (Mlxipl/ChREBP; C,D), Nuclear receptor subfamily 1, group H, member 3/Liver X receptor alpha (Nr1h3/ LXRα; E,F), Nuclear receptor subfamily 1, group H, member 2/Liver X receptor beta (Nr1h2/LXRβ; G,H), Peroxisome proliferator-activated receptor alpha (Pparα; I,J) were measured in livers of control-fed (black) and alcohol-fed (red) Bmal1 Flox/Flox (Fl/Fl) and control-fed (purple) and alcohol-fed (green) Bmal1 liver-specific knockout (LKO) mice at ZT 3, 7, 11, 15, 19, and 23 (ZT 0: lights on/inactive period, ZT 12: lights off/active period, gray area) by RT-PCR. Data are presented as a fold-change to the Bmal1 Fl/Fl control diet trough time-point and normalized to Ppia. Cosinor analysis was performed using a nonlinear regression module in SPSS. Data are expressed as mean ± SEM for n = 4–8 mice/genotype/diet/time point. Solid lines indicate rhythmic mRNA levels and a significant cosine fit, whereas dashed lines indicate arrhythmicity and a non-significant cosine fit. Results for Cosinor and ANOVA analyses are provided in Supplementary Tables 3 and 4, respectively.
Figure 5
Figure 5
Chronic alcohol and liver clock disruption alter diurnal mRNA rhythms of fatty acid metabolism genes. Diurnal mRNA profiles of Acetyl-CoA carboxylase 1 (Acaca/ACC1; A,B), Acetyl-CoA carboxylase 2 (Acacb/ACC2; C,D), Malonyl-CoA decarboxylase (Mlycd/MCD; E,F), Carnitine-palmitoyl transferase 1A (Cpt1a; G,H), Fatty acid synthase (Fasn; I,J), Stearyl-CoA desaturase 1 (Scd1; K,L), Elongation of very long chain fatty acids protein 5 (Elovl5; M,N), Elongation of very long chain fatty acid protein 6 (Elovl6; O,P), Fatty acid desaturase 1 (Fads1; Q,R), and Fatty acid desaturase 2 (Fads2; S,T) were measured in livers of control-fed (black) and alcohol-fed (red) Bmal1 Flox/Flox (Fl/Fl) and control-fed (purple) and alcohol-fed (green) Bmal1 liver-specific knockout (LKO) mice at ZT 3, 7, 11, 15, 19, and 23 (ZT 0: lights on/inactive period, ZT 12: lights off/active period, gray area) by RT-PCR. Data are presented as a fold-change to the Bmal1 Fl/Fl control diet trough time-point and normalized to Ppia. Data are expressed as mean ± SEM for n = 4–8 mice/genotype/diet/time point. Solid lines indicate rhythmic mRNA levels and a significant cosine fit, whereas dashed lines indicate arrhythmicity and a non-significant cosine fit. Results for Cosinor and ANOVA analyses are provided in Supplementary Tables 4 and 5, respectively.
Figure 6
Figure 6
Chronic alcohol and liver clock disruption alter abundance and phosphorylation state of select fatty acid metabolism proteins. Diurnal protein abundances of total acetyl CoA carboxylase (Total ACC; A), phosphorylated acetyl CoA carboxylase (p-ACC; B), malonyl-CoA decarboxylase (MCD; C), and fatty acid synthase (FASN; D) were determined by western blotting using liver homogenates of control-fed (black) and alcohol-fed (red) Bmal1 Flox/Flox (Fl/Fl) and control-fed (purple) and alcohol-fed (green) Bmal1 liver-specific knockout (LKO) mice from ZT 3, 7, 11, 15, 19, and 23 (ZT 0: lights on/inactive period, ZT 12: lights off/active period). Protein abundances were detected using the LI-COR Odyssey® digital imaging system. A representative image is presented for each protein of interest showing a full time course. The bar graphs indicate the average protein abundance calculated over the 24 h day normalized to β-actin, and levels are displayed as a fold-change from the control-fed Fl/Fl group. Data are shown as mean ± SEM n = 3–4 mice/genotype/diet. Significant two-factor ANOVA results are included in graphs. Letters indicate statistically significant differences (p < 0.05) for comparisons to control-fed Fl/Fl mice (a), alcohol-fed Fl/Fl mice (b), and control-fed LKO mice (c).
Figure 7
Figure 7
Chronic alcohol and liver clock disruption alter diurnal mRNA rhythms of triglyceride metabolism genes. Pathway for triglyceride synthesis/breakdown (A). Diurnal mRNA profiles of Glycerol-3-phosphate acyltransferase (Gpat1; B,C), 1-acyl-sn-glycerol-3-phosphate acyltransferase alpha (Agpat1; D,E), 1-acyl-sn-glycerol-3-phosphate acyltransferase beta (Agpat2; F,G), Lipin-1 (Lpin1; H,I), Lipin-2 (Lpin2; J,K), Diacylglycerol o-acyltransferase 2 (Dgat2; L,M), Patatin-like phospholipase domain-containing protein 2/Adipose Triglyceride Lipase (Pnpla2/ATGL; N,O), Patatin-like phospholipase domain-containing protein 3 (Pnpla3; P,Q) were measured in livers of control-fed (black) and alcohol-fed (red) Bmal1 Flox/Flox (Fl/Fl) and control-fed (purple) and alcohol-fed (green) Bmal1 liver-specific knockout (LKO) mice at ZT 3, 7, 11, 15, 19, and 23 (ZT 0: lights on/inactive period, ZT 12: lights off/active period, gray area) by RT-PCR. Data are presented as a fold-change to the Bmal1 Fl/Fl control diet trough time-point and normalized to Ppia. Data are expressed as mean ± SEM for n = 4–8 mice/genotype/diet/time point. Solid lines indicate rhythmic mRNA levels and a significant cosine fit, whereas dashed lines indicate arrhythmicity and a non-significant cosine fit. Results for Cosinor and ANOVA analyses are provided in Supplementary Tables 4 and 6, respectively.
Figure 8
Figure 8
Chronic alcohol and liver clock disruption alter diurnal mRNA rhythms of lipid droplet-associated genes. Diurnal mRNA profiles of lipid droplet genes Perilipin 2 (Plin2; A,B), Perilipin 5 (Plin5; C,D), Abhydrolase domain containing 5/Comparative Gene Interaction-58 (Abdh5/CGI-58; E,F), Hormone sensitive lipase (Lipe/HSL; G,H), and Monoacylglycerol lipase (Mgll; I,J) were measured in livers of control-fed (black) and alcohol-fed (red) Bmal1 Flox/Flox (Fl/Fl) and control-fed (purple) and alcohol-fed (green) Bmal1 liver-specific knockout (LKO) mice at ZT 3, 7, 11, 15, 19, and 23 (ZT 0: lights on/inactive period, ZT12: lights off/active period, gray area) by RT-PCR. Data are presented as a fold-change to the Bmal1 Fl/Fl control diet trough time-point and normalized to Ppia. Data are expressed as mean ± SEM for n = 4–8 mice/genotype/diet/time point. Solid lines indicate rhythmic mRNA levels and a significant cosine fit, whereas dashed lines indicate arrhythmicity and a non-significant cosine fit. Diagram of a lipid droplet and lipid droplet-associated turnover proteins and enzymes (K). After phosphorylation, PLIN recruits lipases to the surface of the lipid droplet to initiate TG breakdown to glycerol and FA. Results for Cosinor and ANOVA analyses are provided in Supplementary Tables 4 and 7, respectively.
Figure 9
Figure 9
Chronic alcohol and liver clock disruption differentially alter triglyceride fatty acid saturation in the liver. Triglyceride (TG) fatty acid (FA) saturation as a percentage of total saturated fatty acids (SFA, A), monounsaturated fatty acids (MUFA, B), diunsaturated fatty acids (DUFA, C), and polyunsaturated fatty acids (PUFA, D) was determined in liver lipid extracts from control-fed (black) and alcohol-fed (red) Bmal1 Flox/Flox (Fl/Fl) and control-fed (purple) and alcohol-fed (green) Bmal1 liver-specific knockout (LKO) mice at ZT 3 and ZT 15 (ZT = 0: lights on/inactive active, ZT = 12: lights offs/active period) using MS/MSALL. Data are mean ± SEM for n = 3–4 mice/genotype/diet/time-point. Results for ANOVA analyses are provided in Supplementary Table 9.
Figure 10
Figure 10
Chronic alcohol and liver clock disruption differentially alter triglyceride fatty acid composition in the liver. Fatty acids (FA, B–O) as a percentage of the total triglyceride (TG) FA pool was determined in liver lipid extracts from control-fed (black) and alcohol-fed (red) Bmal1 Flox/Flox (Fl/Fl) and control-fed (purple) and alcohol-fed (green) Bmal1 liver-specific knockout (LKO) mice at ZT 3 and ZT 15 (ZT 0: lights on/inactive period, ZT 12: lights offs/active period) using MS/MSALL. FA common names and structure are shown in panel (A). Data are mean ± SEM for n = 3–4 mice/genotype/diet/time-point. Results for ANOVA analyses and relevant pair-wise comparisons are provided in Supplementary Tables 9–12, respectively.

Similar articles

Cited by

References

    1. Abdelmegeed M. A., Yoo S. H., Henderson L. E., Gonzalez F. J., Woodcroft K. J., Song B. J. (2011). PPARalpha expression protects male mice from high fat-induced nonalcoholic fatty liver. J. Nutr. 141, 603–610. 10.3945/jn.110.135210, PMID: - DOI - PMC - PubMed
    1. Abu-Elheiga L., Brinkley W. R., Zhong L., Chirala S. S., Woldegiorgis G., Wakil S. J. (2000). The subcellular localization of acetyl-CoA carboxylase 2. Proc. Natl. Acad. Sci. U. S. A. 97, 1444–1449. - PMC - PubMed
    1. Adamovich Y., Rousso-Noori L., Zwighaft Z., Neufeld-Cohen A., Golik M., Kraut-Cohen J., et al. . (2014). Circadian clocks and feeding time regulate the oscillations and levels of hepatic triglycerides. Cell Metab. 19, 319–330. 10.1016/j.cmet.2013.12.016, PMID: - DOI - PMC - PubMed
    1. Aviram R., Manella G., Kopelman N., Neufeld-Cohen A., Zwighaft Z., Elimelech M., et al. . (2016). Lipidomics analyses reveal temporal and spatial lipid organization and uncover daily oscillations in intracellular organelles. Mol. Cell 62, 636–648. 10.1016/j.molcel.2016.04.002, PMID: - DOI - PubMed
    1. Bailey S. M., Cunningham C. C. (1998). Acute and chronic ethanol increases reactive oxygen species generation and decreases viability in fresh, isolated rat hepatocytes. Hepatology 28, 1318–1326. 10.1002/hep.510280521, PMID: - DOI - PubMed