

Progress Update and Challenges on O2max Testing and Interpretation
- PMID: 33013459
- PMCID: PMC7494971
- DOI: 10.3389/fphys.2020.01070
Progress Update and Challenges on O2max Testing and Interpretation
Abstract
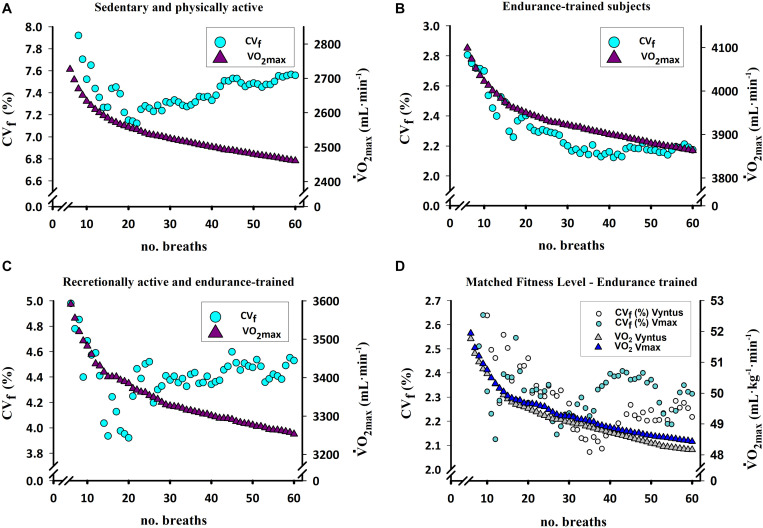
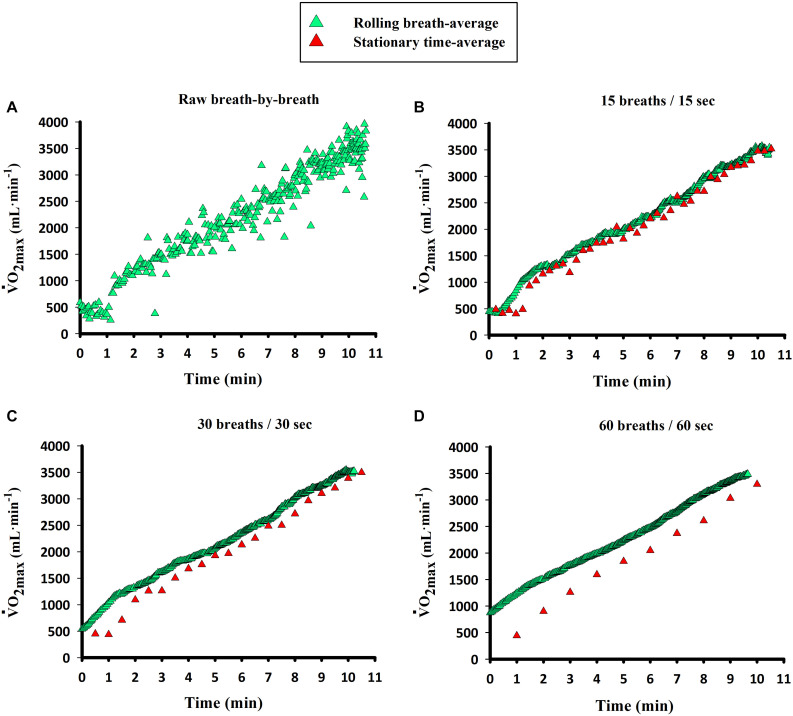
The maximal oxygen uptake ( O2max) is the primary determinant of endurance performance in heterogeneous populations and has predictive value for clinical outcomes and all-cause mortality. Accurate and precise measurement of O2max requires the adherence to quality control procedures, including combustion testing and the use of standardized incremental exercise protocols with a verification phase preceded by an adequate familiarization. The data averaging strategy employed to calculate the O2max from the breath-by-breath data can change the O2max value by 4-10%. The lower the number of breaths or smaller the number of seconds included in the averaging block, the higher the calculated O2max value with this effect being more prominent in untrained subjects. Smaller averaging strategies in number of breaths or seconds (less than 30 breaths or seconds) facilitate the identification of the plateau phenomenon without reducing the reliability of the measurements. When employing metabolic carts, averaging intervals including 15-20 breaths or seconds are preferable as a compromise between capturing the true O2max and identifying the plateau. In training studies, clinical interventions and meta-analysis, reporting of O2max in absolute values and inclusion of protocols and the averaging strategies arise as imperative to permit adequate comparisons. Newly developed correction equations can be used to normalize O2max to similar averaging strategies. A lack of improvement of O2max with training does not mean that the training program has elicited no adaptations, since peak cardiac output and mitochondrial oxidative capacity may be increased without changes in O2max.
Keywords: breath-by-breath; calibration; cardiopulmonary exercise testing; indirect calorimetry; metabolic cart; performance; ramp exercise; reproducibility.
Copyright © 2020 Martin-Rincon and Calbet.
Figures
References
Publication types
LinkOut - more resources
Full Text Sources