

Continuous Blood Pressure Estimation From Electrocardiogram and Photoplethysmogram During Arrhythmias
- PMID: 33013491
- PMCID: PMC7509183
- DOI: 10.3389/fphys.2020.575407
Continuous Blood Pressure Estimation From Electrocardiogram and Photoplethysmogram During Arrhythmias
Abstract
Objective: Continuous blood pressure (BP) provides valuable information for the disease management of patients with arrhythmias. The traditional intra-arterial method is too invasive for routine healthcare settings, whereas cuff-based devices are inferior in reliability and comfortable for long-term BP monitoring during arrhythmias. The study aimed to investigate an indirect method for continuous and cuff-less BP estimation based on electrocardiogram (ECG) and photoplethysmogram (PPG) signals during arrhythmias and to test its reliability for the determination of BP using invasive BP (IBP) as reference.
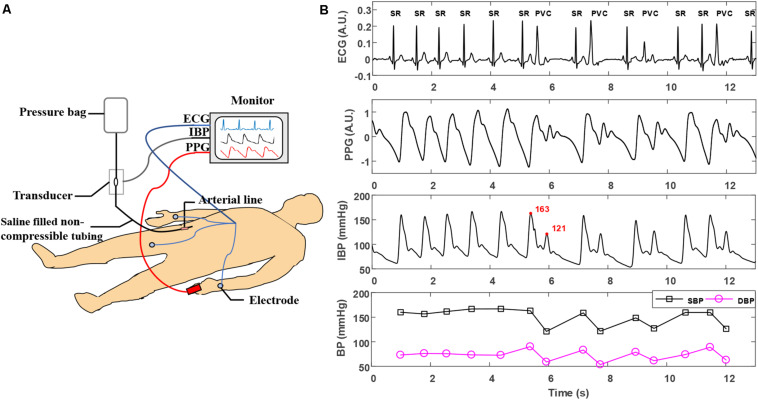
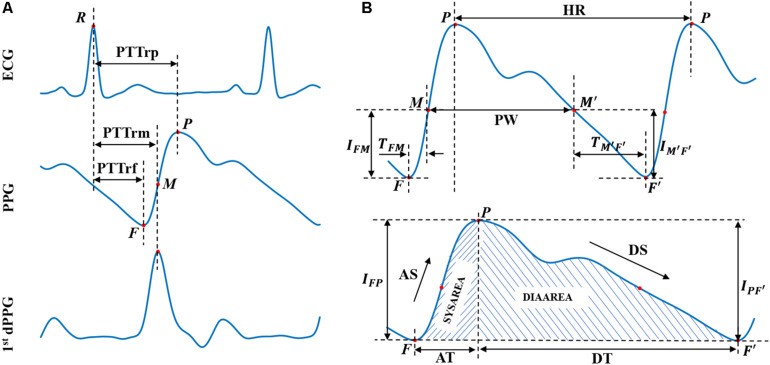
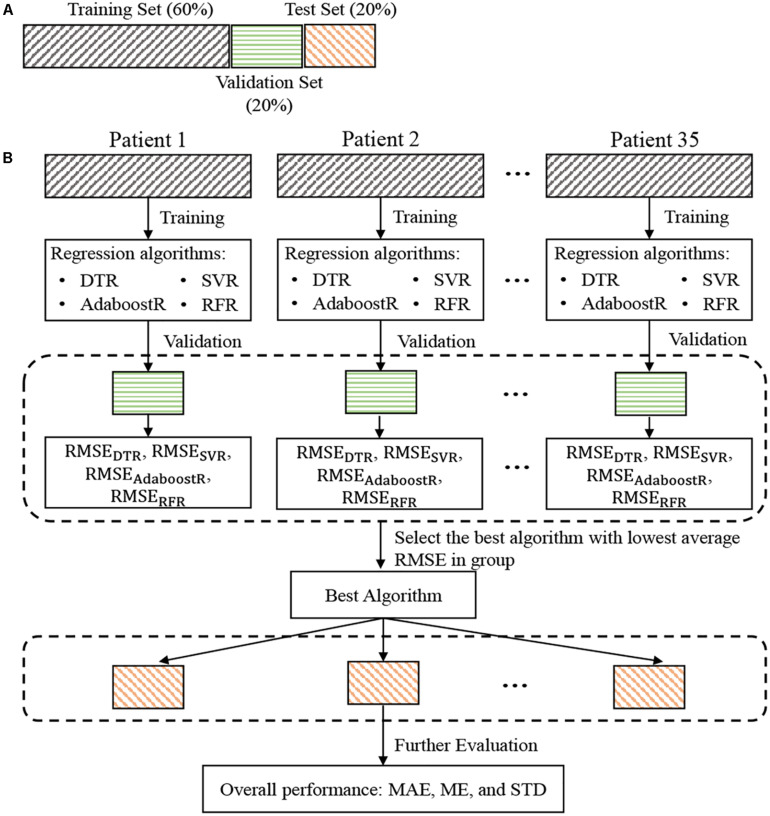
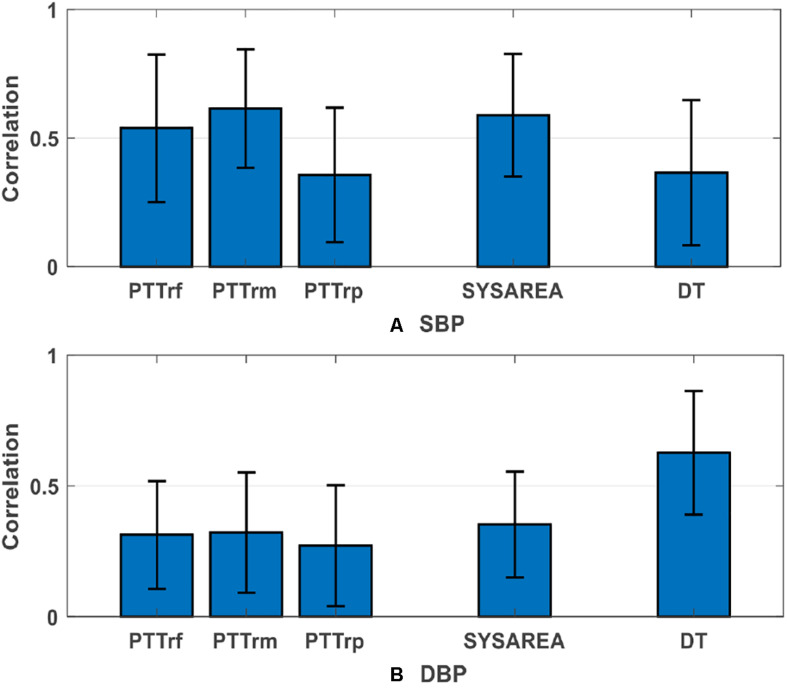
Methods: Thirty-five clinically stable patients (15 with ventricular arrhythmias and 20 with supraventricular arrhythmias) who had undergone radiofrequency ablation were enrolled in this study. Their ECG, PPG, and femoral arterial IBP signals were simultaneously recorded with a multi-parameter monitoring system. Fifteen features that have the potential ability in indicating beat-to-beat BP changes during arrhythmias were extracted from the ECG and PPG signals. Four machine learning algorithms, decision tree regression (DTR), support vector machine regression (SVR), adaptive boosting regression (AdaboostR), and random forest regression (RFR), were then implemented to develop the BP models.
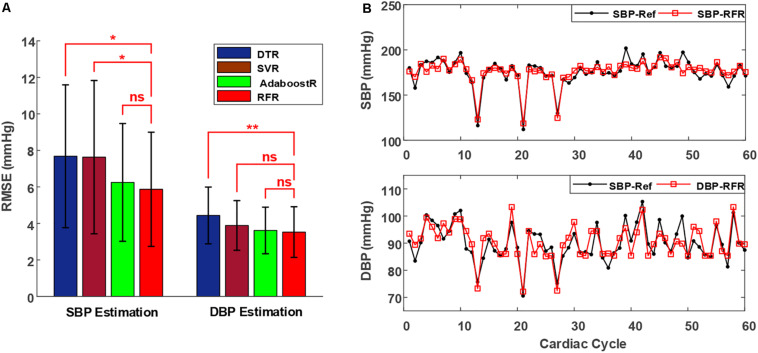
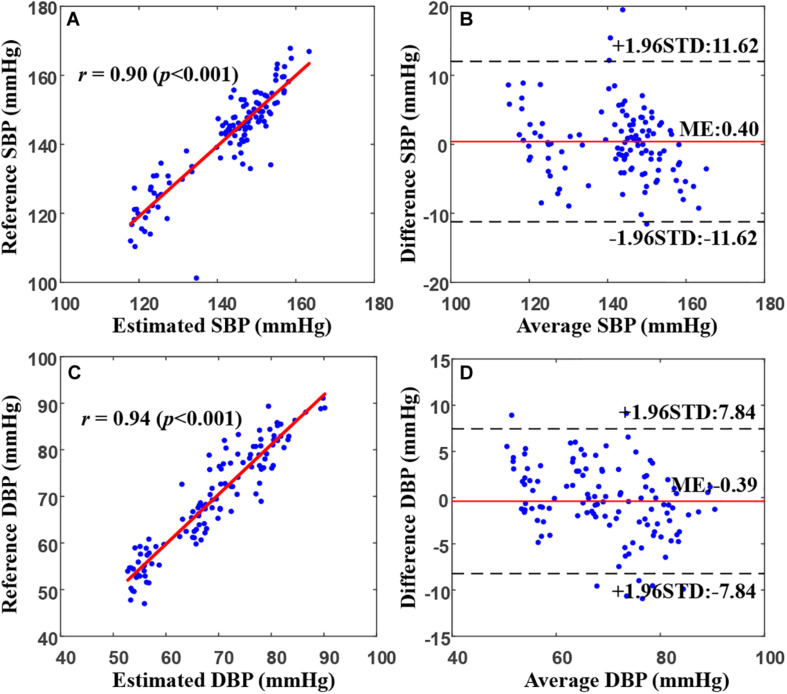
Results: The results showed that the mean value ± standard deviation of root mean square error for the estimated systolic BP (SBP), diastolic BP (DBP) with the RFR model against the reference in all patients were 5.87 ± 3.13 and 3.52 ± 1.38 mmHg, respectively, which achieved the best performance among all the models. Furthermore, the mean error ± standard deviation of error between the estimated SBP and DBP with the RFR model against the reference in all patients were -0.04 ± 6.11 and 0.11 ± 3.62 mmHg, respectively, which complied with the Association for the Advancement of Medical Instrumentation and the British Hypertension Society (Grade A) standards.
Conclusion: The results indicated that the utilization of ECG and PPG signals has the potential to enable cuff-less and continuous BP estimation in an indirect way for patients with arrhythmias.
Keywords: arrhythmias; continuous blood pressure; electrocardiogram; machine learning algorithms; photoplethysmogram.
Copyright © 2020 Liu, Zhou, Li, Tang and Miao.
Figures
Similar articles
-
A continuous cuffless blood pressure measurement from optimal PPG characteristic features using machine learning algorithms.Heliyon. 2024 Mar 12;10(6):e27779. doi: 10.1016/j.heliyon.2024.e27779. eCollection 2024 Mar 30. Heliyon. 2024. PMID: 38533045 Free PMC article.
-
Continuous blood pressure measurement from one-channel electrocardiogram signal using deep-learning techniques.Artif Intell Med. 2020 Aug;108:101919. doi: 10.1016/j.artmed.2020.101919. Epub 2020 Jun 27. Artif Intell Med. 2020. PMID: 32972654
-
A hybrid neural network for continuous and non-invasive estimation of blood pressure from raw electrocardiogram and photoplethysmogram waveforms.Comput Methods Programs Biomed. 2021 Aug;207:106191. doi: 10.1016/j.cmpb.2021.106191. Epub 2021 May 21. Comput Methods Programs Biomed. 2021. PMID: 34077866
-
Assessment of Blood Pressure Using Only a Smartphone and Machine Learning Techniques: A Systematic Review.Front Cardiovasc Med. 2022 Jun 13;9:894224. doi: 10.3389/fcvm.2022.894224. eCollection 2022. Front Cardiovasc Med. 2022. PMID: 35770219 Free PMC article.
-
Waveform Analysis to Estimate Respiratory Rate.2016 Sep 10. In: MIT Critical Data, editor. Secondary Analysis of Electronic Health Records [Internet]. Cham (CH): Springer; 2016. Chapter 26. 2016 Sep 10. In: MIT Critical Data, editor. Secondary Analysis of Electronic Health Records [Internet]. Cham (CH): Springer; 2016. Chapter 26. PMID: 31314269 Free Books & Documents. Review.
Cited by
-
Towards a portable-noninvasive blood pressure monitoring system utilizing the photoplethysmogram signal.Biomed Opt Express. 2021 Nov 19;12(12):7732-7751. doi: 10.1364/BOE.444535. eCollection 2021 Dec 1. Biomed Opt Express. 2021. PMID: 35003863 Free PMC article.
-
Advances in Cuffless Continuous Blood Pressure Monitoring Technology Based on PPG Signals.Biomed Res Int. 2022 Oct 1;2022:8094351. doi: 10.1155/2022/8094351. eCollection 2022. Biomed Res Int. 2022. PMID: 36217389 Free PMC article. Review.
-
Advancement in the Cuffless and Noninvasive Measurement of Blood Pressure: A Review of the Literature and Open Challenges.Bioengineering (Basel). 2022 Dec 24;10(1):27. doi: 10.3390/bioengineering10010027. Bioengineering (Basel). 2022. PMID: 36671599 Free PMC article. Review.
-
Evaluation of the Accuracy of Cuffless Blood Pressure Measurement Devices: Challenges and Proposals.Hypertension. 2021 Nov;78(5):1161-1167. doi: 10.1161/HYPERTENSIONAHA.121.17747. Epub 2021 Sep 13. Hypertension. 2021. PMID: 34510915 Free PMC article. Review.
-
Improving the Accuracy in Classification of Blood Pressure from Photoplethysmography Using Continuous Wavelet Transform and Deep Learning.Int J Hypertens. 2021 Aug 5;2021:9938584. doi: 10.1155/2021/9938584. eCollection 2021. Int J Hypertens. 2021. PMID: 34394983 Free PMC article.
References
-
- Alpert B., Mccrindle B., Daniels S., Dennison B., Hayman L., Jacobson M., et al. (2006). Recommendations for blood pressure measurement in human and experimental animals; part 1: blood pressure measurement in humans. Hypertension 48:e3. - PubMed
-
- Arza A., Lázaro J., Gil E., Laguna P., Bailón R. (2013). “Pulse transit time and pulse width as potential measure for estimating beat-to-beat systolic and diastolic blood pressure,” in Proceedings of the Computing in Cardiology, Zaragoza.
-
- Association for the Advancement of Medical Instrumentation [AAMI] (2009). Non-Invasive Sphygmomanometers - Part 2: Clinical Validation of Automated Measurement Type. Arlington, VA: Association for the Advancement of Medical Instrumentation.
-
- Awad M., Khanna R. (2015). “Support vector regression,” in Efficient Learning Machines: Theories, Concepts, and Applications for Engineers and System Designers, eds Awad M., Khanna R. (Berkeley, CA: Apress; ), 67–80.
LinkOut - more resources
Full Text Sources