. 2020 Sep 8:11:978.
doi: 10.3389/fneur.2020.00978. eCollection 2020.

Single-Arm, Non-randomized, Time Series, Single-Subject Study of Fecal Microbiota Transplantation in Multiple Sclerosis

Affiliations

Single-Arm, Non-randomized, Time Series, Single-Subject Study of Fecal Microbiota Transplantation in Multiple Sclerosis

Phillip A Engen et al. Front Neurol. .

Abstract

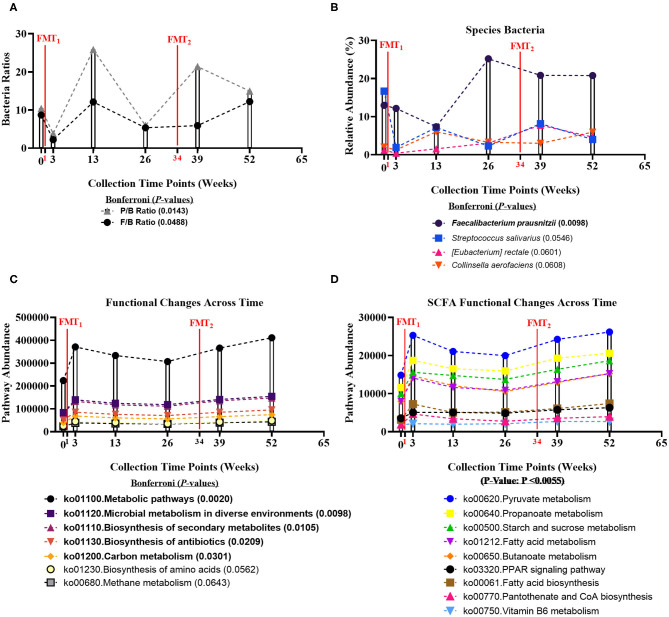
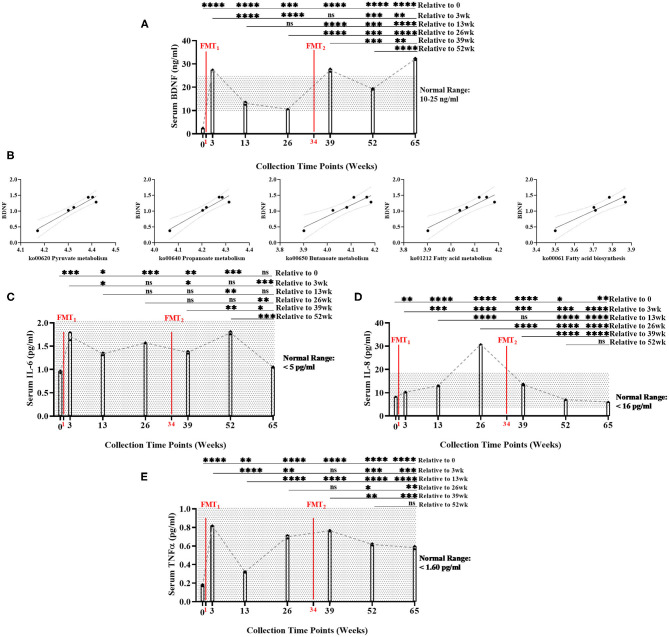
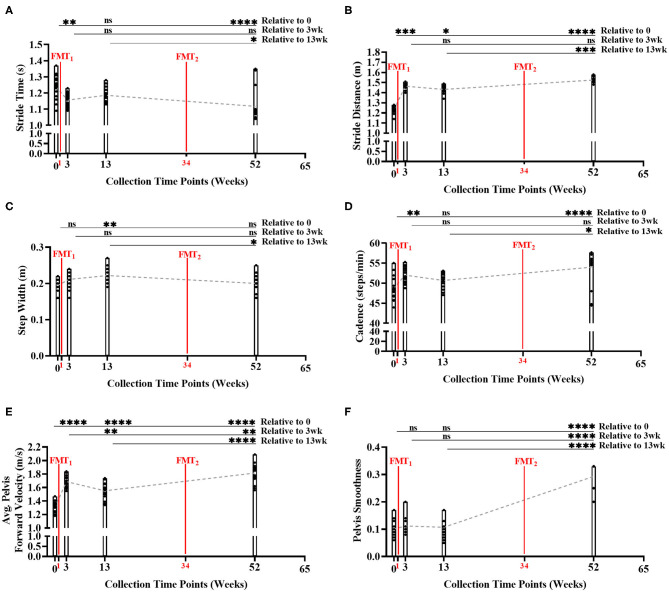
Emerging evidence suggests intestinal microbiota as a central contributing factor to the pathogenesis of Relapsing-Remitting-Multiple-Sclerosis (RRMS). This novel RRMS study evaluated the impact of fecal-microbiota-transplantation (FMT) on a broad array of physiological/clinical outcomes using deep metagenome sequencing of fecal microbiome. FMT interventions were associated with increased abundances of putative beneficial stool bacteria and short-chain-fatty-acid metabolites, which were associated with increased/improved serum brain-derived-neurotrophic-factor levels and gait/walking metrics. This proof-of-concept single-subject longitudinal study provides evidence of potential importance of intestinal microbiota in the pathogenesis of MS, and scientific rationale to help design future randomized controlled trials assessing FMT in RRMS patients.

Keywords: brain-derived neurotrophic factor; fecal microbiota transplantation; gait; metabolomics; microbiome; multiple sclerosis; relapsing-remitting multiple sclerosis; short-chain fatty acids.


Figures

Figure 1
Figure 1
Bacteria ratios, species, and genomic pathways significant movements across time of study. Differential shifts in percent relative abundance across time for (A) bacterial ratios of Firmicutes-to-Bacteroidetes (F/B) (Bonferroni: P = 0.0488) and Prevotellaceae-to-Bacteroidaceae (P/B) (Bonferroni: P = 0.0143) and (B) butyrate-producing species, like Faecalibacterium prausnitzii (Bonferroni: P = 0.0098). Significant differential shifts in abundance across time for (C) non-targeted functional gene pathways (Bonferroni: P < 0.05); and (D) targeted SCFA functional gene pathways (P-value: P < 0.0055). Results were summarized over six collection time points using the linear model R/Bioconductor software package limma, and adjusted with the stringent Bonferroni post-hoc test. Directional mean trend dotted line shown across collection time points and FMT weeks.
Figure 2
Figure 2
Measurement of serum biomarker changes over time of study. (A) Brain-derived neurotrophic factor (BDNF) (ng/ml) measurements significantly increased between baseline and end of study (Bonferroni: P < 0.0001). (B) Positive linear regression relationships between BDNF and SCFA functional gene pathways across time (R2 > 0.90, P < 0.008). (C) Interleukin-6 (IL-6) (pg/ml) did not significantly change between baseline and end of study (Bonferroni: P > 0.9999); (D) Interleukin-8 (IL-8) (pg/ml) significantly decreased between baseline and end of study (Bonferroni: P < 0.0012); and (E) Tumor necrosis factor alpha (TNF-α) (pg/ml) significantly increased between baseline and end of study, but remained with normal range (Bonferroni: P < 0.0001). Results were summarized over seven collection time points using repeated measures one-way ANOVA, and adjusted with the stringent Bonferroni post-hoc test. Biomarker's classified “normal ranges” derived from ELISA standard protocols. Directional mean trend dotted line shown across collection time points and FMT weeks. Post-hoc test adjusted P-values: ns, no significance, * < 0.05, ** < 0.01, *** < 0.001, **** < 0.0001.
Figure 3
Figure 3
Measurement of normal gait metrics changes over time of study. Five of the six gait metrics significantly improved between baseline and end of study: (A) stride time (Bonferroni: P < 0.0001); (B) stride distance (Bonferroni: P < 0.0001); (C) step width (Bonferroni: P > 0.9999); (D) cadence (Bonferroni: P < 0.0001); (E) average forward velocity (Bonferroni: P < 0.0001); and (F) pelvis smoothness (Bonferroni: P < 0.0001). Results were summarized over four collection time points using parametric repeated measures 1-way ANOVA or non-parametric Friedman's test, and adjusted with the stringent Bonferroni or Dunn's multiple group comparison post-hoc tests. Directional mean trend dotted line shown across collection time points and FMT weeks. Post-hoc test's adjusted P-values: ns, no significance, * < 0.05, ** < 0.01, *** < 0.001, **** < 0.0001.

References

    1. Lassmann H, Bruck W, Lucchinetti CF. The immunopathology of multiple sclerosis: an overview. Brain Pathol. (2007) 17:210–8. 10.1111/j.1750-3639.2007.00064.x - DOI - PMC - PubMed
    1. Lassmann H. Pathogenic mechanisms associated with different clinical courses of multiple sclerosis. Front Immunol. (2018) 9:3116. 10.3389/fimmu.2018.03116 - DOI - PMC - PubMed
    1. Calabresi PA. Diagnosis and management of multiple sclerosis. Am Fam Physician. (2004) 70:1935–44. - PubMed
    1. Thompson AJ, Banwell BL, Barkhof F, Carroll WM, Coetzee T, Comi G, et al. . Diagnosis of multiple sclerosis: 2017 revisions of the McDonald criteria. Lancet Neurol. (2018) 17:162–73. 10.1016/S1474-4422(17)30470-2 - DOI - PubMed
    1. Collaborators GBDMS. Global, regional, and national burden of multiple sclerosis 1990-2016: a systematic analysis for the Global Burden of Disease Study (2016). Lancet Neurol. (2019) 18:269–85. 10.1016/S1474-4422(18)30443-5 - DOI - PMC - PubMed

LinkOut - more resources