. 2020 Sep 8:11:628.
doi: 10.3389/fendo.2020.00628. eCollection 2020.

Correlation Between Fecal Metabolomics and Gut Microbiota in Obesity and Polycystic Ovary Syndrome

Affiliations

Correlation Between Fecal Metabolomics and Gut Microbiota in Obesity and Polycystic Ovary Syndrome

Ling Zhou et al. Front Endocrinol (Lausanne). .

Abstract

Objective: This study aimed to explore the relationship between the fecal metabolites and gut microbiota in obese patients with PCOS and provide a new strategy to elucidate the pathological mechanism of obesity and PCOS. Methods: The fecal samples of obese patients with PCOS (n = 18) and obese women without PCOS (n = 15) were analyzed by 16S rRNA gene sequencing and untargeted metabolomics. The peripheral venous blood of all subjects was collected to detect serum sex hormones. The association among fecal metabolites, gut microbiota, and serum sex hormones was analyzed with the R language. Results: A total of 122 named differential fecal metabolites and 18 enrichment KEGG pathways were obtained between the groups. Seven fecal metabolites can be used as characteristic metabolites, including DHEA sulfate. The richness and diversity of gut microbiota in the obese PCOS group were lower than those in the control group. Lachnoclostridium, Fusobacterium, Coprococcus_2, and Tyzzerela 4 were the characteristic genera of the obese patients with PCOS. Serum T level significantly and positively correlated with the abundance of fecal DHEA sulfate (p < 0.05), and serum DHEAS level significantly and negatively correlated with the abundance of fecal teasterone (p < 0.05). Conclusion: Specific fecal metabolites may be used as characteristic metabolites for obese patients with PCOS. The closely relationship among gut microbiota, fecal metabolites, and serum sex hormones may play a role in the related changes caused by hyperandrogenemia.

Keywords: biomarkers; gut microbiota; obesity; polycystic ovary syndrome; untargeted metabolomics.


Figures

Figure 1
Figure 1
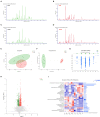
The difference of fecal metabolites between the two groups. Based peak ion flow chromatogram of fecal supernatant under negative (A) and positive ion mode (B) in control group, and under negative (C) and positive ion mode (D) in obese PCOS group. (E) PCA map. The distance of each coordinate point represents the degree of aggregation and dispersion between samples. (F) OPLS-DA map. The first prediction of Comp1 is mainly the decomposition degree, and the first orthogonality of orthogonal Comp1 is the decomposition degree. (G) Model verification map of OPLS-DA. The abscissa represents the replacement retention of the replacement test; the ordinate represents the R2 (green dot) and Q2 (blue triangle) replacement test values; and the two dashes represent the regression lines of R2 and Q2 respectively. (H) Volcanic map of differential metabolites. The abscissa is the multiple change value of the expression difference of metabolites between the two groups, and the ordinate is the statistical test value of the expression difference of metabolites, that is, p-value. The abscissa and ordinate values are all logarithmically processed. Each point in the figure represents a specific metabolite. (I) Heatmap of differential metabolites (VIP > 3, p < 0.05) between groups. The color represents the relative abundance of the metabolite in samples. On the right is the VIP bar graph of metabolites. The length of the bar represents the contribution value of the metabolite to the difference between the groups. *p < 0.05; **p < 0.01; ***p < 0.001.
Figure 2
Figure 2
Analysis of KEGG pathway related to differential metabolites. (A) KEGG pathways on level 1 and level 2 related to differential metabolites. The ordinate is the name of pathway level 2, and the abscissa is the number of metabolites related to the pathway. Different colors represent different pathways on level 1. (B) KEGG pathway enrichment column chart. The abscissa is the name of pathway level 3. (C–I) Receiver operator characteristic curves of seven metabolites. Area under the curve (AUC) indicates the discrimination performance. Confidence interval (CI) represents 95% confidence interval of AUC calculated based on nonparametric resampling method. The point on the curve refers to the best threshold which is determined based on ROC curve to distinguish the two groups. The ordinate is the enrichment rate, that is, the ratio of the number of metabolites enriched in the pathway to the number of metabolites annotated in the pathway. *p < 0.05; **p < 0.01; ***p < 0.001.
Figure 3
Figure 3
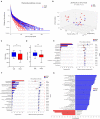
Characteristics of gut microbiota between the two groups. (A) Rank-Abundance curves. The abscissa represents the ranking level of OTU number, and the ordinate represents the relative percentage of OTU number. The abscissa position at the extension end of sample curve is the number of OTU of the sample. (B) 3D-PCoA chart. the X, Y and Z axis represent three selected principal axes, and the percentage represents the explanatory value of the principal axis to the difference of samples. (C) The Sobs index of obese PCOS group was significantly lower than that of control group, and (D) no significant difference on Shannon index was found between groups. (E) The column chart of species abundance on phylum level. (F) The column chart of top 20 species with significant difference on genus level. The left X-axis represents different groups, the Y-axis represents the average relative abundance of a species in different groups, and the right represents the confidence interval and p-value. (G) LDA chart. The score was obtained by LDA analysis (linear regression analysis). The greater the LDA score, the greater the impact of the representative species abundance on the differences between groups. *p < 0.05; **p < 0.01.
Figure 4
Figure 4
Correlation analysis of gut microbiota, fecal metabolites and serum sex hormones in obese PCOS group. (A) Correlation heatmap between seven important differential fecal metabolites and the top 30 genera in abundance. (B) Correlation heatmap between serum sex hormones and the top 30 genera in abundance. (C) Correlation heatmap between serum sex hormones and seven important differential fecal metabolites. Different colors represent correlation level; *p < 0.05; **p < 0.01, ***p < 0.001. (D) Correlation map among gut microbiota, fecal metabolites and serum sex hormones. The red line represents a significant positive correlation, while the green line represents a significant negative correlation; the up arrow represents an increase in abundance, while the down arrow represents a decrease in abundance; one, two and three arrows represents p > 0.05, p < 0.01, and p < 0.001, respectively.

Similar articles

Cited by

References

    1. Forslund M, Landin-Wilhelmsen K, Trimpou P, Schmidt J, Brännström M, Dahlgren E. Type 2 diabetes mellitus in women with polycystic ovary syndrome during a 24-year period: importance of obesity and abdominal fat distribution. Human Reprod Open. (2020) 1:hoz042. 10.1093/hropen/hoz042 - DOI - PMC - PubMed
    1. Yu J, Yu CQ, Cao Q, Wang L, Wang WJ, Zhou LR, et al. . Consensus on the integrated traditional Chinese and Western medicine criteria of diagnostic classification in polycystic ovary syndrome (draft). J Integr Med. (2017) 15:102–9. 10.1016/S2095-4964(17)60331-5 - DOI - PubMed
    1. Obesity Group Endocrinology Branch Chinese Medical Association Consensus on prevention of Chinese adult obesity. Chin J Endocrinol Metab. (2011) 27:711–7. 10.3760/cma.j.issn.1000-6699.2011.09.003 - DOI
    1. Barber TM, Hanson P, Weickert MO, Franks S. Obesity and polycystic ovary syndrome: implications for pathogenesis and novel management strategies. Clin Med Insights Reprod Health. (2019) 13:1179558119874042. 10.1177/1179558119874042 - DOI - PMC - PubMed
    1. Bou Nemer L, Shi H, Carr BR, Word RA, Bukulmez O. Effect of body weight on metabolic hormones and fatty acid metabolism in follicular fluid of women undergoing in vitro fertilization: a pilot study. Reprod Sci. (2019) 26:404–41. 10.1177/1933719118776787 - DOI - PubMed

Publication types

Substances